Agent-Based Buyer-Trader Interaction Model of Traditional Markets

Author: Purba D. Kusuma, Azhari, Reza Pulungan
Journal: International Journal of Intelligent Systems and Applications(IJISA) @ijisa
Article in issue: 11 vol.8, 2016.
Free access
One problem in simulating crowds in traditional markets is calculating the interaction duration between traders and buyers. This problem can be solved in a simple way by doing field observation to obtain some samples to find the average interaction duration between traders and buyers. This method is simple. On the other hand, the result will be less valid if the parameters are change. The purpose of this research is to develop an interaction model between traders and buyers by looking deeper into the negotiation process. This model is developed based on multi-agent system. Output of this model is the interaction duration. This model has been implemented in a traditional market crowd simulation. Based on the simulation, by adjusting the parameters in this model, the interaction duration by the model matches the real condition in traditional markets.
Interaction model, negotiation, multi-agent system, traditional market
Short address: https://sciup.org/15010870
IDR: 15010870
Text of the scientific article Agent-Based Buyer-Trader Interaction Model of Traditional Markets
Published Online November 2016 in MECS
There are a lot of researches in developing negotiation models. Some researches focus on finding the agreement between parties [1]. Others focus on finding the effect of some parameters that affect the negotiation process, such as the number of parties [2,3], the number of issues [4], the method that is adopted in negotiation process [5], and so on. Unfortunately, it is difficult to find researches in developing negotiation model that focus in calculating the negotiation duration.
Negotiation is one of important processes in traditional markets. Before a transaction occurs, there is a negotiation between a trader and a buyer to reach agreement in product, price, and quantity. The agreement must cover these three aspects. If there is at least one aspect that the trader and the buyer fail to reach agreement on, then there will be no transaction.
The biggest problem in developing the negotiation model is that there is a lot of variations in negotiation process between traders and buyers. The challenge then is how to generalize the various negotiation processes between traders and buyers, so that the general model is still valid to use in estimating the interaction duration between traders and buyers in traditional markets.
This research contributes in developing an interaction model between traders and buyers in traditional markets, especially in daily goods traditional markets. The model will be developed by combining existing negotiation models, buyers ’ characteristics, and traders ’ characteristics. The combined model then will be adjusted according to information about interaction process gathered from field observation.
This research is a part of a bigger research, which is developing a crowd simulation for traditional markets. The proposed interaction model then will be implemented in a traditional market crowd simulation to validate how close the output of the model, which is interaction duration between traders and buyers, with the condition in the reality.
This paper is organized as follows. Section I describes the problem statement, research purpose, and the structure of the paper. Section II provides an overview of the most significant related work. Section III explains the actual data obtained from field observation. Section IV presents the proposed model. Section V discusses the simulation and the resulting data produced by the simulation. Section VI concludes the paper.
-
II. R ELATED W ORK
Negotiation theory and model have been developed in many fields of study, such as economics, management, mathematics, and computer science. In practical management, negotiation strategies and tactics are developed to win negotiations [5-8]. In economics, negotiation is developed to analyze economic phenomena [1,2]. In mathematics, negotiation models are developed based on game theory [9,10]. In computer science, negotiation has been developed as a part of artificial intelligence to create intelligent agent [11,12].
Based on the number of issues negotiated, negotiations can be divided into single issue negotiations and multiissue negotiations. Researchers have developed negotiation models based on single issue negotiation models [4,13,14], and others have developed negotiation model based on multi-issue negotiation models [3, 15-19]. Single issue approach has been used in some negotiation models because of its simplicity. Multi-issue approach has been used in some negotiation models because many negotiations in real world consist of more than one issue.
Based on the number of the participants, negotiations can be divided into bilateral negotiations and multi-lateral negotiations. Researchers have developed negotiation models as a bilateral negotiation [3]. Others researchers have also developed negotiation models as a multi-lateral negotiation [20,21].
In multi-issue negotiations, there are two problem solving mechanisms. First, issue is discussed step by step. The second is known as package deal, in which all issues are discussed in one time or session [14]. The two mechanisms have advantages and disadvantages. For problems that are connected to each other, package deal is better because step-by-step discussion is not effective [18]. However, if there are high tension frictions during the discussion, step-by-step approach is better [18]. Step-by-step approach can be combined with splitting the big issues into small fractions and solving the small issues step-by-step to reduce the failure potential. Another advantage of step-by-step approach is avoiding the complexity [15].
There are several bargaining mechanisms. Global bargaining is a bargaining mechanism, in which all issues are discussed in one time. Separate bargaining is a bargaining mechanism where the issues are grouped and negotiated separately [15]. Sequential bargaining is a bargaining mechanism where issues are discussed serially and sequentially [15].
Information is an important factor in negotiations. Incomplete information can create disagreement or inefficient agreement [22]. In many negotiations, information acquisition can be asymmetric, which means one party is better informed than the other [17]. In negotiations, not all information can be trusted. One affecting factor of trust is reputation [23].
There are several methods that traders can use to set the price. The simple one is cost-based pricing [24]. In cost-based pricing, the price is determined by adding the production cost with an expected profit. In customer-driven pricing, the price is determined by calculating the costumer’s perceived value of the product [24]. The other common mechanism in pricing strategy is discount. There are several discount types: volume discount, order discount, and step discount [24]. The fourth is two-part pricing [24].
There are eight customer decision making styles : perfectionist, brand conscious, fashion conscious, price conscious, confused by over choices, recreational, impulsive, and brand loyalty [25]. Perfectionist customers give high attention in product’s detail and quality [25]. Brand conscious customers think that the brand power is related with the quality [25]. Fashion conscious customers give more attention to innovative products [25]. Price conscious customers think that the price is related to the quality [25]. Confused by over choices customers like limited product choices [25]. Recreational customers are customers who purchase product for having fun [25].
Beside the decision making style, there are several demographic factors that influent customers’ behavior in a store: sex, age group, economic status, education level, occupation, and religion [26,27]. Customer purchasing behavior can be categorized into purchasing place, product, purchasing time, purchasing frequency, purchasing mechanism, and customer’s response to promotion activities [26].
Impulse buying is unplanned buying. Impulse buying is a common phenomenon in retail activity. Impulse buying can be defined as unplanned purchasing that occurs spontaneously because there is a strong willingness and emotional conflict inside the customer’s mind to buy some products [28]. Beside the customer internal character, impulse buying can be driven by promotion activities or purchasing incentives performed by traders [29]. On the other hand, impulsiveness is not correlated with sex. Women purchase more products rather than men not because women are more impulsive [30].
-
III. F IELD O BSERVATION
Field observation has been done to get the real situation about negotiation in a daily goods traditional market. Field observation has been done in Gedongkuning market, one of daily goods traditional markets in Yogyakarta, Indonesia. Several findings will be explored below and will be used to develop the negotiation model.
Price negotiation is not hard and tight. Goods sold in daily traditional markets are common commodities. Therefore, there is not any differentiation in product quality or brand for the same goods. For example, all traders who sell chicken sell chicken of the same quality. All traders therefore sell chicken at the same price for chicken of the same quality. No trader can sell chicken with higher price than others. The price is very sensitive and there is no reason for traders to sell chicken at higher price because the product is basically the same.
The demographic factor in daily goods traditional markets is described as follows. The size of the sample is 204 customers; 90.6% of them are female. All customers are adult.
In Gedongkuning, there is correlation between sex and purchasing behavior. Male or female has the same behavior in terms of the number of product items purchased, the quantity of each product item purchased, impulsiveness, and negotiation style. Therefore, sex will not be included as a parameter in the proposed model.
The number of product items customers buy from one trader varies from 1 to 7 product items. Most of customers purchase one product item for meat product. The number of product items purchased is higher for vegetables, seasoning, snacks, processed food, ready to eat food, and complementary products.
Some traders will offer other products if they cannot provide a product a customer asks. For example, if a customer asks for chicken breast and the trader does not have chicken breast anymore, the trader will offer other products, such as chicken leg, wing, or liver. The trader will give reason that the other products are perfect replacement of the requested product. If the customer agrees with the argument, then the customer will purchase the proposed goods.
Some traders will also offer other goods as complementary goods for goods the customer asks. For example, if the customer asks for carrots and the trader can provide them then the trader provides the carrots. After the deal, the trader may offer the customer to buy other complementary goods, such as broccoli or potatoes. In this situation, the trader offers some goods to cater to the customer’s impulse buying. In this case, the trader implements step-by-step and sequential approach. If the negotiation for complementary goods fails, at least the trader still has had the primary deal.
Some traders propose more quantity for the goods requested by the customer. In this case, the trader caters to the customer’s compulsive buying. Some traders offer volume discount if the customer agrees to buy more quantity of the product. Other traders do not give any discount for that. The traders may just give good reasons, such as the freshness of the product or the product is limited so the customer buys more quantity. Sometimes this proposal is rejected by the customer.
-
IV. P ROPOSED M ODEL
The interaction model is developed based on multiagent system. There exist two kinds of agents, trader and buyer. The relation between them is one-to-many. One trader can serve more than one buyer at the same time.
The output of the model is interaction duration between one trader and one buyer. Interaction duration consists of conversation duration and processing duration. Conversation duration is calculated from the number of products being negotiated. Processing duration is calculated based on the number of agreed products. Variables used in this model are as follows:
-
ti : interaction duration,
-
tc : conversation duration,
-
tp : processing duration,
Ab : buyer’s action,
At: trader’s action, tcmin: lower bound of conversation duration, tcmax: upper bound of conversation duration, tpmin: lower bound of processing duration, tpmax: upper bound of processing duration, nc: number of conversation,
-
ngc : number of negotiated product,
-
ng d : number of agreed product,
-
nup : number of planned product promotion,
nun: number of unplanned product negotiation, nmp: number of more quantity promotion, nmax: number of product items that trader can supply, npb: number of buyer’s price renegotiation action, npm: number of trader’s price renegotiation action, wnp: willingness to negotiate price, wcnp: current willingness to negotiate price, wpo: willingness to offer other product, wcpo: current willingness to offer other product, wpm: willingness to offer more quantity, wcpm: current willingness to offer more quantity, rpo: resistance on unplanned product offer, rcpo: current resistance on unplanned product offer, rqm: resistance on more quantity offer, rcqm: current resistance on more quantity offer, Xt: trader’s price at time t,
Y t : buyer’s price at time t ,
μ B : buyer’s reservation price,
μS : trader’s reservation price,
τ B : buyer’s target point, τS : trader’s target point.
Interaction between traders and buyers consists of some steps. The algorithm of the computation of the interaction duration is depicted in Fig. 1. The negotiation process consists of planned and unplanned product negotiations. The output of the negotiation process is the number of conversation ( nc ) and number of agreed products ( ng d ). Based on field observations, processing time and conversation time vary. Hence, the limit of conversation time ( tcm i n and tcmax ) and processing time ( tpm i n and tpmax ) are used to determine the conversation time and processing time for every dealt product. These four boundary variables are determined based on field observations.
begin planned_negotiation(nc,ngd) unplanned_negotiation(nc,ngd) t←0
for i=1 to n c
-
t c ← random(t cmin ,t cmax ) t ← t + t c
for i=1 to n gd
-
t p ← random(t pmin ,t pmax ) t ← t + t p
end
-
Fig.1. Interaction algorithm
There are two types of product negotiations: planned and unplanned ones. Planned product negotiations are negotiations, in which the buyer plans to purchase the product. Unplanned product negotiations are negotiations, in which the buyer does not plan the product, but instead, the trader offers it. Product negotiations, planned or unplanned, consist of two parts: price negotiation and quantity negotiation. This process is a step-by-step negotiation. Both parties proceed to quantity negotiation only if they have reached agreement in price negotiation.
The iteration of planned product negotiations depends on the buyer’s shopping plan list. The iteration proceeds from the first product to the last in the list that the trader can provide. Disagreements in price negotiations on some items do not affect negotiations on other items.
The iteration of unplanned product negotiation depends on trader’s willingness to offer products and the traders’ product variety. The iteration stops when the number of products negotiated by the trader and the buyer has reached the maximum number of product items that the trader supplies or the trader has no willingness anymore to offer other products. A trader’s action whether to continue or stop proposing unplanned products is illustrated in Equation (1). A trader’s current willingness to offer another product (wcpo) is generated randomly when one session of product negotiation has been finished. Buyer’s respond to the trader’s other product proposal depends on her resistance to unplanned product proposal. A buyer’s respond to a trader’s unplanned product proposal is illustrated in Equation (2).
( offer , Пдс < ^Чпах ∨ WCpo ≤ Wp0, I stop , else ․ reject , ≤ ,
Ab ={ i stop , else .
In daily goods traditional markets, price negotiation usually proceeds quickly. It is even common that a buyer doesn’t negotiate the price at all. On the other hand, it still can be found that a buyer negotiates the price proposed by a trader. In this model, beside the reservation price and target point factor, the trader’s and the buyer’s willingness to negotiate the price play significant role. Three possible actions may be taken by both parties: deal, break, or renegotiate. Each action increments the number of conversation ( nc ). Matrices showing the situations that trigger action taken by the trader or the buyer in a price negotiation are depicted in Tables 1 and 2.
Table 1. Trader’s possible action during price negotiation
|
Y t |
Trader’s Action |
|
|
wcnp ≤wnp |
wcnp >wnp |
|
|
Y t < μ s |
renegotiate |
break |
|
μ s ≤Y t <τ s |
renegotiate |
deal |
|
Y t ≥τ s |
deal |
deal |
Table 2. Buyer’s possible actions during price negotiation
|
X t |
Buyer’s Action |
|
|
wcnp ≤wnp |
wcnp >wnp |
|
|
X t > μ B |
renegotiate |
break |
|
μ B ≥X t >τ B |
renegotiate |
deal |
|
X t ≤τ B |
deal |
deal |
If the buyer or the trader chooses to renegotiate, she will set and propose a new price. The new price is set according to Equations (3) and (4).
Yt = ( Yt_ 1, min( Xf _ , A^b )). (3)
Xf = ( M'S ,max(1 , —1)). (4)
Quantity negotiations usually proceed faster than price negotiations. For traders, an agreement in price negotiation is enough and a further agreement in quantity negotiation is additional advantage. A trader will offer more quantity to a buyer when her current willingness to offer more quantity is more or equal to her willingness to offer more quantity. The possible action taken by the trader whether to offer or not offer more quantity is illustrated in Equation (5). On the other hand, the buyer’s response to the trader’s more quantity offer is illustrated in Equation (6). If the trader decides to offer more quantity, whether the buyer accepts or rejects this offer, the number of conversation (nc) will be incremented by 2.
(offer more quantity , ^cqm ≥ Wqm , I stop , else .
f reject , V:qm ≥ ^qm , I stop , else .
-
V. S IMULATION
The proposed model has been validated by implementing it into a traditional market crowd simulation. Even though the simulation can visualize the crowd, the focus is not on the crowd but on the interaction process. The simulation runs in many sessions with some parameters adjustment. The market used in this simulation is Gedongkuning market in Yogyakarta, Indonesia. This market consists of 80 booths, but only 64 of them are in use. Traders are grouped into 11 categories: stove, vegetables, fruits, seasoning, soy based products, kitchen tools, snacks, chicken, beef, fish, and rice. The arrival rate is 5.3 buyers per minute.
Each simulation session is 15 minutes in duration in real life. Several general data are used in this simulation. The number of trader-buyer negotiation sessions ranges from 171 to 204 sessions. The number of negotiated products ranges from 1 to 20 products in one negotiation session.
There are 9 simulation testing groups in this validation process. Every group consists of a single input and a single output. The input is an adjusted parameter. The output is an observed parameter. The observed parameter is then compared to the real condition. The goal is to find the adjustment value or range of the parameters such that the observed parameter is closest to the real condition.
The first group is comparing the trader’s willingness to offer other products ( w po ) as input parameter and the average number of unplanned product offer in one negotiation session as output parameter. The number of unplanned product offer is the number of product offered by a trader to a buyer during the negotiation session, where the product is not in the buyer’s purchasing plan list. The value of wpo for every trader is determined randomly within the input range. There are five simulation sessions for every input range. The result can be seen in Table 3. The first column describes the input range. The second column describes the average value of the output. The third column describes the difference between the simulation output and the real condition value.
Based on field observations, the average value of the number of unplanned product offer in one negotiation session is 0.043. This means that the portion of unplanned product offer is not significant in the negotiation process. Planned products dominate the negotiation session. Based on data in Table 3, when the input range is from 0.0 to 0.1, the simulation result is the closest to the real condition with a difference of 6.16%. This difference is less than 10%. When the input is high, the difference increases drastically.
Table 3. The influence of a trader’s willingness to offer other products on the average number of unplanned product offer in one negotiation session
|
Input Range |
Result |
Difference (%) |
|
0.5 – 1.0 |
0.7254 |
1,568 |
|
0.4 – 0.9 |
0.6222 |
1,331 |
|
0.3 – 0.8 |
0.4956 |
1,039 |
|
0.2 – 0.7 |
0.3846 |
784.6 |
|
0.1 – 0.6 |
0.2922 |
572 |
|
0.0 – 0.5 |
0.1822 |
319.1 |
|
0.0 – 0.4 |
0.1814 |
317.22 |
|
0.0 – 0.3 |
0.1728 |
297.44 |
|
0.0 – 0.2 |
0.0876 |
101.48 |
|
0.0 – 0.1 |
0.0408 |
6.16 |
The second group is comparing the buyer’s resistance to other product offer ( rpo ) as input parameter and average ratio between the number of unplanned product negotiation and the number of unplanned product offer in one negotiation session as output parameter. The value of rpo for every buyer is determined randomly within the input range. There are 5 simulation sessions for every input range. The ratio is expressed in percentage. The result can be seen in Table 4. The first column describes the input range. The second column describes the average value of the output, and the third column describes the difference between the simulation output and the real condition value.
Table 4. The influence of a buyer’s resistance to other product offer on the average ratio between the number of unplanned product negotiation and the number of unplanned product offer in one negotiation session
|
Input Range |
Result (%) |
Difference (%) |
|
0.0 – 0.1 |
96.74 |
3.26 |
|
0.0 – 0.2 |
90.61 |
9.39 |
|
0.0 – 0.3 |
87.10 |
12.90 |
|
0.0 – 0.4 |
72.41 |
27.59 |
|
0.0 – 0.5 |
71.64 |
28.36 |
|
0.1 – 0.6 |
59.67 |
40.33 |
|
0.2 – 0.7 |
51.71 |
48.29 |
|
0.3 – 0.8 |
44.31 |
55.69 |
|
0.4 – 0.9 |
33.91 |
66.09 |
|
0.5 – 1.0 |
22.19 |
77.81 |
Based on field observations, some buyers sometimes approve all unplanned products offers proposed by traders. This means that the buyer’s resistance to the unplanned product offer must be very low. Based on the data in Table 4, when the input range is from 0.0 to 0. 1, the simulation result is the closest to the real condition with the difference of 3.26%. When the input range is from 0.0 to 0.2, the difference is still less than 10%. After that, the difference is going higher.
The third group is comparing the trader’s willingness to offer more quantity ( wpm ) as input parameter and the average ratio between the number of more quantity offer and the number of dealt products in one negotiation session as output parameter. The value of w p m for every trader is determined randomly within the input range. There are five simulation sessions for every input range. The result can be seen in Table 5. The first column describes the input range. The second column describes the average value of the output, and the third column describes the difference between the simulation output and the real condition.
Table 5. The influence of a trader’s willingness to offer more quantity on the average ratio between the number of more quantity offer and the number of dealt products in one negotiation session
|
Input Range |
Result (%) |
Difference (%) |
|
0.0 – 0.1 |
4.05 |
58.6 |
|
0.0 – 0.2 |
9.86 |
10.4 |
|
0.0 – 0.3 |
13.79 |
40.9 |
|
0.0 – 0.4 |
20.31 |
107.6 |
|
0.0 – 0.5 |
24.54 |
150.9 |
|
0.1 – 0.6 |
36.67 |
274.9 |
|
0.2 – 0.7 |
44.92 |
359.2 |
|
0.3 – 0.8 |
50.49 |
416.1 |
|
0.4 – 0.9 |
63.99 |
554.2 |
|
0.5 – 1.0 |
75.84 |
675.3 |
Based on field observations, the average ratio between the number of more quantity offer and the number of the agreed products is 9.8%. Based on data in Table 5, when the input range is from 0.0 and 0.2, the simulation result is the closest to the real condition with the difference of 10.4%. This difference is more than 10%. Before that range, the result is too low, and too high afterwards.
The fourth group is comparing the base target point with the average ratio between the number of agreed products and the number of negotiated products in one negotiation session as output parameter. The base target point is symbolized with variable b in this simulation. Base target point is used to determine the target point and reservation price. The determination of the buyer’s target point and reservation price is described in Equations (7) and (8). Equations (9) and (10) describe the determination of the trader’s target point and reservation price. There are five simulation sessions for every base target point. The result can be seen in Table 6. The first column describes the input value. The second column describes the average value of the output, and the third column describes the difference between the simulation output and the real condition value.
тв = b - random. (0,1).(7)
цв = ts + (2 xran do m(0,1)).(8)
rs = -b + r an do m(0,1).(9)
ц5 = ts - (2 x ran do m(0,1)).(10)
Based on field observations, the average ratio between the number of the agreed products and the number of negotiated products in one negotiation session is 92%. Based on data in Table 6, when the base point value is 0.6, the simulation result is the closest to the real condition. When the base point value is from 0.5 to 0.7, the difference is still under 10%. When the base point value is lower than 0.5, the difference is higher than 10%.
placed between input range of 0.4 to 0.9 and of 0.5 to 1.0; however, input range of 0.5 to 1.0 produces the closest difference between the simulation result and the real condition. This difference is 14.5%.
The sixth group is comparing the trader’s willingness to negotiate the price ( wnp ) with the average ratio between the number of trader’s price renegotiation action and the number of negotiated products in one negotiation session as output parameter. The value of wnp for every trader is determined randomly within the input range. There are five simulation sessions for every input range. The result can be seen in Table 8. The first column describes the input range. The second column describes the average value of the output, and the third column describes the difference between the simulation output and the real condition value.
Table 6. The influence of base point on the average ratio between the number of dealt products and the number of negotiated products in one negotiation session
|
Base Point |
Result (%) |
Difference(%) |
|
0.0 |
49.7 |
46.0 |
|
0.1 |
60.4 |
34.4 |
|
0.2 |
68.3 |
25.7 |
|
0.3 |
76.2 |
17.2 |
|
0.4 |
82.3 |
10.6 |
|
0.5 |
87.5 |
4.9 |
|
0.6 |
93.3 |
1.3 |
|
0.7 |
96.9 |
5.3 |
The fifth group is comparing the buyer’s willingness to negotiate the price ( w np ) as the input parameter with the average ratio between the number of buyer’s price renegotiation action and the number of the negotiated products in one negotiation session as the output parameter. The value of wnp for every buyer is determined randomly within the input range. There are five simulation sessions for every input range. The result can be seen in Table 7. The first column describes the input range. The second column describes the average value of the output, and the third column describes the difference between the simulation output and the real condition value.
Table 7. The influence of the buyer’s willingness to negotiate price on the average ratio between the number of buyer’s price negotiation action and the number of negotiated products in one negotiation session
|
Input Range |
Result (%) |
Difference(%) |
|
0.0 – 0.5 |
2.6 |
74.8 |
|
0.1 – 0.6 |
4.1 |
59.3 |
|
0.2 – 0.7 |
5.7 |
44.2 |
|
0.3 – 0.8 |
6.3 |
38.3 |
|
0.4 – 0.9 |
9.6 |
18.9 |
|
0.5 – 1.0 |
11.2 |
14.5 |
Based on field observations, the average ratio between the number of price negotiation actions by the buyer and the number of negotiated products in one negotiation session is 10. 1%. Based on data in Table 7, this value is
Table 8. The influence of a trader’s willingness to negotiate price on the average ratio between the number of trader’s price negotiation action and the number of negotiated products in one negotiation session
|
Input Range |
Result (%) |
Difference(%) |
|
0.0 – 0.5 |
1.7 |
1.7 |
|
0.1 – 0.6 |
1.7 |
1.7 |
|
0.2 – 0.7 |
2.0 |
2.0 |
|
0.3 – 0.8 |
3.6 |
3.6 |
|
0.4 – 0.9 |
4.1 |
4.1 |
|
0.5 – 1.0 |
5.6 |
5.6 |
Based on field observations, there is no price negotiation actions by the trader. The trader chooses two actions only: approve or reject. Based on data in Table 8, all input ranges produce simulation result with the difference under 10%. Because the field observation value is 0, the input range of 0.0 to 0.5 produces the least difference gap.
The seventh group is comparing the number of planned products in buyer’s shopping list as the input parameter with the number of negotiated planned products in one negotiation session as the output parameter. The number of planned products for every buyer in every visitation is determined randomly within the input range. There are five simulation sessions for every input range. The result can be seen in Table 9. The first column describes the input range. The second column describes the average value of the output, and the third column describes the difference between the simulation output and the real condition value.
Table 9. The influence of the number of planned products with the negotiated planned products in one negotiation session
|
Input Range |
Result (%) |
Difference (%) |
|
1 – 2 |
1.3 |
20.6 |
|
1 – 3 |
1.7 |
1.4 |
|
1 - 4 |
2.1 |
25.9 |
Based on field observations, the average value of the number of the planned products talked about in one negotiation session is 1.6 products. Based on data in
Table 9, when the input range is 1 to 3, the difference between simulation result is closest. When the input range is of 1 to 2, the simulation result is too low, and too high when the input range is of 1 to 4.
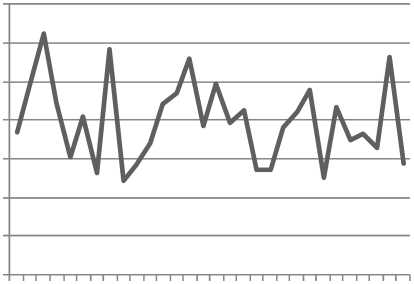
The eighth group is testing the number of conversations in one negotiation session. The simulation is run 30 times. The base point value is set as 0.6. The trader’s willingness to offer unplanned product is set between 0.0 and 0.2. The trader’s willingness to offer quantity is set between 0.0 and 0.1. The buyer’s willingness to negotiate the price is set between 0.0 and 0.5. The buyer’s resistance for unplanned products is set between 0.0 and 0. 1. The buyer’s willingness to negotiate the price is set between 0.5 and 0.1. The number of planned products is set between 1 and 3. The result can be seen in Fig. 2. In Fig. 2, x axis represents simulation session number and y axis represents the average number of conversations in one negotiation session ( n c ) in one simulation session.
average nc
4.8
4.6
4.4
4.2
3.8
3.6
3.4
1 3 5 7 9 11 13 15 17 19 21 23 25 27 29
Fig.2. Average number of conversations in one negotiation session
Based on field observations, the average number of conversations in one negotiation session is 5.3. Based on the simulation result, the average number of conversations is 4.19. Hence, the accuracy level is 79.1%. It can be said that the simulation result is close to the real condition. The lowest value is 3.89, while the highest is 4.65.
The ninth group is testing the interaction duration in one negotiation session. The simulation is run 30 times. Parameters in the sixth group are used. It is assumed that the processing time is 43.2 seconds. The input range is from t cmin and t cmax . The result can be seen in Table 10. The first column describes the input range. The second column describes the average value of the output, and the third column describes the difference between the simulation output and the real condition value.
Based on field observations, the average interaction duration in one negotiation session is 117.1 seconds. Based on data in Table 10, when the tcmin is between 9 and 14 seconds, the accuracy level is above 90%. When tcmi„ is between 10 and 12 seconds, the accuracy level is higher than 95%. This means that the simulation result is close to the real condition.
Table 10. Interaction duration
|
Input Range |
Result (sec.) |
Accuracy (%) |
|
3 - 4 |
82.1 |
69.8 |
|
4 – 5 |
91.0 |
77.3 |
|
5 – 6 |
91.9 |
78.1 |
|
6 – 7 |
92.5 |
78.5 |
|
7 – 8 |
98.2 |
83.4 |
|
8 – 9 |
105.8 |
89.8 |
|
9 – 10 |
107.0 |
90.9 |
|
10 – 11 |
115.9 |
98.5 |
|
11 – 12 |
112.7 |
95.7 |
|
12 – 13 |
119.5 |
98.5 |
|
13 – 14 |
128.9 |
90.5 |
|
14 - 15 |
129.2 |
90.3 |
|
15 – 16 |
132.4 |
87.6 |
|
16 - 17 |
131.6 |
88.2 |
VI. C ONCLUSION
In this paper, we propose a buyer-trader interaction model that can be implemented into crowd simulation in daily good traditional markets. The model accommodates customer’s impulsive and compulsive behavior. The model also accommodates customer’s loyalty, on one side, and trader’s display quality and promotion willingness, on the other side. In this model, bargaining is not hard. Based on the comparison between data produced in the simulation and data obtained from field observations, by adjusting some parameters, the model matches with the real condition.
References Agent-Based Buyer-Trader Interaction Model of Traditional Markets
- M.J. Osborne and A. Rubinstein, “Bargaining and Market”, San Diego Academic Press, 1990.
- A. Rubinstein, “Perfect Equilibrium in a Bargaining Model”, Econometrica vol. 50, no. 1, 1982, pp. 97-110.
- R.M. Coehoorn and N.R. Jennings, “Learning on Opponent’s Preferences to Make Effective Multi Issue Negotiation Trade Offs”, Proceedings of the 6th International Conference on Electronic Commerce, ACM (Delft), 2004, pp. 59-68.
- S. Balakrishnan and J. Eliashberg, “An Analytical Process Model of Two-Party Negotiations”, Management Science, vol. 41, no. 2, 1995, pp. 226-243.
- T. Alfredson and A. Cungu, “Negotiation Theory and Practice”, EasyPol, 2008.
- G.N. Herman, J.M. Cary, and J.E. Kennedy, “Legal Counseling and Negotiating: A Practical Approach”, Matthew Bender and Company, 2001.
- R. Fisher, W. Ury, and B. Patton, “Getting to Yes: Negotiating an Agreement without Giving in”, Random House Business Books, 1991.
- W.L. Adair and J.M. Brett, “The Negotiation Dance: Time, Culture, and Behavioral Sequences in Negotiation”, Organization Science, vol. 16, no. 1, 2005, pp.33-51.
- Y. Shoham and K. Leyton-Brown, “Multi-agent Systems: Algorithmic, Game-Theoretic, and Logical Foundations”, Cambridge University Press, 2005.
- A.E. Roth and J.K. Murnighan, “The Role of Information in Bargaining: An Experimental Study”, Econometrica, vol. 50, no. 5, 1982, pp.1123-1142.
- M. Wooldridge, “An Introduction to Multi Agent System”, John Wiley and Sons, 2002.
- G. Weiss, L. Braubach, and P. Giorgini, “Intelligent Agent”, Handbook of Technology Management, Wiley, 2010.
- Y. Chevaleyre, U. Endriss, and N. Maudet, “On Maximal Classes of Utility Functions for Efficient One-to-One Negotiation”, The 19th International Joint Negotiating Socially Optimal Allocations of Resources Conference on Artificial Intelligence, 2005, pp.941-946.
- F. Shaheen, M. Wooldridge, and N.R. Jennings, “Optimal Negotiation of Multiple Issues in Incomplete Information Settings”, The 3rd International Joint Conference on Autonomous Agent and Multi Agent Systems, 2004, pp. 1080-1087.
- C. Ponsati and J. Watson, “Multiple-Issue Bargaining and Axiomatic Solutions”, International Journal of Game Theory, vol. 26, no. 4, 1997, pp.501-524.
- A. Rangaswamy and G.R. Shell, “Using Computer to Realize Joint Gains in Negotiations: Toward and Electronic Bargaining Table”, Management Science, vol. 43, no. 8, 1997, pp. 1147-1163.
- M. Bac and H. Raff, “Issue-by-Issue Negotiations: The Role of Information and Time Preference”, Games and Economic Behavior, vol. 13, no. 1, 1996, pp. 125-134.
- M.K. Chen, “Agendas in Multi-Issue Bargaining: When to Sweat the Small Stuff”, Harvard Department of Economics, Cambridge, Nov 2002, technical report.
- Y. In, and R. Serrano, “Agenda Restrictions in Multi Issue Bargaining”, Journal of Economic Behavior and Organization, vol. 53, no. 3, 2004, pp. 325-331.
- K.G. Binmore, “Bargaining and Coalitions”, Disagreement in Bargaining: Model with Incomplete Information, Cambridge University Press, 1985, pp.269-304.
- S. Hart, “Axiomatic Approaches to Coalitional Bargaining”, Disagreement in Bargaining: Model with Incomplete Information, Cambridge University Press, 1985, pp.305-319.
- R.B. Myerson, “Analysis of Two Bargaining Problems with Incomplete Information”, Disagreement in Bargaining: Model with Incomplete Information, Cambridge University Press, 1985, pp.115-147.
- J.Y. Kim, “Cheap Talk and Reputation in Repeated Pre-trial Negotiation”, Journal of Economics, vol.27, no. 4, 1996, pp.787-802.
- T. Nagle and R. Holden, “The Strategy and Tactics of Pricing: A Guide to Profitable Decision Making”, Prentice Hall, 2002.
- G.B. Sproles and E.L. Kendall, “A Methodology for Profiling Consumers’ Decision Making Styles”, The Journal of Consumer Affairs, vol.20, 1986, pp.267-279.
- W. Applebaum, “Studying Customer Behavior in Retail Stores”, Journal of Marketing, vol. 16, no. 2, 1951, pp.172-178.
- S. Wesley, M. LeHew, and A.G. Woodside, “Consumer Decision-Making Styles and Mall Shopping Behavior: Building Theory Using Exploratory Data Analysis and The Comparative Method”, Journal of Business Research, vol.59, no. 5, 2006, pp.535-548.
- D.W. Rook, “The Buying Impulse”, The Journal of Consumer Research, vol.14, no. 2, 1987, pp.189-199.
- A. Kruzka, “Why did I Just Buy That? A Look at Impulse Buying in The Atmosphere of Daily Deal”, American University, 2012.
- D.T. Kollat and R.P. Willett, “Customer Impulse Purchasing Behavior”, Journal of Marketing Research, vol.4, no. 1, 1967, pp.21-31.
