Agriculture on the European north: All-Russian agricultural census results

Author: Ivanov Valentin Aleksandrovich, Ivanova Elena Valentinovna
Journal: Economic and Social Changes: Facts, Trends, Forecast @volnc-esc-en
Section: Branch economy
Article in issue: 3 (11) т.3, 2010.
Free access
On the basis of All-Russian agricultural census results of 2006 the analysis of the objects, resource potential and agriculture pattern of the European North of Russia is given in the article. The census results allow us to draw up a number of concrete guidelines on the development of government's agricultural policy.
Agriculture, all-russian agricultural census, european north, economic management, resource potential, infrastructure
Short address: https://sciup.org/147223210
IDR: 147223210 | UDC: 631:311(470.1)
Text of the scientific article Agriculture on the European north: All-Russian agricultural census results
Elena V.
IVANOVA
Assistant of laboratory of Institute of SEEP of the North
Komi SC of the Ural RAS department
In 2006 in July as consistent with the Federal Law dated July, 27, 2005 “On All-Russian agricultural census” and the Decree by the RF government dated October, 31, 2005 “On organizing All-Russian agricultural census” All-Russian agricultural census (ARAC) was taken; on the distant and hard-to-reach territories it was hold from the 15th of September till the 15th of November in 2006. The previous agricultural census was hold in 1920.
The results of census allowed us to receive the data on the following: the objects of cen- sus, agricultural employment, dimensions and structure of areas, cattle and poultry head, machinery and equipment availability, presence of production buildings and condition of agriculture infrastructure [1, 2].
Business entities
According to the results of census as a whole in the European North of Russia as of July, 2006 there were 700 agricultural enterprises including 310 large-scale and medium-scale ones, 1,920 peasant (farmer) households, 337 individual entrepreneurs, 2.2 thousand nonprofit
Table 1. Structure of agricultural organizations regarding business entities as of July, 1, 2006, %
Thus a combination of large, medium and small enterprises and households is typical of the agricultural sector of the area. At present the collective, personal subsidiary and peasant-and-farmer structures are functioning here. Different entities have been formed: agricultural production co-operatives, economic associations and companies, state-run unitary enterprises, individual and farmer households.
The structure of agricultural organizations regarding business entities on the whole in Russia, in the European North, in republics and regions is shown in table 1 . As follows from the data given in the table, in the European North among large and medium agricultural enterprises the percentage of economic associations and companies made up 31%, the percentage of agricultural production co-operatives made up 25.8%, the percentage of state-run and municipal unitary enterprises made up 18.7%. On the whole in Russia their percentage was 35.2; 37.9 and 9.5% respectively. The portion of state-run and municipal unitary enterprises in the area under consideration especially in the Karelia Republic and the Komi Republic is higher than in Russia.
All-Russian agricultural census found that in 2006 the agricultural production in the European North wasn’t carried out by 32.3% of large and medium enterprises, 53.1% of small enterprises, 66.7% of farmer households, 16.7% of personal subsidiary households and other individual households of citizens. On the whole in Russia these indicators were 29.4; 37; 51.1 and 24.1% respectively. It indicates that the modern government agrarian policy doesn’t promote the agrarian entrepreneurship development.
Judging by the census results, in 2005 in the European North 73.3% of agricultural enterprises, 68.1% of peasant (farmer) households and individual entrepreneurs were engaged in growing the cereals, potatoes and other agricultural crops; respectively 70.3 and 41% were engaged in cattle breeding, 10.7 and 41% were engaged in ship, goat and horse breeding, 10.1 and 3.2% were engaged in reindeer and other livestock breeding.
Resource potential
Manpower resources. From the census figures, as of July, 1, 2006 out of the total number of workers engaged in economy of the European North 76% were the workers of large and medium agricultural enterprises, 7% were the workers of small enterprises, 12% were the workers of farmer households and 2% were the workers’ percentage of individual entrepreneurs. The major part of manpower resources in the Murmansk region (96%) and Nenets Autonomous District (93%) was engaged in large and medium enterprises. In the Arkhangelsk region 16% of the employed workers are the share of farmer households (tab. 2) .
Table 2. Labour force in the context of enterprises and households of the European North as of July, 1, 2006, thousand persons
|
Area |
Large and medium agricultural enterprises |
Small agricultural enterprises |
Farmer households |
Among them the permanent employee |
Individual entrepreneurs |
|
European North |
25.7 |
2.6 |
3.9 |
0.9 |
0.6 |
|
Arkhangelsk region |
9.5 |
1.4 |
2.3 |
0.7 |
0.3 |
|
Including Nenets Autonomous District |
2.2 |
0.09 |
0.02 |
- |
0.07 |
|
Murmansk region |
3.8 |
0.02 |
0.08 |
0.02 |
0.02 |
|
Karelia Republic |
4.8 |
0.1 |
0.8 |
0.07 |
0.08 |
|
Komi Republic |
7.6 |
1.0 |
0.8 |
0.2 |
0.2 |
The average annual labour force of large and medium agricultural enterprises engaged in fishery in the area composed 12%, those engaged in hunting – 0.2% and those engaged in produce processing of traditional and other trades – 24.3%. All workers of small agricultural enterprises were engaged in produce processing of traditional and other trades (tab. 3) .
Land resources. The total land area of the European North composes 36 mill. ha including 25.4 mill. ha of reindeer pastures. Nearly three fourth of reindeer pasture area are situated in Nenets Autonomous District (39.9%) and the Komi Republic (33.1%). Only small part of land is used for farming – 2.2%, and only 0.9% of land area is the share of arable land. The highest percentage of cultivated areas for the growing of agricultural crops is typical of the Karelia Republic (73.8%) and the Arkhangelsk region (19.8%), the lowest percentage – Nenets Autonomous District (0.1%) and the Murmansk region (0.3%). The low area development is explained by the adverse natural conditions to agriculture, immense areas wood-covered and small population density.
Natural hayfields and pastures dominate the agricultural land. So, the share of meadows per a hectare of arable land was 1.3 ha in the
Table 3. Occupation with traditional kinds of activity in the agricultural enterprises of the European North in 2005, %
|
Area |
Large and medium enterprises |
Small enterprises |
||||
|
Fishery |
Hunting |
Produce processing |
Fishery |
Hunting |
Produce processing |
|
|
European North |
12.0 |
0.2 |
24.3 |
- |
- |
100.0 |
|
Arkhangelsk region |
8.5 |
0.2 |
24.4 |
- |
- |
- |
|
Including Nenets Autonomous District |
0.9 |
- |
28.7 |
- |
- |
- |
|
Murmansk region |
22.9 |
- |
3.9 |
- |
- |
100.0 |
Table 4. Supply of land in the European North as of July, 1, 2006, thous. ha
|
Size and structure of land resources |
European North |
Arkhangelsk region |
Including Nenets Autonomous District |
Murmansk region |
Karelia Republic |
Komi Republic |
|
Total land area |
36037.7 |
20430.3 |
18144.9 |
6665.2 |
131.4 |
8810.8 |
|
Including the area of deer pastures |
25404.9 |
10434.9 |
10142.5 |
6570.4 |
- |
8399.6 |
|
Of the total agricultural land area: |
803.0 |
457.7 |
23.0 |
17.5 |
97.0 |
212.8 |
|
arable land |
317.6 |
188.8 |
0.2 |
12.4 |
51.2 |
65.3 |
|
hayfields |
318.0 |
182.8 |
17.6 |
1.1 |
25.7 |
108.4 |
|
pastures |
108.8 |
71.7 |
5.0 |
0.1 |
11.8 |
25.2 |
|
Share in land area, %: deer pastures |
70.7 |
51.1 |
55.9 |
98.6 |
- |
95.3 |
|
agricultural lands |
2.2 |
2.2 |
0.1 |
0.3 |
73.8 |
2.4 |
|
Arable land |
0.9 |
0.9 |
0.0 |
0.03 |
39.0 |
0.7 |
European North, 113 ha in Nenets Autonomous District, 2 ha in the Komi Republic. The areas and structure of land are shown in table 4 .
As is obvious from the census results, 32% of agricultural land weren’t used in the European North, and 25% – on the whole in Russia. In the Murmansk region this indicator accounted for 44%, in the Arkhangelsk region – 39% and in the Karelia Republic – 15%.
The analysis of agricultural area distribution among the European North enterprises and households which occupied with farming indicated that the percentage of agricultural enterprises made up 70.6%, that of peasant (farmer) households and individual entrepreneurs – 10.6% and that of personal subsidiary households of citizens was 14.3% of lands.
The average size of total area of land, reindeer pastures, agricultural lands and sown area per one enterprise (household) is shown in table 5 . As the given data indicate, agricultural enterprises had 550 ha of agricultural land on the average, peasant (farmer) households and individual entrepreneurs – 26 ha, personal subsidiary households of population – 19 hundred m2 of agricultural land and 7 hundred m2 of sown area.
The major part of sown area was in the possession of agricultural enterprises, including 64% – in the possession of large and medium enterprises; the share of population households was 13% of the total sown area, that of peasant (farmer) households – 8%.
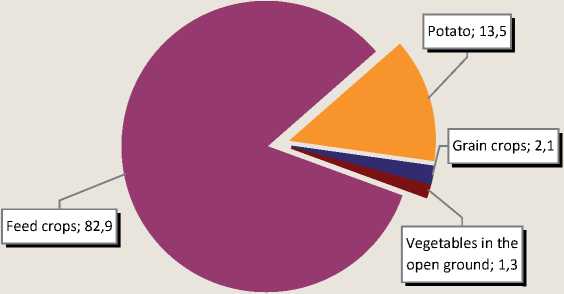
Feed crops (82.9%) dominated the total sown area in the households of all categories, the share of grain crops and leguminous plants was 2.1%, that of potato – 13.5%, that of vegetables in the open ground – 1.3%, that of industrial crops – 0.2% (fig. 1) .
The main areas of grain crops and leguminous plants were concentrated in Arkhangelsk region (71%), those of potato – in Arkhangelsk region (46%), the Komi Republic (29%) and the Karelia Republic (22%). The areas under grain crops (93%) and feed crops (90%) were located in the agricultural enterprises, those under potato (84%) and vegetables (81%) – in the households of population.
The taking of census allowed us to get information about the action area under the protected ground in the agricultural enterprises, peasant (farmer) households and individual entrepreneurs (tab. 6) .
Table 5. Total area of land, area under reindeer pastures and agricultural lands in the European North per one enterprise (household) occupied with farming as of July,1, 2006
|
Enterprises and households |
Total land area |
Deer pastures |
Agricultural lands |
Sown area |
|
Agricultural enterprises, thousand ha |
48.3 |
35.6 |
0.55 |
0.006 |
|
Peasant (farmer) households and individual entrepreneurs, ha |
295 |
208 |
26 |
8.6 |
|
Private subsidiary households, ha |
0.20 |
- |
0.19 |
0.07 |
Table 6. Total action area of winter and spring greenhouses and hotbeds at the agricultural enterprises, peasant (farmer) households and individual entrepreneurs, 2006, thous. m2
|
Agricultural enterprises |
Including |
Peasant (farmer) households and individual entrepreneurs |
Including peasant (farmer) households |
|
|
Large and medium |
Subsidiary households of non-agricultural enterprises |
|||
|
European North |
||||
|
411.2 |
373.2 |
20.1 |
6.9 |
4.6 |
|
Arkhangelsk region |
||||
|
129.8 |
123.3 |
6.6 |
2.0 |
2.0 |
|
Including Nenets Autonomous District |
||||
|
15.8 |
15.8 |
- |
- |
- |
|
Murmansk region |
||||
|
60.2 |
55.8 |
4.4 |
1.4 |
0.5 |
|
Karelia Republic |
||||
|
19.6 |
17.7 |
1.9 |
1.7 |
1.7 |
|
Komi Republic |
||||
|
201.6 |
176.4 |
7.2 |
1.8 |
0.4 |
Figure 1. Structure of sown area under the agricultural crops for the yield of 2006 in the households of all categories in the European North (by % out of total sown area)
As is evident from the data cited above, the share of agricultural enterprises was 90.8% of the total action area of greenhouses and hotbeds, that of subsidiary households – 4.9% and that of peasant (farmer) households – 1.1%. The main areas of protected ground at the agricultural enterprises were concentrated in the Komi Republic (49%) and Arkhangelsk region (32%); 43% of action area of greenhouses and hotbeds at the peasant (farmer) households were located in Arkhangelsk region, 37% – in Karelia.
The agricultural enterprises allotted 88% of the action area of greenhouses and hotbeds for vegetables, the peasant (farmer) households – 63%. At these households the shares of cucum- ber crops were respectively 72 and 55% of the total area under vegetables crops.
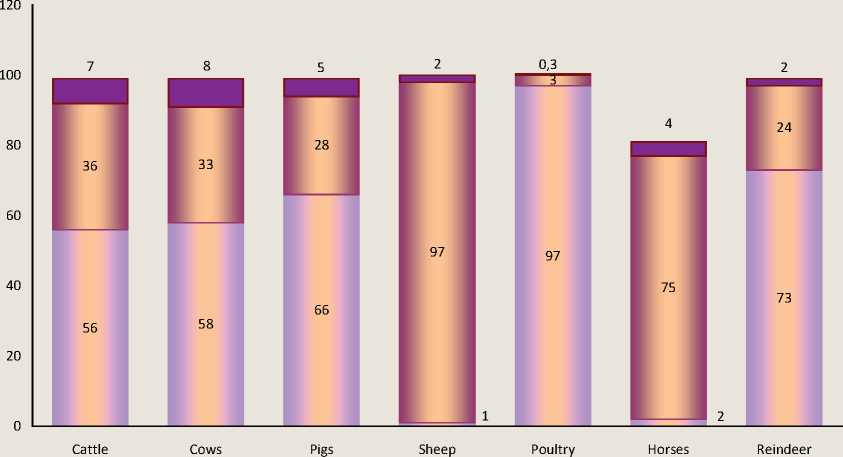
Livestock capita. The analysis of livestock being kept on the households of different agricultural producers showed that the livestock of cattle, pigs, sheep, poultry and deer was centered in general in the households of population and agricultural enterprises (tab. 7) .
The share of agricultural enterprises out of the total number of livestock was the following: cattle – 56%, including cows – 58%, pigs – 66%, poultry – 97%, deer – 73%, foxes and blue foxes – 100% and minks – 84%. In 2006 the pork, egg and poultry production was centered in the large enterprises where the poultry
Table 7. Livestock capita in the European North as of July,1, 2006, thous. heads
|
Kinds of livestock |
Households of all categories |
Including |
||||
|
agricultural enterprises |
among them large and medium |
farmer households and individual entrepreneurs |
among them farmer households |
population’s households |
||
|
Cattle |
179.3 |
100.8 |
88.8 |
14.4 |
13.2 |
64.1 |
|
Including cows |
77.5 |
45.2 |
39.8 |
6.5 |
5.9 |
25.9 |
|
Pigs |
104.7 |
69.4 |
57.9 |
6.2 |
4.8 |
29.1 |
|
Sheep and goats |
76.7 |
0.7 |
0.2 |
1.1 |
0.8 |
74.8 |
|
Among them sheep |
40.8 |
0.5 |
0.1 |
0.9 |
0.7 |
39.4 |
|
Poultry |
4237.2 |
4097.7 |
3958.7 |
14.7 |
13.9 |
124.8 |
|
Horses |
10.9 |
2.1 |
1.6 |
0.5 |
0.4 |
8.2 |
|
Reindeer |
382.2 |
278.3 |
271.7 |
11.8 |
5.9 |
92.2 |
|
Rabbits |
99.3 |
5.4 |
- |
0.8 |
- |
93.1 |
|
Foxes |
5.3 |
5.3 |
- |
- |
- |
- |
|
Blue foxes |
11.0 |
11.0 |
- |
- |
- |
- |
|
Minks |
93.9 |
78.9 |
- |
- |
- |
- |
Figure 2. Structure of livestock capita in the European North, %
□ Agricultural enterprises □ Farmer households □ Population households
factories worked. These enterprises equaled with the industrial enterprises in the level of production organization, the technological level and the use of advanced manufacturing sciences. The households of population dominated in keeping of sheep and goats (97% of the total number), rabbits (94%) and horses (75%). In the peasant (farmer) households there are only 7% of the total head of cattle including cows – 8%, pigs – 5%, horses – 4%, sheep and deer – 2% each (fig. 2) .
In the issue of census we received the information about the concentration of livestock capita. 23% of agricultural enterprises having 1,110 heads on average concentrated 68% of cattle head; 27% of enterprises keeping 22,000 heads of deer on average had 71% of livestock.
As for the peasant (farmer) households and the individual entrepreneurs, 62% of cattle head were kept at 10% of such households, having 237 heads each on average; 17% of that – at 9% of the households having 74 heads each on average; 71% of households had on average from 2 to 14 heads of cattle per one household.
Only 10% of personal subsidiary households were engaged in cattle breeding, on average one household had 2 heads. 30% of households had 1 head each, 49% – 2 heads, 17% – 3 heads, 8% – 4 heads each. 2% of households kept on average 7 heads per one household, only 0.2% of households – 15 heads of cattle. Such households approximate to farmer households in their nature of activity.
Sheep breeding takes an important place in the economic complex of the North. This field conforms with the nature of the district and the work skills of native population most of all, it is notable for high efficiency as well. Owing to the lack of expenses for laying-in of fodder and housing construction the venison production is high-yielding: in the households the first cost of venison per a quintal is more than two times as low as that of the beef production.
As of July, 1, 2006 the total head of deer was 382.2 thousand heads in all categories of households in the European North. The share of the district was 23% of the total head of deer in Russia (tab. 8) .
Table 8. Total head of deer regarding the categories of agricultural producers in the North areas as of July, 1, 2006, thous. heads
|
Area |
Households of all categories |
Including |
||||
|
Agricultural enterprises |
among them large and medium |
farmer households and individual entrepreneurs |
among them farmer households |
population households |
||
|
Areas of the Extreme North and the localities equated to this status |
1664.3 |
920.7 |
844.6 |
22.2 |
16.0 |
721.4 |
|
European North |
382.2 |
278.3 |
271.7 |
11.8 |
5.9 |
92.2 |
|
Arkhangelsk region |
212.2 |
148.3 |
143.0 |
8.8 |
2.9 |
55.1 |
|
Including Nenets Autonomous District |
209.9 |
146.6 |
141.7 |
8.8 |
2.9 |
54.5 |
|
Murmansk region |
67.0 |
59.4 |
58.1 |
0.6 |
0.6 |
7.0 |
|
Komi Republic |
103.0 |
70.6 |
70.6 |
2.4 |
2.4 |
30.0 |
Among the northern subjects the 2nd place is taken by Nenets Autonomous District (12.8%), the 5th place – the Komi Republic (6.2%). The largest herd of deer is concentrated in Yamal-Nenets Autonomous District (44% of the total head of deer in the North area).
The census returns indicated that the reindeer head is 24% as little as the level of 1991 (2,258 thousand heads). For that period of time the reindeer head has been reduced by 2% in the European North and by 32% in the Asian part. The total head of animals has been reduced most of all in the Far Eastern federal district – from 1,2136th to 446th heads. It has been reduced by 49% in the Sakha Republic (Yakutia), by 62% in the Chukchi Autonomous District, by 85% in Magadan region and by 77% in the Koryak Autonomous District. The increase in deer head has been taken place only in Yamal-Nenets Autonomous District – from 490.5 th heads in 1991 to 732.2 th heads in 2006.
Techniques, production premises and infrastructure. All-Russian agricultural census permitted to get the information about present farming techniques, machinery, equipments and production premises, and also about the provision of the different agricultural producers with the subjects of infrastructure. There were 12.2 tractors and 7.1 cars per one large and medium agricultural enterprise on average, respectively 3.4 and 1.1 per one small enterprise. The agricultural enterprises are poorly equipped with machinery for applying the organic and mineral fertilizers and lime, and also with equipment for mechanized feeding, milking, disposal and milk-cooling. The farmer households and the individual entrepreneurs lack for farming techniques, machinery and equipment heavily.
In 2006 there were 1.8 tractors, 2 dualpurpose vehicles, 0.7 horse mower, 18.7 cars and 6.3 motorcycles per 100 households of population ( tab. 9 ).
There were 1.3 all-terrain vehicle, 0,8 self-propelled barge and launch, 1.4 outboard motorboat, 2.2 hook-on boat motors, 3.1 motor sledges, 3.7 compact and mobile electrical power stations and 5.8 radio stations per one agricultural enterprise keeping reindeer breeding and herd horse breeding. The farmer households and the individual entrepreneurs are equipped with techniques much more poorly.
The available machinery of enterprises and households is rather old. At the large and medium agricultural enterprises the percentage of tractors at the age under 3 years is only 5%, the percentage of tractors aged of 9 years and more is 85%. At the small enterprises these indicators were respectively 5 and 90%. At the farmer households and the individual entrepreneurs the indicators of age machinery structure are not any better: the percentage of tractors at the age under 3 years is 4%, the percentage of tractors aged of 9 years and more is 87%.
As the census results show, the provision of the agricultural enterprises, farmer households and individual entrepreneurs with the subjects of infrastructure remains low (tab. 10) .
Table 9. Present techniques on average per 1 agricultural enterprise (household) in the European North as of July, 1, 2006, units
|
Machine name |
Large and medium enterprises |
Small enterprises |
Farmer households and individual entrepreneurs |
Population households * |
|
Tractors |
12.2 |
3.4 |
0.6 |
1.8 |
|
Trucks and dual-purpose vehicles |
7.1 |
1.1 |
0.2 |
2.0** |
|
Tractor plough |
1.6 |
0.7 |
0.2 |
0.7*** |
|
Tractor mowers |
3.0 |
0.9 |
0.2 |
0.3**** |
|
Sowers |
1.0 |
0.2 |
0.05 |
- |
|
Potato planters |
0.4 |
0.2 |
0.06 |
- |
|
Organic fertilizer spreaders |
0.9 |
0.3 |
0.06 |
- |
|
Machinery for applying the organic and mineral fertilizers and lime |
0.6 |
0.08 |
0.03 |
- |
|
Balers |
1.4 |
0.5 |
0.1 |
- |
|
Farm loaders |
0.7 |
0.1 |
0.03 |
- |
|
Potato diggers |
0.5 |
0.2 |
0.09 |
- |
|
Feed distributors for cattle |
0.7 |
0.09 |
0.01 |
- |
|
Milking units |
1.2 |
0.4 |
0.06 |
0.04 |
|
Milk treaters and coolers |
0.8 |
0.1 |
0.02 |
- |
|
Motor units, motor cultivators |
- |
- |
- |
2.8 |
|
Cars |
- |
- |
- |
18.7 |
|
Motocycles |
- |
- |
- |
6.3 |
|
* Per 100 households. ** Dual-purpose vehicles. *** Horse mowers. **** Tractor and horse ploughs. |
Table 10. Provision of the North area agricultural enterprises and households with the subjects of infrastructure as of July, 1, 2006, by % out of the total number of economic entities farming
|
Area of the Extreme North and the localities equated to this status |
European North |
Arkhangelsk region |
Including Nenets Autonomous District |
Murmansk region |
Karelia Republic |
Komi Republic |
|
|
Hard-surface road communication with main municipal district town or with mainline communications network |
|||||||
|
1 2 |
65.5 73.3 |
78.1 85.8 |
69.0 82.1 |
27.3 - |
70.4 72.7 |
92.3 90.9 |
86.0 86.4 |
|
Local hard-surface roads |
|||||||
|
1 2 |
28.1 - |
52.4 - |
43.7 - |
4.5 - |
55.6 - |
59.0 - |
59.6 - |
|
Power network connection |
|||||||
|
1 2 |
83.3 85.3 |
90.0 77.3 |
85.1 77.7 |
63.6 6.7 |
77.8 48.5 |
97.4 78.5 |
98.2 80.1 |
|
Heat supply network connection |
|||||||
|
1 2 |
31.2 4.2 |
40.5 3.1 |
31.0 2.6 |
31.8 - |
33.3 12.1 |
43.6 1.5 |
56.1 4.4 |
|
Access to water-supply network |
|||||||
|
1 2 |
35.7 8.3 |
55.2 18.7 |
39.1 18.7 |
27.3 - |
70.4 27.3 |
69.2 14.7 |
63.2 22.3 |
|
Gas network connection |
|||||||
|
1 2 |
5.1 6.6 |
5.2 0.9 |
3.4 - |
9.1 |
3.7 - |
- 1.1 |
12.3 1.9 |
|
Treatment facilities on the stock-farms |
|||||||
|
1 2 |
6.8 2.0 |
17.1 6.8 |
11.5 8.1 |
9.1 3.3 |
29.6 6.1 |
10.3 3.8 |
24.6 9.2 |
|
Internet |
|||||||
|
1 2 |
15.5 - |
28.1 - |
29.9 - |
27.3 - |
33.3 - |
25.6 - |
24.6 - |
|
Water-supply system and production drains treatment |
|||||||
|
1 2 |
8.8 - |
21.0 - |
12.6 - |
13.6 - |
37.0 - |
23.1 - |
24.6 - |
|
Notes: 1 – large and medium enterprises; 2 – farmer households and individual entrepreneurs. |
|||||||
In the European North nearly half (47.6%) of the large and medium enterprises hadn’t local hard-surface road; as a whole in the North area this indicator is even higher – 71.9%. Gas distribution networking is still very low. In the European North only 17.1% of the large and medium agricultural enterprises and 6.8% of the farmer households and individual entrepreneurs had some treatment facilities on the stock-farms.
References Agriculture on the European north: All-Russian agricultural census results
- The results of All-Russian agricultural census of 2006: in 9 Vol. -V.1: Basic results of All-Russian agricultural census of 2006: book 1: Basic results of All-Russian agricultural census over the Russian Federation/Federal government statistics service. -M.: IITz “Statistika Rossii”, 2008.
- The results of All-Russian agricultural census of 2006: in 9 Vol. -V.7: Agriculture of the Extreme North areas and the localities equated to this status/Federal government statistics service. -M.: IITz “Statistika Rossii”, 2008.
