Aligning molecular sequences by wavelet transform using cross correlation similarity metric

Author: J.Jayapriya, Michael Arock
Journal: International Journal of Intelligent Systems and Applications @ijisa
Article in issue: 11 vol.9, 2017.
Free access
The first fact of sequence analysis is sequence alignment for the study of structural and functional analysis of the molecular sequence. Owing to the increase in biological data, there is a trade-off between accuracy and the computation of sequence alignment process. Sequences can be aligned both in locally and globally to gives vital information for biologists. Focusing these issues, in this work the local and global alignment are focused on aligning multiple molecular sequences by applying a wavelet transform. Here, the sequence is converted into numerical values using the electron-ion interaction potential model. This is decomposed using a type of wavelet transform and the similarity between the sequences is found using the cross- correlation measure. The significance of the similarity is evaluated using two scoring function namely Position Specific Matrix and a new function called Count score. The work is compared with Fast Fourier Transform based approach and the result shows that the proposed method improves the alignment.
Sequence alignment, wavelet transform, cross-correlation, EIIP (Electron-Ion Interaction Potentials), PSM (Position Specific Matrix)
Short address: https://sciup.org/15016437
IDR: 15016437 | DOI: 10.5815/ijisa.2017.11.08
Text of the scientific article Aligning molecular sequences by wavelet transform using cross correlation similarity metric
Published Online November 2017 in MECS
The main goal of Bioinformatics is to better understand a living cell and its functionality at the molecular level. This can be fulfilled by the analysis of the raw molecular sequences and structural data. In sequence analysis, different concepts such as sequence alignment, motif and pattern discovery are covered. In essence, sequence alignment is a fundamental problem in computational genomics. The sequence represents one or more genomes or any type of molecules where all its lengths should not be compulsorily equal. Here the sequence is nothing but the combinations of the letter of alphabets. Sequence comparisons, which are based on evolutionary theory, are the foundation of Bioinformatics. Sequence alignment is a process in which the maximum matching residues between two sequences are identified. When two sequences are aligned then it is known as pair- wise alignment. The well-known algorithms for pair-wise alignment are Needle-Wunsch algorithm [11] (global alignment) and Smith-Waterman algorithm [18] (local alignment). If the similarity between two sequences is >200 or > 25% then they considered to be likely related, and if the similarity is 15-20% then they may or may not be related, and if the identification is <15% then they mostly not related. When the same alignment process is done for more than two sequences, it is known as Multiple Sequence Alignment (MSA). Any method used for basic pair-wise alignment can be extended to align multiple sequences. Figure 1 represents the two different forms of sequence alignment. The MSA can be defined as the process to arrange n sequences where n > 2 in such a way that a maximum number of residues from each sequence is matched. The MSA reveals more biological information than many pair-wise alignments can do.
Т С А А - - --
Т - А А Т С АА
Г С А.....
Т - А А Т С АТ
Т G А - Т - -Т
A
A T C A A - '
I I I
- T - A A T C A A'
A
Pair-wise Alignment.
Multiple Sequence Alignment
Fig.1. Sequence Alignment
Protein sequence multiple alignment identifies many conserved and functionally critical amino acid residues. The major three tasks in the MSA are scoring, creating an alignment and assessing its significance. There are many different methods for the alignment. Any sequences can be aligned globally or locally depending upon the information that should be extracted from the molecular sequences. A global alignment identifies the common residues between the whole sequences but local alignment finds the common similarity regions. To find similarity regions or similar motifs within sequences is called local alignment. All kind of biological applications mainly depends on local alignment than global alignment. It has an efficiency to find the basic subunits like motifs or domains. It is also very useful to find the characteristics of more highly conserved regions. This is used to identify the most conserved genes in DNA or regions in the protein. These conserved regions give more effective information for biological analysis. The best-known algorithm for local alignment is SmithWaterman (SW). Global alignment is used to find the evolutionary relationships among different species. For the alignments, many algorithms, approaches, models are proposed during past a decade. Tackling the increased biological data in less computation time is critical and this makes a demand for the efficient approaches. There are different approaches using heuristic and non-heuristic algorithms for pair-wise alignment. The main motivation for aligning multiple sequences is to find all the conserved regions, which is used for the drug design. In this work, a wavelet transform method with crosscorrelation metric and a transformation operator are employed for aligning multiple sequences locally and globally. This paper is organized as follows: Following the introduction, the subsection 1.1 gives the basic information about wavelet transform. Section 2 gives the literature review for the alignment approaches. In Section 3, the description of the proposed algorithm is elucidated. The implementation of the proposed work is given in Section 4. In Section 4.2 and Section 5, the experimental results and conclusion are presented.
-
A. Wavelet Transform
Fourier transform and wavelet transform are the techniques used in the signal processing. In the Fourier transform, the frequency of the signal is studied. But in the case of wavelet transform what and where the frequency is present in the signal is identified. In general Fourier transform is unable to pick out local frequency content. The fast Fourier transform takes about O(NlogN) operations and for the discrete wavelet trans- form (DWT) it takes O (N) operations. This is the reason why DWT is used in many applications. The wavelet transform can be expressed by the following equation
∫ f (x)ψ(*a,b) (x)dx
-∞
where * is the complex conjugate symbol and function Ψ is some function. A wavelet is a mathematical function useful in digital signal processing and image compression. Now it is widely used in Bioinformatics to analyze the biological data as signal [21].
-
II. Related Work
Normally, the MSA problem is solved using two basic approaches namely exhaustive and heuristic. The exhaustive alignment algorithms are like Needleman-Wunsch, Smith-Waterman using the dynamic programming concept. This method increases the computational time when the number of the sequences and lengths of the sequences are increased. To reduce time, the usage of heuristic approaches is initiated. The heuristic approaches that in turn are divided into 1. Progressive alignment algorithm and 2. Iterative alignment algorithm. There are many algorithms like CLUSTALW [19], T-Coffee [13] etc that uses former approach. The main drawback of the progressive algorithm is the initial guessing of the pair-wise alignment. To overcome this drawback, iterative alignment algorithms like improved version of Hidden Markov Model [15] is employed. Many evolutionary algorithms are used for this alignment problem [3][7]. When considering local alignment, there are many algorithms like EMBOSS [16] which uses the modified version of SW algorithm to improve the speed up, LALIGN [4] which finds the internal duplications by calculating non-interesting local alignments of protein or DNA sequences and BLAST that enables to compare a query sequence with a library of sequences, and identify library sequences that resemble the query sequence above a certain threshold for pair-wise alignment problem.
In 2002, Katoh et al., [6] has proposed a novel multiple sequence alignment problems using Fast Fourier transform (MAFFT). Now-a-days different versions of MAFFT are anticipated. In 2002, Hejase et al., [20] has proposed the sequence-scale similarity concept for protein sequence comparison based on the wavelet transform approach. In 2005 Negi et al., [12] has presented the time series similarity search and its applications using wavelet transform. Wen et al., in 2005 [21] proposed a new metric for analyzing the functional similarity of protein sequences based on DWT. In 2005, Rockwood et al., [17] has proposed an approach for sequence alignment by applying fast fourier transform and find similarity using the cross-correlation.
From the above study, it is understood that there is a trade-off between the accuracy and the computational time for the MSA problem. In addition to this, there is an increase in complexity because of the number of sequences and the length of the sequences. As both local and global alignment are important in giving some specific information for drug design to the biologist, in this paper, we propose an approach using wavelet technique to find a cross-correlation along with Transformation Operators (TO) for MSA problem.
The main contributions of our paper are
-
• Partitioning the sequences to focuses in local alignment
-
• Aligning the sequences, depending upon the lag value found using cross correlation metric
-
• Applying transformation operator in combined sequence set helps for global alignment
-
III. Proposed Approach
Problem Statement: Aligning sequences in such a way that more residues between them are found to be in the same column.
S a = S "1 { } (2)
where S A is the aligned sequences, n is the number of sequences, and symbol '-' represents gap. For PA and MSA, n will be 2 and >= 3 respectively.
-
A. Description
In this paper, both local and global alignment problems are handled. To solve the former, the proposed approach splits the sequence set into partitions and for the latter problem, a new transformation operator is employed to attain an efficient alignment.
The basic steps involved in the proposed method
-
1. If there are gaps in the sequences remove them.
-
2. Transfer the character sequences into numerical sequences using EIIP method.
-
3. The sequence set is split into sub-sequences set depending on δ.
-
4. Then the signal (sequence) is decomposed using one of the wavelet transform methods.
-
5. The cross-correlation of the partition subsequences are found to identify the lag which have maximum similarity value between all the pair of sequences.
-
6. Sequences are aligned according to the lag value.
-
7. The partition sub-sequences are combined and its fitness value is found.
-
8. To improve the alignment, a new transformation operator is applied.
The overview of the proposed work is given in the following Figure 2.
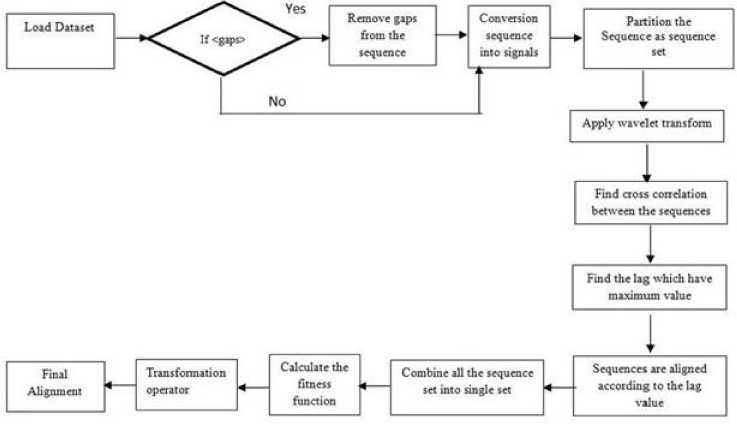
Fig.2. An Overview of the Proposed Work
The detail description of the steps is as follows,
Step 1: The length of molecular sequences can be of different length. For alignment, it is not necessary that length of all sequences should be same. To adjust the length of the sequences in such a way that all are in the same length, gaps are inserted. Initial gaps in the sequences are removed. The sequences like proteins/DNA/RNA are calculated using the following general model pseudo potential kk + q | w | k) = 0.25Z sin(n1.04Z) / (2n) (3)
where q is a change of momentum k of the delocalized an electron in the interaction with potential U, while
Z = £ Z i )/ N (4)
where Z i , is the number of valence electrons of the ith component of each amino acid and N is the total number of atoms in the amino acid. The EIIP values for DNA sequence are shown in Table 1. This is considered as the basic step that should be performed before wavelet transform is applied.
Step 3: And after this, the sequence is segmented into smaller length sub-sequences. Let δ be the parameter used to partition the whole sequence. Here, δ value is increased when the length of the sequence is large and decreased when small. Partitions of the sequences are depicted in Figure 3.
Table 1. EIIP values for DNA sequence
|
Nucleotide |
EIIP |
|
A |
0.1260 |
|
G |
0.0806 |
|
T |
0.135 |
|
C |
0.1340 |
Step 4: For each segmented sub-sequences, multidimensional wavelet decomposition is employed. There are many number of wavelet decompositions techniques are proposed. Here the 2D wavelet decomposition is used which is considered be best for moderate lengths.
ATCGATCAGCATCGACTACGACATTTTTACCATGAGTGACGTATCGAGCGAGCATTATCrAGCGACGAGTAGCTGATGCATGCGACGTAGCTCAGGCGA
ACGTAGCTGTACACCCCCTGACGTACCCGTAGCGAGCGTACCCCCCCCCCGCTACATCTATGCGAGCTAGAGCGACGTAGCGATGATGCCGTAGCAGGA
ATCGATCTGTACACCCCCTGTTCATTTTTACCATGACTGACGTATCGAGCGAGCATTATCTAGCGACGAAGAGCGACGTAGCGGACGTAGCTCAGGCGA
|
(a) Sequences |
|
|
ATCGATCAGCATCGACT |
ACGACATTTTTACCATG ACTGACGTATCGAGCGA GCATTATCTAGCGACGA |
|
ACGTAGCTGTACACCCC |
CTGACGTACCCGTAGCG AGCGTACCCCCCCCCCG CTACATCTATGCGAGCT |
|
ATCGATCTGTACACCCC |
CTGnCATTTTTACCATGA CTGATCGAGCGAGCAH ATCTAGCGACGAAGAG (b) Partition of the sequences Fig.3. Sequence set |
Step 5: In signal processing, cross-correlation is a measure of similarity of two series as a function of the lag of one relative to the other. This is also known as sliding dot product or sliding inner-product. As an example, consider two real valued functions f and g differing only by an unknown shift along the x-axis. One can use the cross-correlation to find how much g must be shifted along the x-axis to make it identical to f.
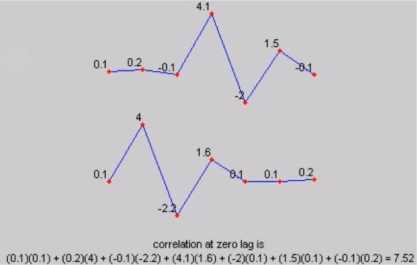
(a) At lag 0 position
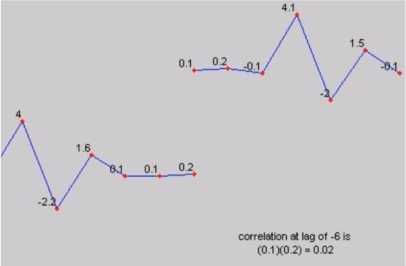
(b) At lag -6 position
Fig.4. Cross correlation
The formula essentially slides the g function along the x-axis, calculating the integral of their product at each position. When the functions match, the value of (f g) is maximized. This is because when peaks (positive areas) are aligned, they make a large contribution to the integral. Figure 4a and 4b shows the cross-correlation values at different lags 0 and -6 respectively.
Step 6: Sequences are shifted with left or right of their respective pair sequence using the lag that has a maximum cross correlation in each sub-sequence set.
Step 7: After that the whole sequence is combined together to find the score of similarity between them using scores. The proposed algorithm uses two fitness functions in such a way it finds the maximum matches of residues between two sequences namely the Position Specific Score Matrix and Count score. Position Specific Score matrix is formed in the following three steps.
Step 1- First find the occurrence of each base in each position of the given sequence to form a Base Occurrence Matrix (BOM).
Step 2- Then each value in BOM is divided by the number of bases (B) in the given sequence that is represented as
C j = BOM - B (5)
is the sequence column in the matrix. For example B=4, as it has four base namely A, T, C and G.
Step 3- Next, the maximum value of each column in the matrix is summed and divided by the length of the find the similarity value. The similarity of the sequence set is given as
Slmllarlty pop = ( j^ max( C j )) - ml (6)
j = 1
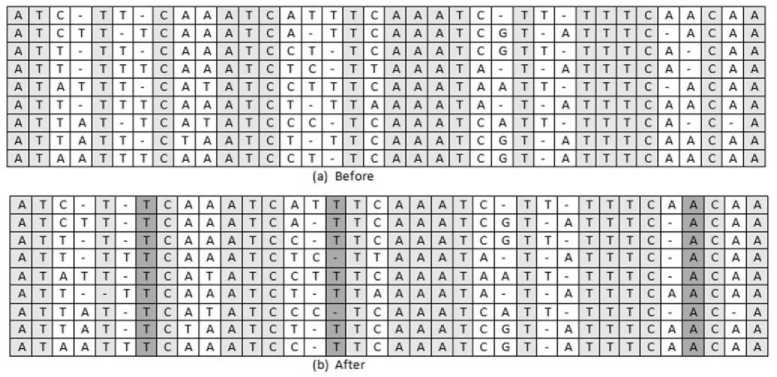
Fig.5. Transformation operator
'{{ AB, } u { SG j }}, if p = = q
A new fitness function F F is proposed to find the number of similar residues between all pair of sequences which is given in equation (7)
[ C + 1,if DS = 0
S = ,
( i , i + 1) [ 0, if DS * 0
S a H
{{ AB, } u { SG j }} u { ABp }, if p > q
{{ SG j } u { AB i }}, if p = = q
where S is similarity between two sequence S i and S i+1 , C is the count of the similarity residues between two sequences. Initially C is set as zero. Using equation (7 & 8), the similarity of n sequences are given by
Similarity = ^ j^ S ( i + j ) (9)
i = 1 j = i + 1
Step 8: To improve the alignment a new transformation operator is used.
-
B. Transformation Operator (TO):
Transformation operator is an adjusting tool to improve the alignment of the sequence set. A new TO is introduced and applied in this proposed work. The basic idea of TO is to keep the aligned blocks and shuffle the gaps between them. The aligned blocks are taken from initially aligned sequence set and employed local Gap Shuffling (SG) between this Aligned Block (AB) of the sequence. The gaps between the aligned blocks are counted and shuffled. Any number of aligned and unaligned blocks may be presented in the sequence set. The following equation (10) shows the generalized form for TO and example is depicted in Figure 5. In Figure 5(a), the slightly shaded region shows the common columns found in the sequence set before the transformation operator is applied and in Figure5(b), the darkly shaded columns shows the common residues in the sequence set after the TO.
-
IV. Result Analysis
-
A. Software Implementation & Dataset
The proposed algorithm is implemented in Windows 7 professional @ 2.50GHz, 64-bit operating system with installed memory 32GB, MATLAB 13a. To prove the efficiency of the proposed work, the benchmark dataset BaliBase for DNA sequence and Prefab4 for protein sequence are used for evaluation. Among them, the dataset is divided into eleven groups depending upon on its number of sequence and length of the sequence present in the each dataset for DNA sequence. The description of the dataset is given in the following Table 2. In this dataset varying lengths and different number of sequences are taken for the experimental analysis. In Table 3, fifteen dataset each having twelve protein sequences are presented with their average length.
-
B. Discussion
In general, ClustalW approach uses the p-distance for constructing the similarity matrix that finds approximate similarity between some sequences. So to evade this problem, here cross-correlation metric is used to find the lag positions that have maximum similarity between sequences. There are number of different Wavelet Functions (WF) each having different results depending upon the length of the sequences [21]. For dataset 1r69, Bior 3.5 WF finds high similarity. For 1idy, 2pia, Rbio 3.1 WF finds high similarity and Rbio 3.3 WF is used for kinase, 2myr dataset. In this proposed work, for evaluating the sequence alignment, the newly introduced Court score is used along with the traditional PSM score.
Table 2. DNA Dataset
|
Dataset |
Avg. Length of the Sequences |
No. of Sequences |
|
aboA ref2 |
193 |
15 |
|
aab ref1 |
246 |
4 |
|
aboA ref1 |
1572 |
4 |
|
ac5 ref1 |
264 |
5 |
|
ajsA ref2 |
1350 |
18 |
|
1r69 ref3 |
276 |
23 |
|
1pysA ref4 |
2520 |
4 |
|
kinase2 ref5 |
1518 |
12 |
|
kinase1 ref4 |
1770 |
7 |
|
kinase1 ref5 |
1149 |
5 |
|
kinase2 ref4 |
2901 |
18 |
Table 3. Protein Dataset
|
Dataset |
Avg. Length of the Sequences |
|
1a6dA 1ass |
494 |
|
1agjA 1cqqA |
233 |
|
1alu 1i1rB |
184 |
|
1amoA 1ddgB |
655 |
|
1amp 1cx8B |
369 |
|
an8 1eu4A |
219 |
|
1aoeA 3dfr |
183 |
|
1aoiD 1jfiB |
120 |
|
1ap0 1dz1A |
1100 |
|
1aq0A 1ghsB |
328 |
|
1aqt 1e79H |
137 |
|
1arb 2hrvA |
350 |
|
1auoA 1fj2B |
218 |
|
1auyA 1e57B |
1000 |
|
1awe 1btkA |
232 |
First, the sequences are partitions as sequence set depending upon the δ and applied wavelet decomposition technique. This is depicted in Figure 6. This figure shows the decomposition of a part of two sequences. From the decomposition itself, the variations between the two sequences is identified.
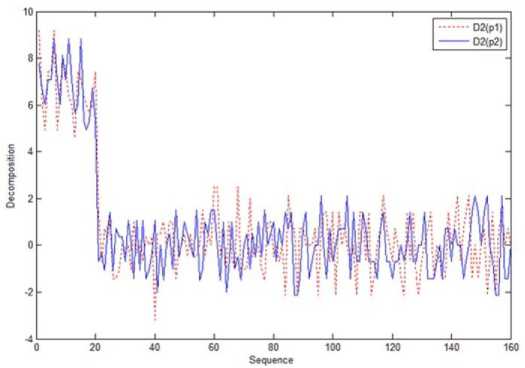
Fig.6. Decomposition of two parts of the Sequence
Using the cross correlation metric, the lag position that has the highest similarity between sequences are found and depicted in Figure 7. The straight line at each position represents the correlation value between two sequences. When the lag value is (+)ve it is shifted to right side and when (-)ve it is shifted to the left of the comparison sequence.
As it is necessary to find the similarity at each position between the sequences, correlation metric is considered as efficient one for aligning the sequences. From figure 7, it is observed that in lag position +1 the similarity between partition sequences is high. According to this maximum correlation value at one lag position, the sequences are aligned.
Figure 8 shows two partition sequences and their similarity for each lag position using cross correlation metric.
The top is a sequence partition 1 that is fixed where the down sequence partition 2 is shifted from left (negative) to right (positive). In each shift, the graph plots the similarity measure at each lap position. From the graph, it is observed that at lag position +1 the similarity is high for that particular sequence partition.
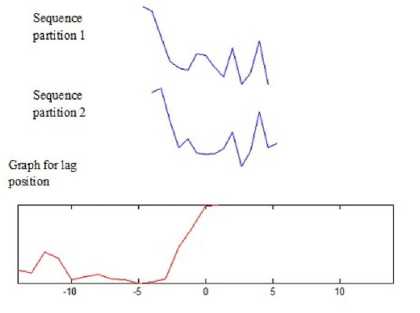
Fig.8. Similarity between partition sequences along lag position
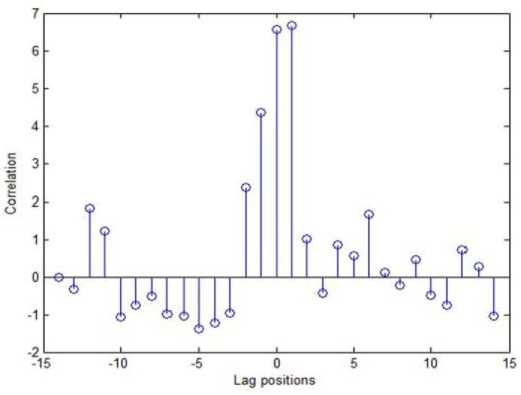
Fig.7. Lag position Identification
Even though, the similarity yielded by using the correlation value is better, to improve the alignment TO is used. The similarity score of before and after applying TO for DNA dataset are given in Table 4. This table also shows the % improved of similarity score after applying TO, which confirms that a small % of improvement is there. In biological analysis, even small differences are considered as more informative. From this % improved column, it is inferred that for the average sequence length 250, the % improvement is 0.2 and for the average sequence length 500, the % improved is 0.5. The main advantage of this TO is that the initial aligned columns are not adjusted. Therefore, it is concluded that for larger and more length molecular sequences, TO works efficiently.
To prove the significance of the proposed work the similarities obtain is compared with that of Fast Fourier transform method. This comparison for DNA dataset is depicted in Figure 9. This concludes that for the small sequence length dataset the difference between the FFT and WT similarity is small, but when considering larger sequence length the proposed work gives high similarity.
|
Table 4. Similarity measure Before and After TO |
|||
|
Dataset |
Similarity Score |
% Improved |
|
|
Before TO |
After TO |
||
|
D1 |
100 |
120 |
0.2 |
|
D2 |
210 |
230 |
0.2 |
|
D3 |
1250 |
1300 |
0.5 |
|
D4 |
220 |
242 |
0.22 |
|
D5 |
1050 |
1100 |
0.5 |
|
D6 |
1050 |
1100 |
0.5 |
|
D7 |
210 |
230 |
0.2 |
|
D8 |
2200 |
2250 |
0.5 |
|
D9 |
1150 |
1200 |
0.5 |
|
D10 |
1050 |
1100 |
0.5 |
|
D11 |
2150 |
2200 |
0.5 |
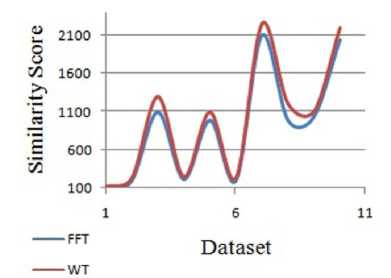
Fig.9. Similarity between FFT and WT for DNA dataset
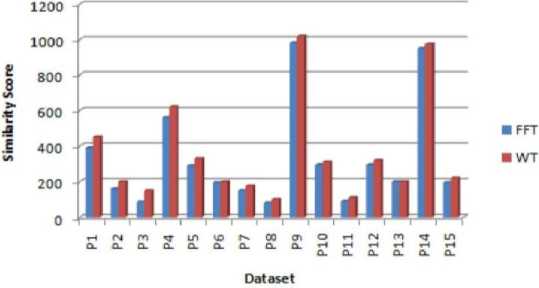
Fig.10. Similarity between FFT and WT for protein dataset
The efficiency of the proposed count score similarity function is depicted in Figure 11. The positions on the zero point highlight the similarity between two parts of the sequences.
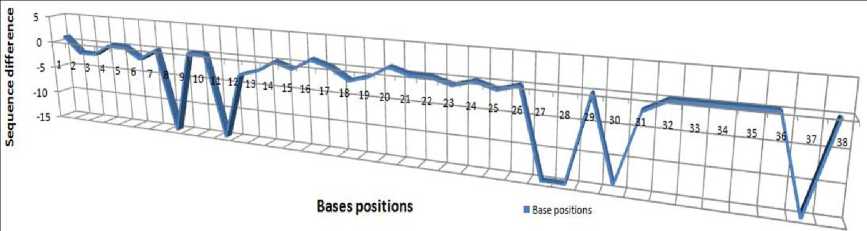
Fig.11. Similarity resides at each position between the sequences
The sample alignment is shown in Figure 12 for dataset D1. In this, red color characters in one column are the aligned ones. Then, pink color characters represent the base alignment and a black color character shows the mismatching among the sequences.
agcactatacga-ttttgtggcgtctggggataacacgctctccattacaaaaggtga TGCCATGTACGA-CTACATGGCGGCAGATGCAGACGAAGTTTCATTCAAGGATGGTGA AGCTAAGTACGA-TTTCAAAGCAACCGCTGACGATGAGCTCTCTTTTAAACGCGGGGA TGCCTTGTT c GA-CTTCAACGGGAACGACGAGGAAGACCTGCCTTT CAAAAAAG GIGA GGCGTTGTT C GA—CTTTGATCCTCAGGAGGATGGAGAGCTGGGCTT CCGTAGGG GCGA AGCATTATTTGA-CTACAAAGCCCAACGCGAAGATT-AGTTGAGATTTATAAAGTCGG-AGCGCTTT AC GA-CT ATCAGGAGAAATCTCCGCGT 3AAGTCACCAT GAAAAAG " GGGA T GCTAAAT ACAA-TTTTCACGGTACTGCCGAGCAGGACCT AC CATT TTGCAAG3 GAGA GGCTCTGTACGA-TTATGAAGCAATACACCATGAGGATTTGTCGTTCCAGAAGGGAGA AGCGTTGTACGA-CTATCAAACGAACGATCCTCAGGAGCTGGCACTGAGGTGCGATGA TGCGTTAIATGA-CTACGAAGCCATAACAGAGGATGACCTCTCGTTTCATAAGGGAGA GGCACTCTTTGA-rTTCAATCCACAGGAAAGTGC-AGAGTTAGCCTTCAAACGCGGTGA CGCCTTATGGGA-TTATGAACCTCAGAATGACGAT GAGTTGCCTAT GAAAGAG 3 GAGA T GCACT CT AC GA-TTACAAAAAAGAGAGGGAGGAA" 7 T AT CGACT T GCATTTG " GAGA AGAGATTCCC GAGATCCAGTGTGGAAGGGACCTC CAAAATT—ATT GTGGAAA 3 GGGA
Fig.12. Sample alignment of D1 dataset
-
V. Conclusion
Aligning sequence is the process for the identification of crucial information of biological factors in Bioinformatics. This work proposed a new approach to focus both global and local alignment by segmenting the sequences. Using the cross-correlation similarity metric, the lag between the sequences are found to align the sequences. The experimental result shows how far the proposed approach finds more similarity regions among the sequence set. The accuracy is measured by scoring function PSM and Count Score. As future work, the approach is implemented in parallel for large dataset to speed up the process.
Acknowledgment
The authors would like to thank Ministry of Human Resource Development, Government of India for providing financial support for this research.
References Aligning molecular sequences by wavelet transform using cross correlation similarity metric
- Arabi E. keshk,"Enhanced Dynamic Algorithm of Genome Sequence Alignments", IJITCS, vol.6, no.6, pp.40-46, 2014. DOI: 10.5815/ijitcs.2014.06.06
- Cosic, I.: Macromolecular bioactivity: is it reso- nant interaction between macromolecules?-theory and applications. Biomedical Engineering, IEEE Transactions on 41(12), 1101–1114 (1994).
- Das, S., Abraham, A., Konar, A.: Swarm intelli- gence algorithms in bioinformatics. In: Computa- tional Intelligence in Bioinformatics, pp. 113–147. Springer (2008).
- Huang, X., Miller, W.: Lalign-find the best local alignments between two sequences. Adv. Appl. Math 12, 373 (1991).
- Jayapriya J, Michael Arock," A Novel Distance Metric for Aligning Multiple Sequences Using DNA Hybridization Process", International Journal of Intelligent Systems and Applications(IJISA), Vol.8, No.6, pp.40-47, 2016. DOI: 10.5815/ijisa.2016.06.05
- Katoh, K., Misawa, K., Kuma, K.i., Miyata, T.: Mafft: a novel method for rapid multiple sequence alignment based on fast fourier transform. Nucleic acids research 30(14), 3059–3066 (2002).
- Kaya, M., Sarhan, A., Alhajj, R.: Multiple sequence alignment with affine gap by using multi-objective genetic algorithm. Computer methods and programs in Biomedicine 114(1), 38–49 (2014).
- M. I. Khalil,"A New Heuristic Approach for DNA Sequences Alignment", IJIGSP, vol.7, no.12, pp.18-23, 2015.DOI: 10.5815/ijigsp.2015.12.03
- Lee, Z.J., Su, S.F., Chuang, C.C., Liu, K.H.: Ge netic algorithm with ant colony optimization (ga- aco) for multiple sequence alignment. Applied Soft Computing 8(1), 55–78 (2008).
- Naznin, F., Sarker, R., Essam, D.: Progressive alignment method using genetic algorithm for mul- tiple sequence alignment. Evolutionary Computa- tion, IEEE Transactions on 16(5), 615–631 (2012).
- Needleman, S.B., Wunsch, C.D.: A general method applicable to the search for similarities in the amino acid sequence of two proteins. Journal of Molecular Biology 48(3), 443–453 (1970).
- Negi, T., Bansal, V.: Time series: Similarity search and its applications. In: Proceedings of the Inter- national Conference on Systemics, Cybernetics and Informatics: ICSCI-04, Hyderabad, India, pp. 528– 533 (2005).
- Notredame, C., Higgins, D.G., Heringa, J.: T- coffee: A novel method for fast and accurate multi- ple sequence alignment. Journal of Molecular Biol- ogy 302(1), 205–217 (2000) .
- Orobitg, M., Cores, F., Guirado, F., Roig, C., Notredame, C.: Improving multiple sequence align- ment biological accuracy through genetic algorithms. The Journal of Supercomputing 65(3), 1076–1088 (2013).
- Rasmussen, T.K., Krink, T.: Improved hidden markov model training for multiple sequence align- ment by a particle swarm optimization evolutionary algorithm hybrid. Biosystems 72(1), 5–17 (2003).
- Rice, P., Longden, I., Bleasby, A., et al.: Emboss: the european molecular biology open software suite. Trends in Genetics 16(6), 276–277 (2000).
- Rockwood, A.L., Crockett, D.K., Oliphant, J.R., Elenitoba-Johnson, K.S.: Sequence alignment by cross-correlation. Journal of Biomolecular Tech- niques: JBT 16(4), 453 (2005).
- Smith, T.F., Waterman, M.S.: Identification of common molecular subsequences. Journal of Molecular Biology 147(1), 195–197 (1981) 16. Thomopson, J., Higgins, D.G., Gibson, T.J.: Clustalw. Nucleic Acids Res 22, 4673–4680 (1994).
- Thomopson, J., Higgins, D.G., Gibson, T.J.: Clustalw. Nucleic Acids Res 22, 4673{4680 (1994).
- de Trad, C.H., Fang, Q., Cosic, I.: Protein sequence comparison based on the wavelet transform ap- proach. Protein Engineering 15(3), 193–203 (2002).
- Wen, Z.n., Wang, K.l., Li, M.l., Nie, F.s., Yang, Y.: Analyzing functional similarity of protein sequences with discrete wavelet transform. Computational Biology and Chemistry 29(3), 220–228 (2005).
