An Algorithm for the Initial Detection of Malicious Traffic Based on the Autoencoder Reconstruction Error and a Variational Model: the Influence of the Error Distribution Density on the Performance Indicators of the Models

Author: Adeyemi Marc Aurele Emmanuel Djeguede
Journal: Вестник Пермского университета. Математика. Механика. Информатика @vestnik-psu-mmi
Section: Компьютерные науки и информатика
Article in issue: 2 (69), 2025.
Free access
The emergence of new sophisticated types of attacks forces the community of computer security researchers to constantly improve detection tools and response methods. The present study explores different factors of autoencoders and variational models that influence their effectiveness in identifying novel attack types and malicious network traffic. The general idea of the proposed algorithm is to construct a confidence interval for the reconstruction error of the training sample, based on which a decision is made on the maliciousness of a particular traffic. Additional emphasis was placed on selecting an appropriate error metric to minimize the overlap between the density distributions of reconstruction errors for normal and malicious traffic. In the study of the variational model, the effect of the t-distribution on the quality of detecting new types of attacks was investigated. The studies were conducted on the CIC-IDS2017 dataset of the Canadian Cybersecurity Institute, containing up to 14 types of traffic and attacks. The experimental results show that with a competent selection of the error measure and the threshold values of the confidence interval, our models outperform existing analogues in various performance indicators.
Autoencoders, variational models, zero-day attacks detection, reconstruction error
Short address: https://sciup.org/147251029
IDR: 147251029 | UDC: 004.021, 004.056 | DOI: 10.17072/1993-0550-2025-2-47-64
Алгоритм первичного обнаружения вредоносного трафика на основе ошибки восстановления автокодировщика и вариационной модели: влияние плотности распределения ошибок на показатели эффективности моделей
Появление новых изощрённых типов атак вынуждает сообщество исследователей в области компьютерной безопасности постоянно совершенствовать инструменты обнаружения и методы реагирования. В данном исследовании рассматриваются различные факторы, влияющие на эффективность автокодировщиков и вариационных моделей при выявлении новых типов атак и вредоносного сетевого трафика. Общая идея предлагаемого алгоритма заключается в построении доверительного интервала для ошибки восстановления обучающей выборки, на основе которого принимается решение о вредоносной природе конкретного трафика. Особое внимание было уделено выбору подходящей метрики ошибок, чтобы минимизировать перекрытие распределений плотности ошибок восстановления для обычного и вредоносного трафика. При изучении вариационной модели было исследовано влияние tраспределения на качество обнаружения новых типов атак. Исследования проводились на наборе данных CICIDS2017 Канадского института кибербезопасности, содержащем до 14 типов трафика и атак. Результаты эксперимента показывают, что при грамотном выборе меры погрешности и пороговых значений доверительного интервала наши модели превосходят существующие аналоги по различным показателям эффективности.
Text of the scientific article An Algorithm for the Initial Detection of Malicious Traffic Based on the Autoencoder Reconstruction Error and a Variational Model: the Influence of the Error Distribution Density on the Performance Indicators of the Models
ознакомиться с условиями этой лицензии, посетите сайт
The tasks of recognizing known types of attacks and classifying them are based on a priori knowledge about the characteristics of malicious traffic, but the formation and correct formalization of knowledge about new types of attacks is not always a trivial task. The general established concept of detecting new types of attacks is based on deviations searching from the specified characteristics of some normal traffic. A trivial application of this concept was to calculate statistical indicators for each traffic characteristic with the subsequent establishment of a confidence interval for these characteristics, based on which a decision is made about whether a particular traffic belongs to normal traffic or malicious. The rapid development of neural network architectures has given a new impetus to the improvement of tools and models for detecting new types of attacks. The family of autoencoder architectures, with its ability to recreate the input training sample, has found the most suitable application in the field of detecting new types of attacks (zero-day attacks). The main idea in this context is to train an autoencoder to reconstruct normal traffic and, based on the statistical indicators of the reconstruction error, to construct a confidence interval that allows maximizing the model's performance when detecting various malicious traffic. In this regard, a number of questions arise that have not yet been fully studied by the scientific community. In this paper, the goal was to analyze how the reconstruction error metric and its distribution impact the performance of autoencoders, as well as how the distribution function of the parametrization coefficient ϵ affects the prediction quality of variational models.
Literature review
W. Qiu et al. [1] propose a hybrid intrusion detection system called DST-IDS. DST-IDS analyzes both individual data packets and entire flows, and then applies the Dempster-Schafer theory to predict network attacks. DST-IDS is designed to work in real time with heterogeneous data distribution, when the distribution of the training data set may differ from the distribution of data during implementation. This property significantly increases the applicability of DST-IDS. Y. Jingcheng et al. in [2] presented a new technique for detecting anomalies in traffic that can detect zero-day attacks. For this purpose, 2D images are formed from the traffic flow and fed to the input of an auto encoder based on convolutional neural networks to extract the feature vector. Then, based on the value of the distance function between the vectors of the normal class and the remaining classes, a conclusion is made about the presence of anomalies and zero-day attacks in the traffic. In [3], to solve the class imbalance problem associated with the small number of malicious traffic representatives, J. Zhang et al. proposed Siamese neural networks called MF2POSE. Using the same architecture for the twin networks, they perform two different tasks, multi-class classification for the main network and binary classification for the second network, while the authors applied the transfer learning mechanism from the network with the binary task to the network with the multiclass task. N. Gupta et al. [4] propose an intrusion detection system LIO-IDS based on a recurrent neural network with long short-term memory (LSTM) and an improved One-vs-One algorithm for processing malicious network traffic. LIO-IDS is a two-tier system, the first tier of which separates malicious traffic from normal network traffic using the LSTM classifier. The second tier uses ensemble algorithms and the one-versus-one (I-OVO) method to classify malicious traffic. In addition, to improve the detection performance of small malicious attacks, synthetic data was generated to replenish these classes. D. Olszewski et al. [5] conducted a study to identify the impact of the following algorithms - self-organizing map (SOM), t-distributed stochastic neighbor embedding (t-SNE) and adaptive neighborhood search visualizer (NeRV) on the quality of anomaly detection in IoT network traffic. The original contribution of this study is to conduct a comparative analysis of the t-SNE and NeRV dimensionality reduction approaches in both theoretical and empirical aspects.
To effectively identify malicious traffic, M. Gao et al. [6] developed an anomaly detection method based on the IoT traffic attribute graph. To ensure the applicability of the model in large-scale IoT networks, a graph node compression algorithm based on the Huffman coding algorithm was developed. Qian Ma et al. [7] applied a support vector machine with a kernel function for linearly inseparable samples to classify network traffic anomalies. The work consists of three phases. In the first phase, a new method for transforming input traffic data is proposed based on statistical transformations and k-gram method, which transform each URL into a feature vector with a fixed length. In the second stage, a classifier is trained using the obtained feature vectors as input and the hyperparameter of the support vector machine kernel is tuned using one-dimensional optimization. In the last stage, the classification of unknown URLs is carried out after pretransforming them into feature vectors. X. Wang et al. [8] propose a lightweight spatio-temporal knowledge transfer (STKD) architecture. The main components of this architecture for anomaly detection include two neural networks MSSTRNet and LENet. MSSTRNet integrates onedimensional convolutional (1D CNN) and recurrent (LSTM) neural networks as the main learning model with the subsequent objective of transferring its knowledge to LENet, a lightweight model. In order to improve the prediction quality of the model, a focal loss function was introduced instead of the traditional cross-entropy loss function.
Y. Wu et al. [9] developed a new zero-day attack detection system based on the Deep Q-Network (DQN) architecture. Functionally, the system consists of three components - a network intrusion detection system classifier, a sample selection strategy, and annotation. The DQN model plays a control role in detecting, selecting, and annotating packets corresponding to zero-day attacks. A bidirectional recurrent network (BiLSTM) is integrated into the DQN model structure to form a traffic selection policy. The selection is made based on the analysis of temporal correlation by the classifier using the euclidean distance as a measure to separate the selected samples. S. Shen et al. [10] proposed a DQN-based intrusion detection system using heuristic learning for IoT traffic in the scenario of insufficient training samples. The proposed system consists of two modules, a traffic processing module and a DQN-based module.
The network traffic processing module generates IoT traffic samples, splits them into subsets and then transmits them to the classifier and cybersecurity expertise center. The application of reinforcement learning in DQN allows its ability to detect malicious traffic to be gradually improved. In this regard, the reward function is designed to reward correctly classified malicious samples, so that the DQN network maximizes the value of the reward function to find the optimal strategy for training. Swathy Akshaya et al. in [11] explored the benefits of game theory in intrusion recognition and detection. This study considers zero-day traffic samples generated by generative adversarial networks, which pose a significant threat while being undetected by conventional classifiers. It emphasizes the use of adaptive game theory strategies while conducting experiments with a modified Bi-LSTM recurrent network and autoencoders. M. Soltani et al. [12] developed a deep learning-based novel system consisting of four stages. The first stage uses a deep neural network to identify unknown samples, i.e. potential new attacks, while simultaneously generating reports on different known attacks. Then, the new samples are divided into different groups using clustering algorithms by combining the deep model and clustering algorithms. These clusters are the key to creating a label for the unknown samples, thus reducing the time and effort of a team of experts. The next stage involves a team of experts to more formally explore the clusters and assign labels. The last stage uses the labeled groups to update the deep learning model.
September 2016 and March 2018 were marked by the outbreak of Mirai botnet attacks and memcached attacks. Such attacks are characterized by pre-collection of information about the victim devices and their infection. Given that none of the existing intrusion detection systems were able to detect and mitigate the impact, A. Blaise et al. [13] developed an early detection method for emerging botnets and unknown vulnerabilities, which consists of monitoring and collecting portlevel statistics using a simple but effective time series anomaly detection algorithm based on the modified Z-score and the hypothesis of normal distribution of the series. Wenqi Chen, Zhiliang Wang, Liyuan Chang et al. [14] presented an anomaly detection model based on an ensemble algorithm called ADSIM.
The ADSIM model implements the unsupervised learning paradigm, that first iteratively and gradually maintains a distance matrix to record the similarity between classifiers during the training phase, and then uses hierarchical clustering to group similar classifiers. During the discovery phase, each cluster will be assigned a weight based on the consistency of the discovery results of the classifiers.
Materials
CIC-IDS-2017 (Canadian Institute for Cybersecurity Intrusion Detection System 2017) is an important resource developed by the Canadian Institute for Cybersecurity to support cybersecurity researchers, academics, and practitioners in their efforts to detect and prevent network attacks. This dataset includes a variety of network traffic types, including both normal and abnormal. Specifically, it covers malicious traffics such as.
PortScan – A port scan is a technique used to probe a server or host for open ports. It can also be used maliciously by attackers to gather information about a target system before launching an attack.
Botnet – A botnet attack is a type of cyberattack that involves a network of compromised devices (called bots or zombies) controlled by an attacker (called the botmaster or command-and- control (CandC) server). These devices are typically infected with malware, allowing the attacker to remotely control them and use them for malicious purposes. Botnets are a significant threat to cybersecurity due to their ability to scale and execute large-scale attacks.
DoS – Denial-of-Service is an attack where a single source overwhelms a target (server, network, or service) with excessive traffic or malicious requests, rendering it unavailable to legitimate users.
DDoS – Distributed Denial-of-Service is a coordinated attack using multiple compromised devices (a botnet) to flood a target from numerous locations, amplifying impact and complexity.
Heartbleed – Heartbleed is a critical security vulnerability discovered in 2014 that affected the widely used OpenSSL cryptographic library. The Heartbleed bug allowed attackers to exploit a flaw in OpenSSL to steal sensitive data from servers, including private keys, passwords, and other confidential information.
XSS – Cross-Site Scripting (XSS) is a common web application vulnerability that allows attackers to inject malicious scripts (typically JavaScript) into web pages viewed by other users. This can lead to unauthorized actions, data theft, or defacement of websites. XSS attacks exploit the trust a user has for a particular website, making it a serious security threat.
SQL Injection – SQL Injection (SQLi) is a type of web security vulnerability that allows attackers to inject malicious SQL code into queries made by an application to its database. It occurs when user-supplied input is not properly validated, sanitized, or parameterized and can lead to unauthorized access, data theft, data manipulation, or even full control over the database.
Infiltration – It refers to the unauthorized entry into a computer network by malicious actors with the intent to compromise data, systems, or operations. It emphasizes stealth to avoid detection, allowing attackers to persist within the network and achieve objectives such as data theft, espionage, or disruption.
SSH and FTP Brute-force – A brute force attack is a trial-and-error method used by attackers to gain unauthorized access to systems, accounts, or encrypted data. The attacker systematically tries all possible combinations of passwords, encryption keys, or other credentials until the correct one is found.
CIC-IDS-2017 also contains over 80 features, allowing researchers to test their models on real-world scenarios. The data is presented in various formats, including PCAP (Packet Capture) and CSV (Comma-Separated Values), which provides flexibility in its use. The dataset contains metadata about network connections, such as timestamps, IP addresses, ports, and other parameters, which makes it convenient for analysis and training machine learning models. CIC-IDS-2017 is actively used to develop machine learning and deep learning algorithms for intrusion detection, as well as to improve existing security systems.
Methods. Mathematical model and architecture of auto encoder
The mathematical model of the auto encoder can be represented as an optimization of the reconstruction error of input vectors of the form ф,ф = аг дтт ф,ф\ \Х — фо ф(Х)|\2, where ф -encoding function and ф - decoding function such that ф:Х ^ F ф-.F ^ Х' . The reconstruction error can be calculated using one of the following formulas
1И\ 2 = ТЁС*7— *i ) 2 and |\%|\ i = S iU lx'— % i l. (1)
Variational autoencoder. Based on variational inference, the variational auto encoder belongs to a class of generative models that learn to map input vectors to a latent probability space and back. The VAE model answers the question of what distribution the latent space vectors Z should be generated from, so that the decoder can generate new vectors from the same distribution as X, but different from the existing vectors.
For any x E X we define P(x) = f P(x\z) ■ P (z) ■ dz. To generate latent space vectors, it is necessary to maintain a distribution P(Z\X).From the Bayesian formula we can write p(Z\X = O) = P- ^E|DlZ^ where P(X = O^ = fz^ f^ iP(X,Z')dZ0^dZD -i . Since it’s impossible to find the closed distribution formula P(Z\X = O) due to expression P(X = O), in the future we will approximate it by distribution q(z) = N(Z,[l,o) from the family of Gaussian distributions. To estimate the permissible error, replacing P(Z\X = O') by q(Z} we use the Kullback-Leibler divergence. This divergence usually allows us to measure the distance between two distributions. The further task is to minimize the distance between P(Z\X = O) and q(Z) which is expressed by the formula (1) q = arg min^KL(q(Z)\\P(Z\X = O')"), where Q - family of Gaussian distributions. KL divergence can be defined as the mathematical expectation of the logarithm of the ratio of q(Z~) and P(Z\X = O) and express through the formula KL(q(Z)\\P(Z\X)) = E z~q(z) [log (^(|^)]. Replacing P(Z\O) = ^^ in the expression of KL-divergence and transforming it we obtain KL(q(Z)\ \ p(Z\X)) = —Ez^q^ [log (v^^) ] +
4 4(Z)
log(p(O)), where L(q^ = Ez~q(Z-) [log (p(Z'D)) ]. We can then rewrite the divergence expression as KL = -L(q) + log(p(D)), wherellog(p4<(O>)JS 0 and KL >_ 0, then L(q) .0 and defines the evidence lower bound log(p(O')') (ELBO). From all of the above, we can conclude that L(q^ = log(p(O)) then and only then when KL(q(Z)\\p(Z\X)) = 0 and the problem of minimizing divergence q = arg min^KL(q(Z)\\p(Z\X = O')) equivalent to q = arg max^L(q). Variational autoencoder model is showed in fig. 1.
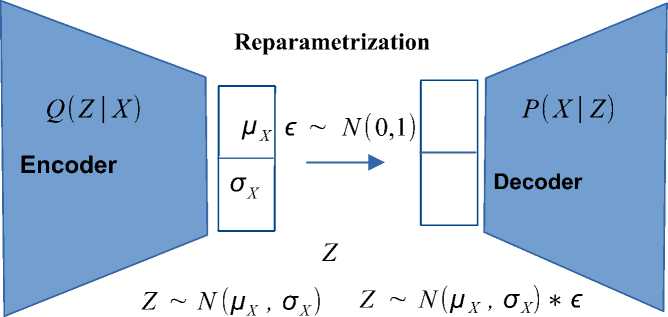
Fig. 1. Variational autoencoder model
Results and discussions
The models of autoencoder and variational autoencoder studied in this paper have the common basic architecture described in table 1. The main difference is in the latent space representation. For the autoencoder, the latent space is deterministic. The encoder maps the input to a fixed point in the latent space. There is no explicit structure or constraints on the latent space, which can lead to irregular gaps or discontinuities. Variational Autoencoder (VAE) has a probabilistic latent space. The VAE outputs the parameters (mean and variance) of a probability distribution (e.g., Gaussian). The latent space is regularized to follow a specific distribution (e.g., standard normal distribution), ensuring a smooth and continuous latent space. This allows for meaningful interpolation and sampling in the latent space.
Table 1. Autoencoder architecture
|
Encoder |
Decoder |
|
512 - ReLu |
4 - ReLu |
|
256 - ReLu |
8 - ReLu |
|
128 - ReLu |
16 - ReLu |
|
64 - ReLu |
32 - ReLu |
|
32 - ReLu |
64 - ReLu |
|
16 - ReLu |
128- ReLu |
|
8 - ReLu |
256 - ReLu |
|
4 - ReLu |
512 - ReLu |
|
2 - ReLu |
Since our two models belong to the class of "unsupervised machine learning", the research methodology will be based on finding the threshold value of the training sample reconstruction error at which it is possible to make a decision with a high degree of probability about the belonging of the input vector to a particular traffic class. Note that in the process of training our models, only normal traffic data was used, which allows us to further test the ability of these models to detect new unknown types of attacks and anomalies. As a loss function for the auto encoder, we use binary cross-entropy
Ь всЕ ^У, A) = - 1 ■ ^ i=i [yi ■ log^ + (1 - yd ■ l°g(1 - A)].
The proposed algorithm fig. 2 below is based on the autoencoder reconstruction error. The term reconstruction error refers to the distance between the original input vector and its image generated by the models under study. The main hypothesis on which the algorithm is built is that the reconstruction error for malicious traffic will be higher than the reconstruction error for normal traffic.
In this paper, we consider several distance measures - mean absolute error (MAE), mean square error (MSE), binary cross entropy (BCE) and harmonic mean error. Figure 3 shows the error panel of all above listed errors and for all traffic classes.
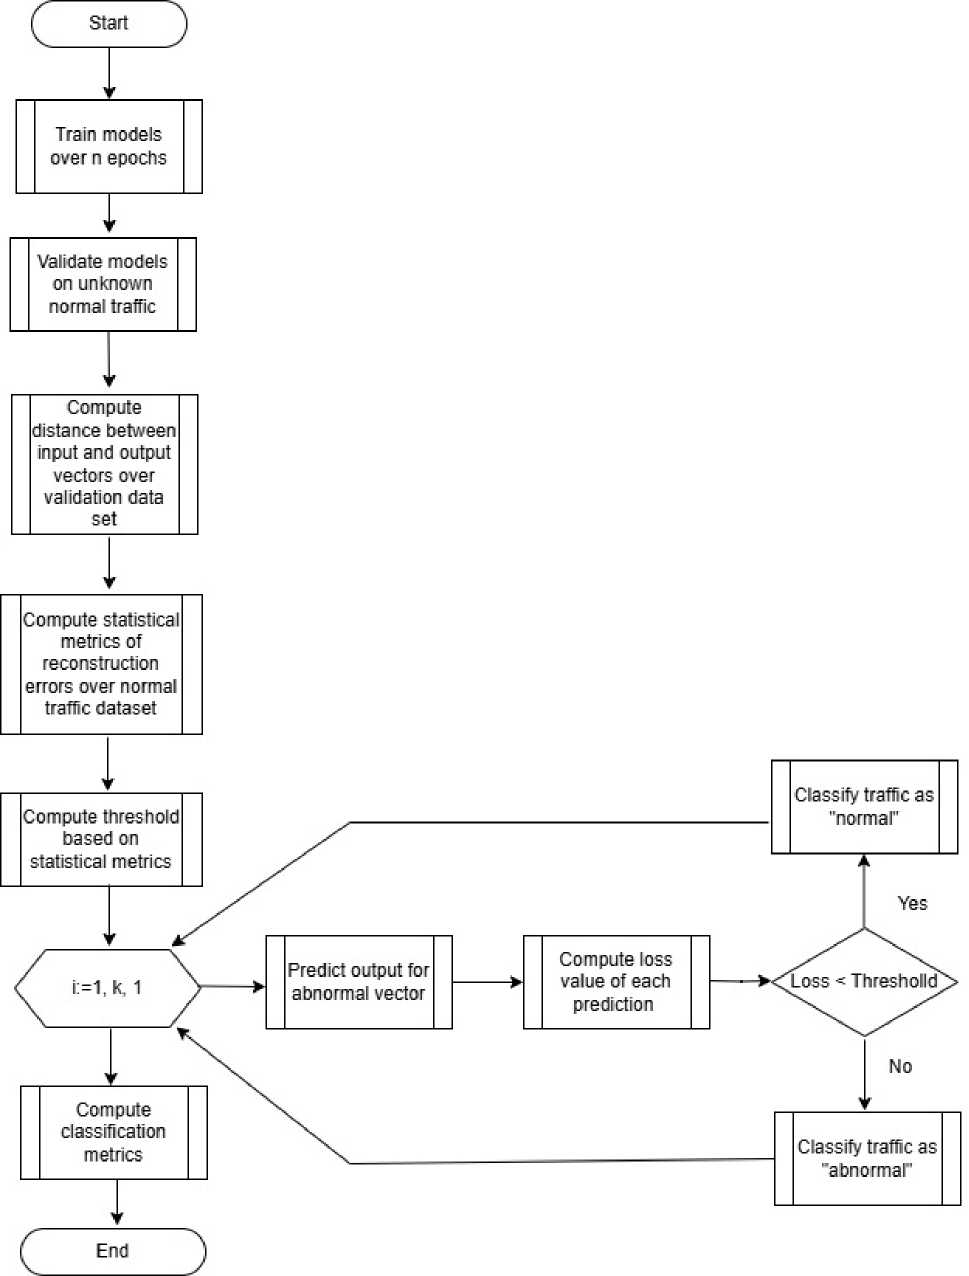
Fig. 2. Reconstruction error based algorithm for traffic classification
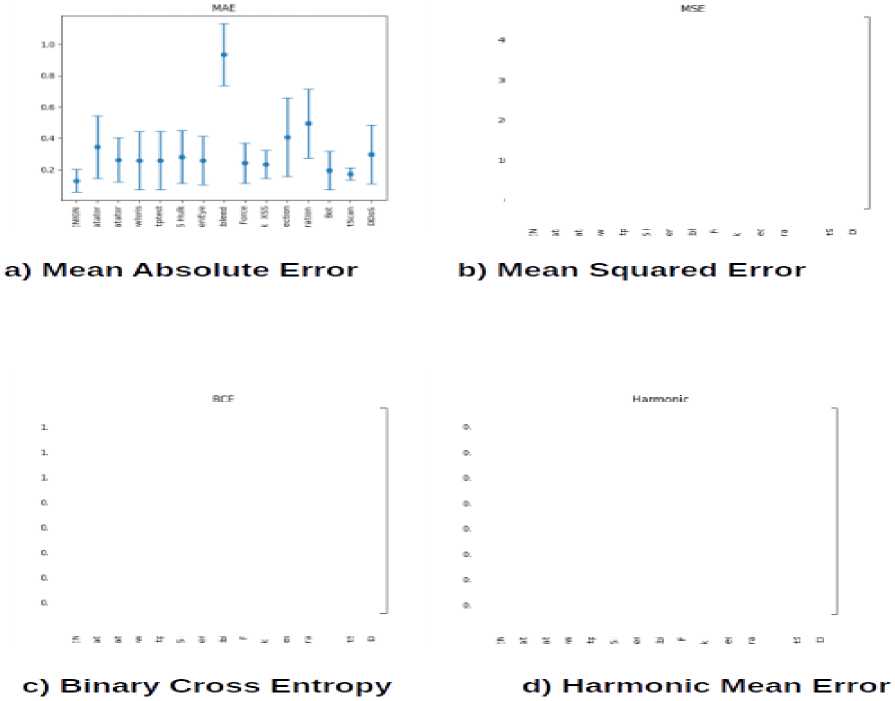
Fig. 3. Confidence intervals of errors for different traffic classes
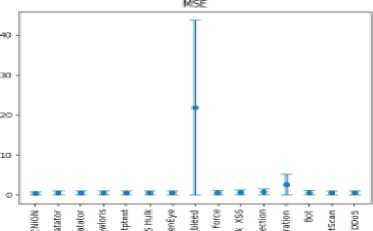
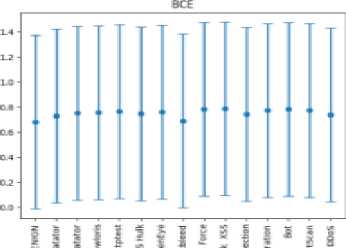
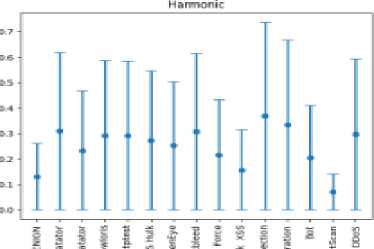
From fig. 3 it is noticeable that the mean square error is the most suitable error measure for our algorithm as it shows the least degree of overlap between the distributions of normal traffic reconstruction errors and malicious traffic.
A more detailed picture of the mean absolute error for each class of malicious traffic can be seen in figs. 4–6. Each graph represents the difference between the average vector of the corresponding malicious traffic and its reconstruction generated by the auto encoder.
Also based on these graphs it is easy to have an idea of the malicious traffic attributes that make the greatest contribution to its detection.
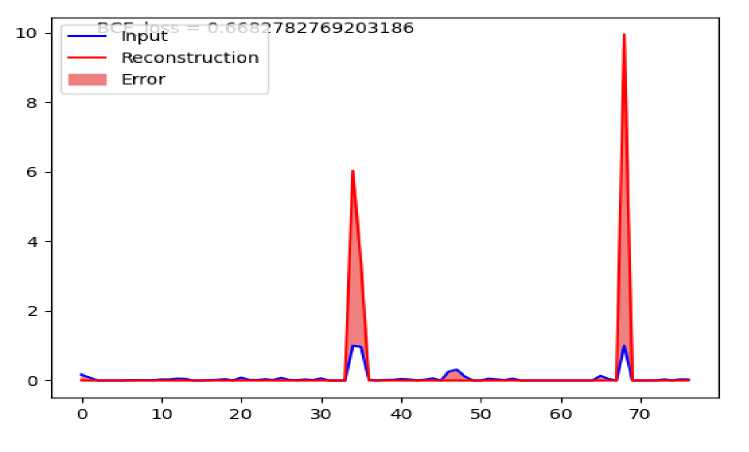
Fig. 4. Average reconstruction error for benign traffic
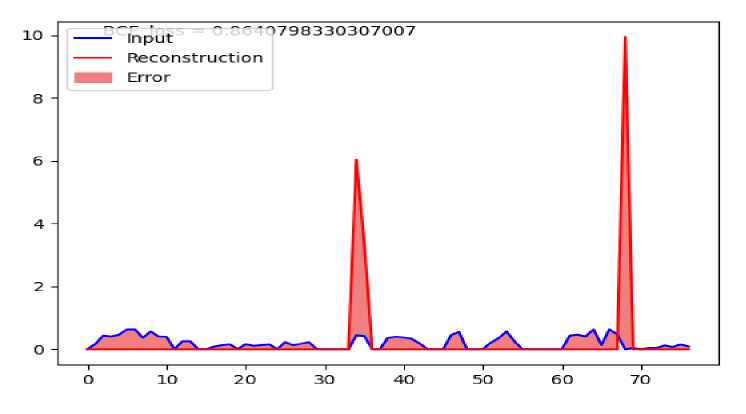
Fig. 5. Average reconstruction error for DDoS traffic
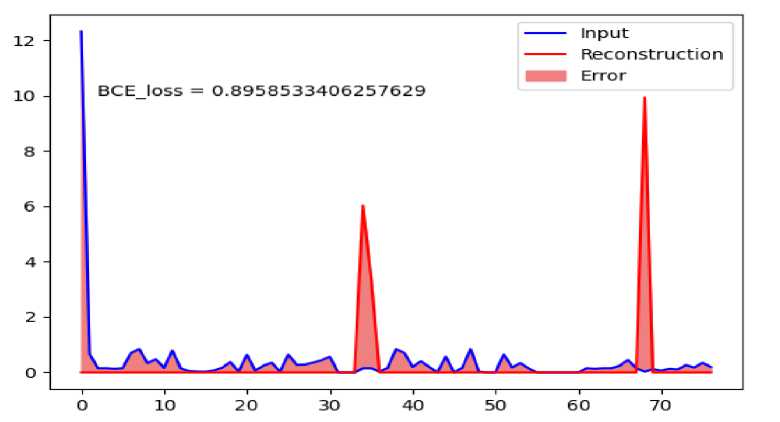
Fig. 6. Average reconstruction error for Infiltration traffic
In machine learning, particularly in the context of training neural networks, an epoch refers to one complete pass through the entire training dataset. During training, the model's parameters (e.g., weights in a neural network) are updated iteratively to minimize the loss function. The number of epochs is a hyperparameter that determines how many times the model will see the entire dataset during training.
To evaluate the quality of the proposed algorithm based on the auto encoder, the following metrics were selected: Accuracy, Recall, F1 score, ROC curve and the area under the curve value.
-
1. Accuracy measures the proportion of correctly classified instances (both true positives and true negatives) out of the total number of instances.
-
2. Recall measures the proportion of actual positives that are correctly identified by the model.
-
3. The F1 score is the harmonic mean of precision and recall, providing a balance between the two.
-
4. The ROC (Receiver Operating Characteristic) curve is a graphical representation of a model's performance across different classification thresholds.
-
5. AUC (area under the ROC curve) measures the entire area under the ROC curve, providing a single value to summarize the model's performance across all classification thresholds.
Data distribution
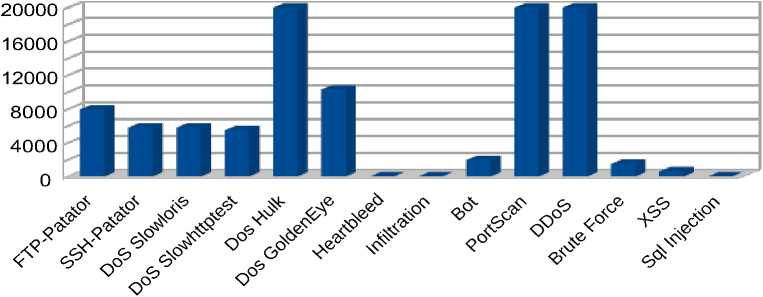
Traffics
Fig. 7. Distribution of dataset
The above metrics were measured after training epochs equal to 50, 150 and 200.
In figure 7 we have the distribution of malicious traffic based on which the tests were conducted. From this histogram we can observe a strong imbalance between different classes of malicious traffic, which reflects the frequency of these attacks in the real world. Thus, we observe that the "Denial of Service (DoS) " attacks are the most common, while more complex types of attacks from a technical point of view such as "Heartbleed" and "Infiltration" are very few. In order to maintain an objective picture of the world, it was decided not to artificially increase the number of rare types of attacks.
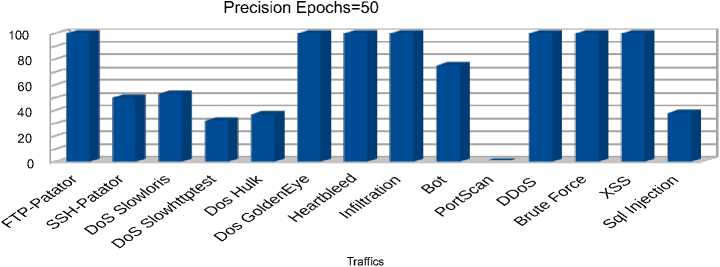
a) Precision metric for 50 epochs
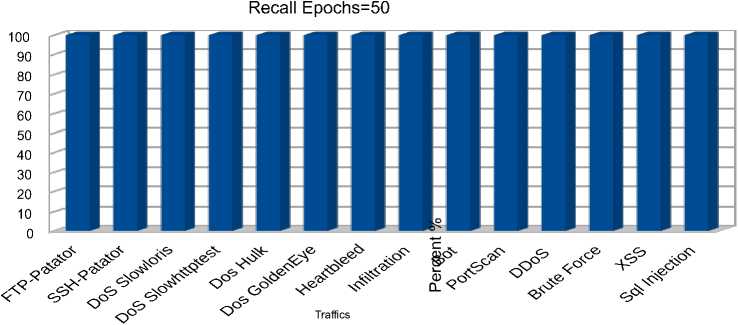
b) Recall metric for 50 epochs

Traffics
c) F1 metric for 50 epochs
Fig. 8. Autoencoder metrics for 50 training epochs
Traffics
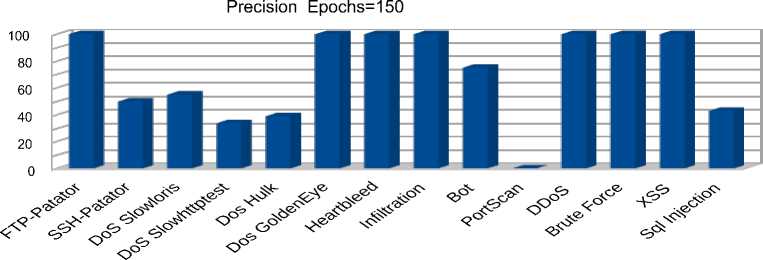
a) Precision metric for 150 epochs
Traffics
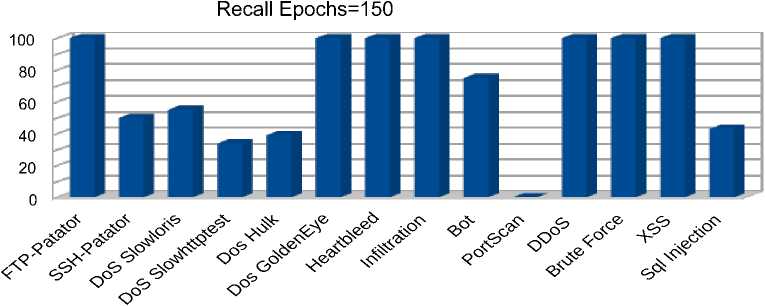
b) Recall metric for 150 epochs

c) F1 metric for 150 epochs
Fig. 9. Autoencoder metrics for 150 training epochs
Traffics
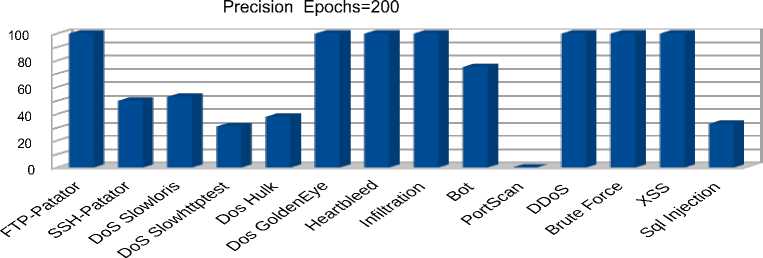
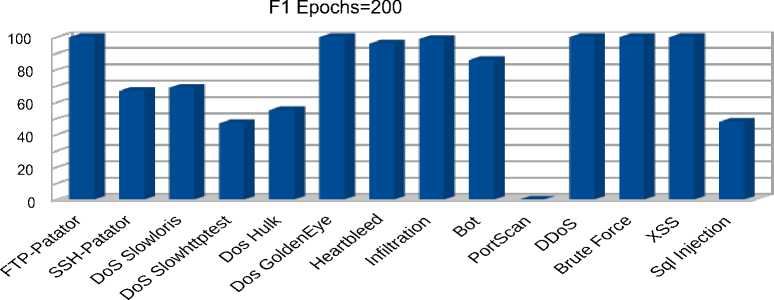
a) Precision metric for 200 epochs
Traffics
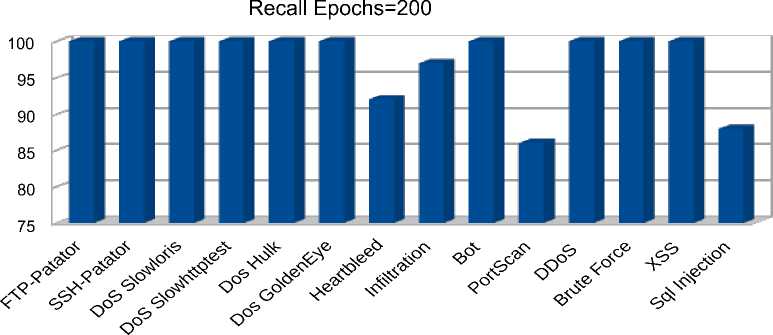
b) Recall metric for 200 epochs
Traffics
c) F1 metric for 200 epochs
Fig. 10. Autoencoder metrics fo 200 training epochs
The obtained results displayed in figures 8 b) –c), 9 a) – c), 10 a) – c) show that increasing the number of autoencoder training epochs from 50 to 200 did not have a significant effect on the quality of predictions. It is also interesting to note that the proposed algorithm allows detecting rare types of attacks with 100 % accuracy, 97 % response, and 99 % F1 for the ‘Infiltration’ traffic and 100% accuracy, 92 % response, and 98 % F1 for the ‘Heartbleed’ traffic. Among the ‘Denial of Service’ attacks, the best predictions were obtained for the distributed ‘DDoS’ attack with 100 % accuracy, 99% response, and 99% F1. The model also showed high performance in detecting botnet attacks with 75 % accuracy, 99 % response, and 85 % F1. Among web attacks, the model showed 100 percent performance for all types of attacks except for "Sql injection", for which 30% accuracy, 87 % recall, and 45 % F1 were observed. The lowest results were obtained for "PortScan" traffic with zero accuracy and F1 percentages. This result is explained by the fact that the distribution of reconstruction error for the "Portscan" class is completely covered by the distribution of reconstruction error for normal traffic. The area under ROC curve is the most significant indicator of the model’s performance in the case of a strong imbalance between classes, as in this case. The obtained values for this metric are depicted in table 2 fully correlate with the previous results and show which types of attacks or traffic the model copes with detecting better.
Table 2. Area under ROC curve.
|
Type of Attack |
Area under ROC curve (AuC) |
|
Botnet |
0.8 |
|
DDoS |
1.00 |
|
DoS Golden Eye |
1.00 |
|
DoS Hulk |
0.69 |
|
DoS Slowhttptest |
0.66 |
|
DosSlowloris |
0.76 |
|
FTP Patator |
1.00 |
|
Heartbleed |
1.00 |
|
Infiltration |
1.00 |
|
Portscan |
0.50 |
|
SSH Patator |
0.75 |
|
Brute force |
1.00 |
|
SQL Injection |
0.67 |
|
XSS |
1.00 |
Variational Auto Encoder Results. As can be seen from the results of testing a simple autoencoder, the proposed model performed well with the primary detection of all types of critical attacks except for the "PortScan" traffic, that is an essential part of network maintenance but can be used by attackers to find open doors. In this section, we present the results of using the variational model for the primary detection of attacks and track the influence of various distribution functions of the parameterization coefficient ϵ on performance metrics. Particular attention will be paid to the t-distribution and the study of the influence of the degree of freedom of this distribution and the number of training epochs on the quality of forecasting "PortScan" traffic. The t-distribution is well known in statistics and serves as a generalization of the normal distribution when the variance with the formula is not known in advance
-п+1
-('<
'(^
^(t) I---- г (n\
W - П- Г (2 )
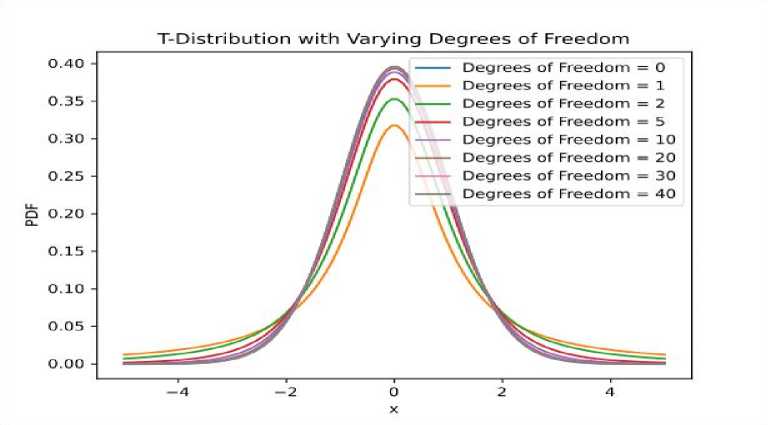
Fig. 11. Probability density of Student's distribution .
The test scenario for the variational autoencoder was conducted for the training epoch values of 50, 100, and 150 and the degrees of freedom values of 10, 20, 30, 40, and 50. The obtained experimental results show a significant improvement in the model’s performance in detecting ‘PortScan’ traffic. In Fig. 12a-d), the area under the ROC curve ranges from 80 % to 80.5 %, which is 30% higher than the result obtained from the simple autoencoder.
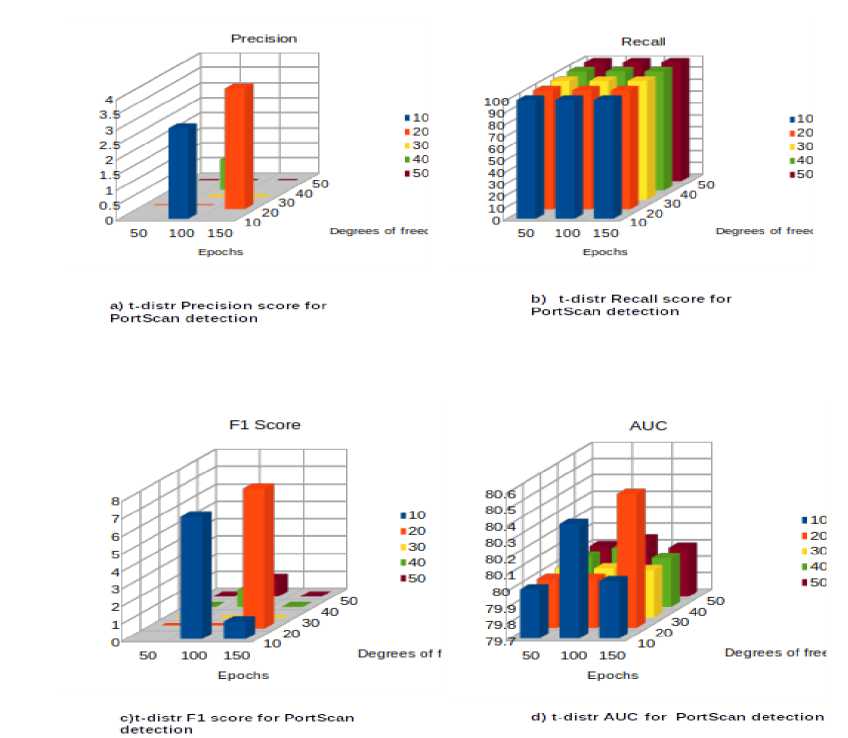
Fig. 12. Performance metrics of the variational model for detecting " PortScan " traffic
Conclusion
Primary detection of increasingly sophisticated new types of attacks is a topical issue in the field of computer security. The ability of the architecture of autoencoder families based on deep neural networks to reconstruct large-scale datasets with minimal deviations prompted us to consider these models as objects of our research. Thus, in the course of this work, an algorithm for detecting zero-day attacks based on an auto encoder and a variational auto encoder consisting of 17 layers was proposed. The studies showed: a direct correlation between the indicators of various metrics (accuracy, response, F1-measure, ROC curve and area under the curve) and the degree of overlap of the distribution densities of the reconstruction error of normal traffic and detected malicious traffic; the ability of the auto encoder to cope with the primary detection of all types of attacks, with the exception of "PortScan" traffic due to the first point above. The achieved indicators for all metrics in their totality exceed the results of similar studies; the use of parametric distribution functions (Student's t-distribution in this particular study) for the parameterization coefficient ϵ of the variational model allows us to more clearly separate the distribution densities of the reconstruction error of normal traffic and "PortScan" traffic.
Comparisons of the obtained results with the results of a similar work [2], in which autoencoders based on deep neural networks were used, are given in Table 2.
Table 3. Comparison of the obtained results
|
few-shot learning model |
Proposed auto encoder |
|
|
FTP |
Accuracy: 95% Precision: - Recall: 99% |
Accuracy: 99.99% Precision: 100% Recall: 99.99% |
|
SSH |
Accuracy: 99% Precision: - Recall: 100% |
Accuracy: 91.82% Precision: 50.28% Recall: 99.97% |
|
PortScan |
Accuracy: 99% Precision: Recall: 99% |
Accuracy: 60% Precision:0 Recall: 85% |
|
DoS |
Accuracy: 98% Precision: Recall: 99% |
Accuracy: 99.99% Precision: 99.98% Recall: 99.99% |
|
DDoS |
Accuracy: 94% Precision: - Recall: 96% |
Accuracy: 99.99% Precision: 100% Recall: 99.99% |
|
Bot |
Accuracy: 90.6% Precision: -Recall: 93.8% |
Accuracy: 98.46% Precision: 74.85% Recall: 99.93% |
Analysis of these results shows that the proposed model is inferior only in detecting "PortScan" traffic, and in other cases it surpasses similar models.
