An Analysis of Fuzzy Approaches for COCOMO II

Author: Ashita Malik, Varun Pandey, Anupama Kaushik
Journal: International Journal of Intelligent Systems and Applications(IJISA) @ijisa
Article in issue: 5 vol.5, 2013.
Free access
Software cost estimation is one of the most challenging task in project management. However, the process of estimation is uncertain in nature as it largely depends upon some attributes that are quite unclear during the early stages of development. In this paper a soft computing technique is explored to overcome the uncertainty and imprecision in estimation. The main objective of this research is to investigate the role of fuzzy logic technique in improving the effort estimation accuracy using COCOMO II by characterizing inputs parameters using Gaussian, trapezoidal and triangular membership functions and comparing their results. NASA (93) dataset is used in the evaluation of the proposed Fuzzy Logic COCOMO II. After analyzing the results it had been found that effort estimation using Gaussian member function yields better results for maximum criterions when compared with the other methods.
Software Cost Estimation, Soft Computing, COCOMO, COCOMO II Fuzzy Logic
Short address: https://sciup.org/15010422
IDR: 15010422
Text of the scientific article An Analysis of Fuzzy Approaches for COCOMO II
Published Online April 2013 in MECS
Software development has become an essential investment for many organizations [1]. Software engineering practitioners have become more and more concerned about accurately predicting the cost and quality of software product under development.
Software engineering cost (and schedule) models and estimation techniques are used for a number of purposes. These include:
Budgeting : The primary but not the only important use. Accuracy of the overall estimate is the most desired capability.
Trade-off and risk analysis : An important additional capability is to illuminate the cost and schedule sensitivities of software project decisions (scoping, staffing, tools, reuse, etc.).
Project planning and control : An important additional capability is to provide cost and schedule breakdowns by component, stage and activity.
Software improvement investment analysis : An important additional capability is to estimate the costs as well as the benefits of such strategies as tools, reuse, and process maturity.
Software developers always interest to know the time estimation of software tasks. It could be done by comparing similar tasks that have already been developed. Although, estimating task has an uncertain nature, as it depends on several and usually not clear factors and it is hard to be modelled mathematically. Software schedule and cost estimation supports the planning and tracking of software projects. Effectively controlling the expensive investment of software development is of high importance. The reliable and accurate cost estimation in software engineering is an ongoing process due to which it allows for considerable financial and strategic planning [2].The software estimation process includes estimating the size of the software product to be produced, estimating the effort required, developing preliminary project schedules, and finally, estimating overall cost of the project [3]. However, the process estimation is uncertain in nature as it largely depends upon some attributes that are quite unclear during the early stages of development, but it needs to be carried out as huge investments are involved in developing the software [4].
Software effort estimation models are divided into two main categories: Algorithmic models & Non-Algorithmic models.
Algorithmic models: Some of the famous algorithmic models are: Boehm’s COCOMO’81, COCOMO II [5], Albrecht’s Function Point [6] and Putnam’s SLIM [7]. All of them require inputs, accurate estimate of specific attributes, such as Lines of Code (LOC), number of user screen, interfaces and complexity and other cost drivers like skill set, self assessment etc., which are not easy to acquire during the early stage of software development. As most of the software development effort estimates are based on the prediction of size of the system to be developed but this is a difficult task as the estimates obtained at the early stages of development are more likely to be inaccurate because not much information of the project to be developed is available at that time. So the correctness of algorithmic model largely depends upon the information that is available during the preliminary stages of development. The inability of algorithmic model to handle categorical data (which are specified by a range of values) and most importantly lack of reasoning capabilities contributed to the number of studies exploring non-algorithmic methods which are based on soft computing.
Non-algorithmic models: In 1990’s non-algorithmic models was born and have been proposed to project cost estimation. Software researchers have turned their attention to new approaches that are based on soft computing such as artificial neural networks, fuzzy logic models and genetic algorithms. Neural networks are able to generalize from trained data set. A set of training data, a specific learning algorithm makes a set of rules that fit the data and fits previously unseen data in a rational manner. Some of early works show that neural networks are highly applicable to cost estimation. Fuzzy logic offers a powerful linguistic representation that able to represent imprecision in inputs and outputs, while providing a more knowledge based approach to model building. Research shows that fuzzy logic model achieved good performance, being outperformed in terms of accuracy only by neural network model with considerably more input variables.
Hodgkinson and Garratt represented that estimation by expert judgment was better than all regression based models [2]. A Neuro-fuzzy approach [8], was introduced into cost estimation which take the linguistic attributes of a fuzzy system and combine them with the learning and modelling attributes of a neural network to produce transparent, adaptive systems. As is mentioned above, Fuzzy Logic has been proposed to some models to overcome the uncertainty problem. However, there is still much uncertainty as to what prediction technique appropriate to which type of prediction problem. Burgess et al. applied genetic programming to carry software effort estimation [9].
Thus it can be summarized from the previous research that all soft computing based techniques lack in one aspect or the other and still there is lot of uncertainty in deciding that what soft computing based prediction technique should be applied to which prediction problem. In this paper a fuzzy logic based COCOMO II model is proposed to so as to overcome the problem of imprecision and uncertainty. Because of the importance of COCOMO Model and fuzzy logic system in our research we provide a brief overview on them in this study. Section 2 describes COCOMO framework, section 3 gives an introduction on COCOMO II model. Section 4 is a brief on Fuzzy Logic, section 5 is our proposed approach, section 6 discusses experimental results and section 7 is the conclusion.
-
II. COCOMO Framework
-
2.1 Basic COCOMO Model
COCOMO (Constructive Cost Model), is the best known algorithmic cost model published by Barry
Boehm in 1981 [5]. It was developed from the analysis of sixty three software projects. The COCOMO model is a hierarchy of software cost estimation models and they are:
Basic COCOMO computes software development effort (and cost) as a function of program size. Program size is expressed in estimated thousands of source lines of code (SLOC). COCOMO [10] applies to three classes of software projects:
Organic projects - "small" teams with "good"experience working with "less than rigid" requirements
Semi-detached projects - "medium" teams with mixed experience working with a mix of rigid and less than rigid requirements
Embedded projects - developed within a set of "tight" constraints. It is also combination of organic and semi-detached projects (hardware, software, operational, etc.
The basic COCOMO equations take the form
Effort Applied,
E = a × (SLOC) b [man-months] (1)
Development Time,
D = c × (Effort Applied)d [months] (2)
People required, р _ Effort Applied
Development Time
[count]
where, SLOC is the estimated number of delivered lines (expressed in thousands ) of code for project, The coefficients a, b, c and d are dependent upon the three modes of development of projects..
-
2.2 Intermediate COCOMO Model
The Basic COCOMO does not take account of the software development environment. Boehm introduced a set of 15 cost drivers in the Intermediate COCOMO that adds accuracy to the Basic COCOMO. The cost drivers are grouped into four categories:
-
1. Product attributes
-
(a) Required software reliability (RELY)
-
(b) Database size (DATA)
-
(c) Product complexity (CPLX)
-
2. Computer attributes
-
(a) Execution time constraint (TIME)
-
(b) Main storage constraint (STOR)
-
(c) Virtual machine volatility (VIRT)
-
(d) Computer turnaround time (TURN)
-
3. Personnel attributes
-
(a) Analyst capability (ACAP)
-
(b) Application experience (AEXP)
-
(c) Programmer capability (PCAP)
-
(d) Virtual machine experience (VEXP)
-
(e) Programming language experience (LEXP)
-
4. Project attributes
-
(a) Modern programming practices (MODP)
-
(b) Use of software tools (TOOLS)
-
(c) Required development schedule (SCED)
-
2.3 Detailed COCOMO Model
The Cost drivers have up to six levels of rating: Very Low, Low, Nominal, High, Very High, and Extra High. Each rating has a corresponding real number known as effort multiplier, based upon the factor and the degree to which the factor can influence productivity. The estimated effort in person-months (PM) for the intermediate COCOMO is given as:
Effort = a×[SIZE]b × i=1 Π15 EM i (4)
In equation (4) the coefficient “a” is known as productivity coefficient and the coefficient “b” is the scale factor. They are based on the different development modes of the project. The contribution of effort multipliers corresponding to the respective cost drivers is introduced in the effort estimation formula by multiplying them together. The numerical value of the ith cost driver is EM i (Effort Multiplier).
Detailed COCOMO incorporates all characteristics of the intermediate version with an assessment of the cost driver's impact on each step (analysis, design, etc.) of the software engineering process. The detailed model uses different efforts multipliers for each cost drivers attribute. These Phase Sensitive effort multipliers are each to determine the amount of effort required to complete each phase. In detailed COCOMO, the effort is calculated as function of program size and a set of cost drivers given according to each phase of software life cycle.
The Four phases of detailed COCOMO are:-
-
• Plan and requirement.
-
• System design.
-
• Detailed design.
-
• Module code and test.
Though it was one of the stable models of its time but it had number of drawbacks like it strictly gears toward traditional development life cycle model; i.e. custom software is build from precisely stated specifications and an assumption over here is that software requirements are already defined and stable; which is not always true. It relies on LOC; and measuring LOC at very early stages of development leads to uncertainty and results in inaccurate estimation. Here success depends largely on using historical data which isn’t always available. It does not cope up with the current development environment like RAD and 4GL etc., Thereafter COCOMO II was published that overcomes most of the drawbacks of COCOMO.
-
III. COCOMO II Model
The COCOMO II model is a regression based software cost estimation model and thought to be the most cited, best known and the most plausible of all traditional cost prediction models.
COCOMO II comprises of the following models [11]:-
Application Composition Model — This model assumes that systems are created from reusable components, scripting or database programming. This model involves prototyping efforts to resolve potential high-risk issues such as user interfaces, software/system interaction, performance, or technology maturity. It is used during the early stages of development when prototype of user interface is available. Software size estimates are based on application points / object points, and a simple size/productivity formula is used to estimate the effort required. Object points include screens, user interface, reports, and components that are likely to be used.
Early Design Model -To get rough estimates of a project's cost and duration before have determined its entire architecture. It uses a small set of new cost drivers and new estimating equations. It uses Unadjusted Function Points (UFP) as the measure of size.
Post Architecture Model: Once the system architecture has been designed, a more accurate estimate of the software size can be made. – It involves the actual development and maintenance of a software product. This model proceeds most cost effectively if a software life-cycle architecture has been developed; validated with respect to the system’s mission, concept of operation, and risk; and established as the framework for the product. One could use function points or LOC as size estimates with this model. COCOMO II describes 17 cost drivers that are used in the Post Architecture model. The cost drivers for COCOMO II are rated on a scale from Very Low to Extra High. COCOMO II post architecture model is given as:
PM = A x [size]1,01+Х^1№; x П^^Л^ (5)
where, PM is the effort expressed in person months, A is a multiplicative constant, size is the projected size of the software project expressed in thousands of lines of code KLOC, EM i ( i =1,2 17) are effort multipliers and SF i ( i =1,2 5) are exponent scale factors. Scale factor is a particular characteristic of the software development that has an exponential effect of increasing or decreasing the amount of development effort and they are Precedentness, Development flexibility, Architecture/Risk resolution, Team cohesion and Process maturity. The seventeen effort multipliers are grouped into four categories and they are Product, Platform, Personnel and Product. Their product is used to adjust the nominal effort. Table I and Table II lists the COCOMO II cost drivers and scale factors.
Table 1: COCOMO II cost drivers
|
Cost Drivers |
Range |
|
Reliability required (RELY) |
0.82-1.26 |
|
Database size (DATA) |
0.90-1.28 |
|
Product complexity (CPLX) |
0.73-1.74 |
|
Required reusability (RUSE) |
0.95-1.25 |
|
Documentation (DOCU) |
0.81-1.23 |
|
Execution time constraint (TIME) |
1.00-1.63 |
|
Main storage constraint (STOR) |
1.00-1.46 |
|
Platform volatility (PVOL) |
0.87-1.30 |
|
Analyst capability (ACAP)+ |
1.42-0.72 |
|
Programmers capability (PCAP) |
1.34-0.76 |
|
Personnel continuity (PCON) |
1.29-0.81 |
|
Analyst experience (AEXP) |
1.22-0.81 |
|
Programmer experience (PEXP) |
1.19-0.85 |
|
Language & tool experience (LTEX) |
1.20-0.84 |
|
Use of software tool (TOOL) |
1.17-0.78 |
|
Multi site development SITE) |
1.22-0.80 |
|
Schedule (SCED) |
1.43-1.00 |
Table 2: COCOMO II Scale Factors
|
Scale factor |
Range |
|
Precedentedness (PREC) |
0.00-6.2O |
|
Development flexibility (FLEX) |
0.00-5.07 |
|
Architecture/risk resolution (RESL) |
0.00-7.07 |
|
Team cohesion (TEAM) |
0.00-5.48 |
|
Process maturity (PMAT) |
0.00-7.80 |
-
IV. Fuzzy Logic
Fuzzy Logic is a methodology to solve problems which are too complex to be understood quantitatively. It is based on fuzzy set theory and introduced in 1965 by Prof. Zadeh in the paper fuzzy sets [13].
The fuzzy theory provides a mechanism for representing linguistic constructs such as “many”, “low”, “medium,” “often,” “few.” In general, the fuzzy logic provides an inference structure that enables appropriate human reasoning capabilities. On the contrary, the traditional binary set theory describes crisp events, events that either do or do not occur. It uses probability theory to explain if an event will occur measuring the chance with which a given event is expected to occur .
Fuzzy Systems: Fuzzy systems are knowledge based or rule based system. The heart of fuzzy systems is a knowledge base consisting of the so called Fuzzy If-Then rules in which some words are characterized by continuous member functions . The popular fuzzy logic systems can be categorized into three types: pure fuzzy logic systems, Takagi and Sugeno’s fuzzy system and fuzzy logic system with fuzzifier and defuzzifier. Since most of the engineering applications produce crisp data as input and expects crisp data as output, the last type is the most widely used one fuzzy logic system with fuzzifier and defuzzifier. It was first proposed by Mamdani. It has been successfully applied to a variety of industrial processes and consumer products.
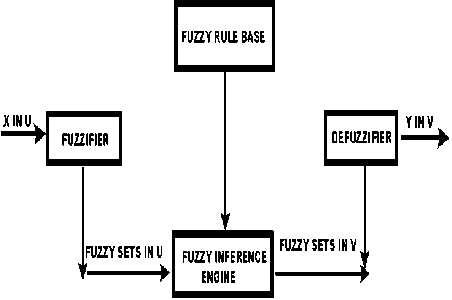
It consists of four main components shown in Figure 1:
Fuzzifier - It converts the crisp input into a fuzzy set. Membership Functions are used to graphically describe a situation.
Fuzzy Rule Base - It uses if-then rules.
Fuzzy Inference Engine - A collection of if -then rules stored in fuzzy rule base is known as inference engine. It performs two operations i.e. aggregation and composition.
Defuzzification - It is the process that refers to the translation of fuzzy output into crisp output.
-
V. Proposed System
Inaccurate software cost estimation has plagued software projects for decades. Poor estimates have not only led projects to exceed budget and schedule but also, in many cases, be terminated entirely[12].The ability to accurately estimate software development time, cost, and manpower, changes as newer methodologies replace old ones. Therefore, an accurate software cost estimation model is highly required in software project management.
The Fuzzy Logic COCOMO II: The new FL-COCOMO II is based on the COCOMO II and FL. The COCOMO II includes a set of input software attributes: 17 EMs, 5 SFs, 1 SS and one output, Effort estimation.
The architecture of the FL-COCOMO II is shown in Figure 2.
All these input variables are changed to fuzzy variables using fuzzy sets for each linguistic value such as very low, low, nominal, high, very high and extra high. as applicable to each cost driver and scale factor. For each cost driver a separate fuzzy inference system is designed. Rules are developed as cost driver in the antecedent part and corresponding effort multiplier in the consequent part. The defuzzified value for each of the effort multiplier is obtained from individual fuzzy inference systems.
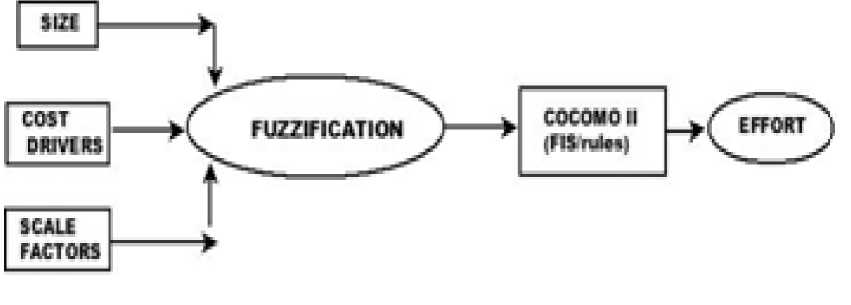
Fig. 2: Architecture of proposed model
Gaussian Membership Function (GMF), Triangular Membership Function (TMF) and Trapezoidal membership Function (Trapmf) are used for the analysis and their corresponding results are compared.
Fuzzy rule definition: Fuzzy rules for the fuzzy logic-COCOMO-II are defined through linguistic variables in fuzzification process. These rules are based on the connective “AND” between the input variables. Some of the examples of rules framed are:-
If (RELY is VL) Then (EFFORT is VL)
If (RELY is L) THEN (EFFORT is L)
If (PREC is VL) then (Effort is XH
If (PMAT is VH) then (Effort is L)
The following rules are used in Figures 3,4 and 5:-
If (ACAP is Very Low) then (EFFORT is Increased Significantly)
If (ACAP is Low) then (EFFORT is Increased)
If (ACAP is Nominal) then (EFFORT is Unchanged)
If (ACAP is High) then (EFFORT is Decreased)
If (ACAP is Very High) then (EFFORT is Decreased Significantly)
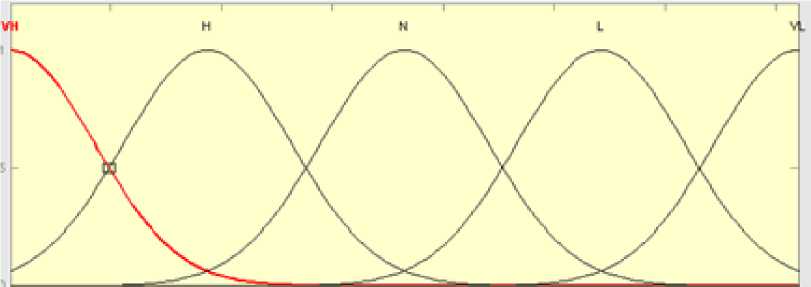
Fig. 3: Fuzzification of ACAP cost driver using Gaussian membership function
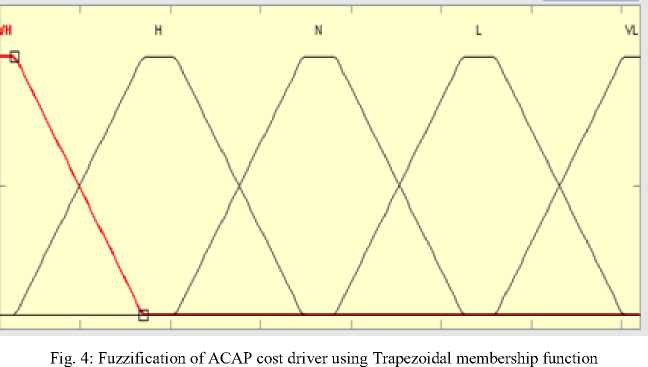
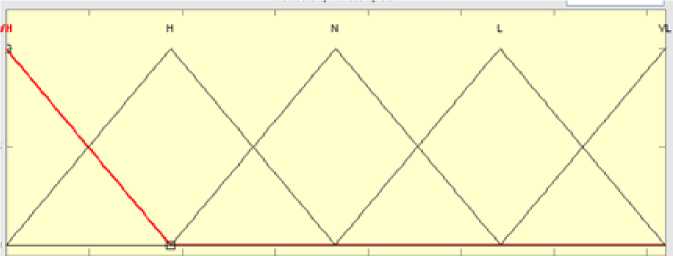
Fig. 5: Fuzzification of ACAP cost driver using Triangular membership function
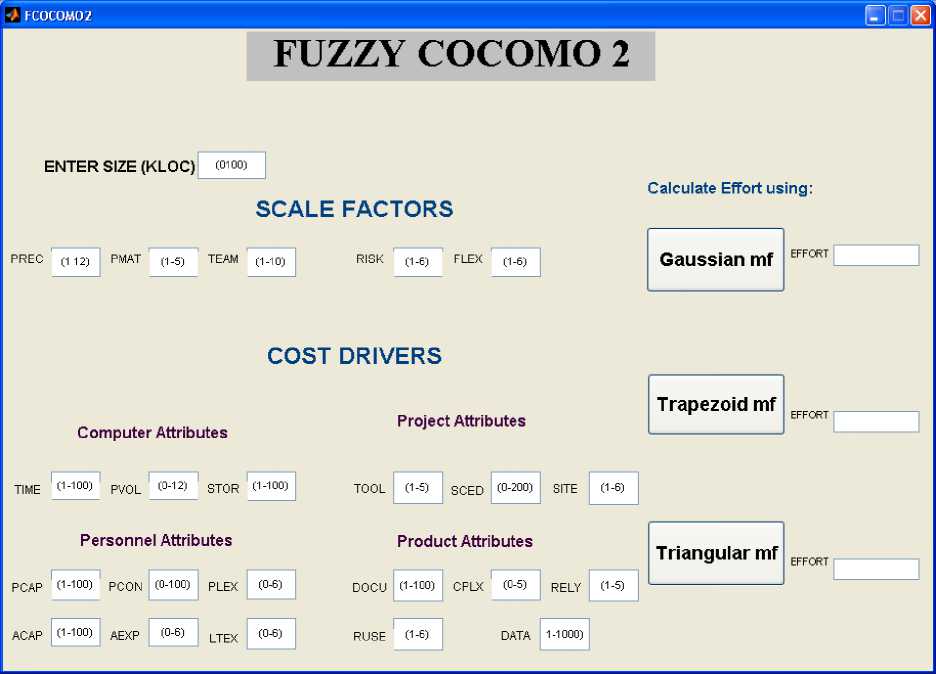
Fig. 6: Interface used for Effort Evaluation
Figure 6 shows the graphical user interface (GUI) developed for our model Fuzzy COCOMO II, which eases our work. We can directly enter the values and get the corresponding effort.
-
VI. Experimental Results
The data set NASA 93, used in the present study comes from PROMISE Software Engineering Repository data set [14] made publicly available for research purpose. It consists of 93 NASA projects from different centres for various years. It consists of 26 attributes: 17 standard COCOMO attributes and 5 scaling factors in the range Very Low to Extra High; one lines of code measure (KLOC), the actual effort in person months, total defects and last being development time in months. The estimated efforts using COCOMO II, Triangular MF, Trapezoidal MF and Gaussian MF obtained are tabulated and compared. They are shown in Table III.
The evaluation consists in comparing the accuracy of the estimated effort with the actual effort. There are many evaluation criteria for software effort estimation, among them we applied the most frequent one which is Magnitude of Relative Error (MRE) and is defined as equation (6).
U с tn a I Е ff о rt - EstImate d Ef fо r t|
MRE= x 100
Actual Effort
The software development effort obtained when using conventional COCOMO II and fuzzy membership functions were compared. After analysing the results obtained by means of applying triangular, Trapezoidal and Gaussian MF’s, it is observed that the effort estimated by fuzzifying the size, scale factors and all the 17 cost drivers using Gaussian MF is yielding better estimate.
Table 3: Estimated Effort Using Different MF’s
|
P.ID |
Actual Effort |
Effort by Trapezoidal MF |
Effort by Triangular MF |
Effort by Gaussian MF |
Effort by COCOMOII |
|
1 |
117.6 |
166.68 |
165.25 |
125.90 |
149.6 |
|
2 |
117.6 |
98.87 |
99.39 |
114.13 |
144.9 |
|
3 |
31.2 |
42.56 |
42.79 |
36.27 |
42.9 |
|
4 |
36 |
48.10 |
48.36 |
36.64 |
40.1 |
|
5 |
25.2 |
39.79 |
40.01 |
37.38 |
41.5 |
|
6 |
8.4 |
0.12 |
3.65 |
5.24 |
18.4 |
|
7 |
10.8 |
3.63 |
3.65 |
13.81 |
19.3 |
|
8 |
352.8 |
444.90 |
447.09 |
330.60 |
369.9 |
|
9 |
72 |
29.21 |
60.83 |
64.44 |
81.9 |
|
10 |
72 |
45.32 |
45.71 |
61.45 |
79.8 |
COCOMO II
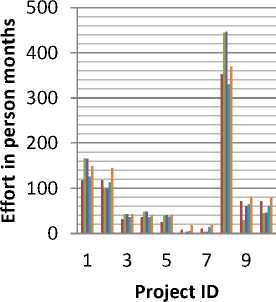
Fig. 7: Graphical representation of Effort Estimation
Figure 7 shows the bar graph representing comparative analysis of the actual effort with that of the effort estimated using COCOMO II, trapezoidal MF, triangular MF, Gaussian MF. Effort in person moths is scaled along y- axis. Actual effort, COCOMO II effort ,effort estimated using Gaussian MF, Triangular MF, Trapezoidal MF, were represented for each sample project which were taken along x- axis.
The magnitude of relative error (MRE) was calculated using equation (7). For example, the MRE calculated for project ID (P.ID) 4for COCOMO II, triangular, Trapezoidal and Gaussian MF is 11.38, 34.331, 33.66 and 1.77 respectively. This clearly shows that there is a decrement in the relative error, so the proposed model is more suitable for effort estimation.
-
VII. Conclusion
Referring to Table III, effort estimation using Gaussian member function yields better results for maximum criterions when compared with the other methods. It has been found that Gaussian function is performing better than trapezoidal function and triangular function, as it demonstrates a smoother transition in its intervals, and the achieved results were closer to the actual effort (refer table III and Figure 7).Thus it is concluded that the new approach using Gaussian MF is better than Triangular MF (triangular membership function), Trapezoidal MF and COCOMO II. By suitably adjusting the values of the parameters in FIS we can optimize the estimated effort. Future work includes Newer techniques like Type-2 fuzzy can also be applied for more accurate predictions of software.
References An Analysis of Fuzzy Approaches for COCOMO II
- S.G. MacDonell, and A. R. Gray, “A comparison of techniques for software development effort prediction”, International Conference on Neural Information Processing and Intelligent Control Systems, NewZealand, 1997, pp. 1-4.
- A.C. Hodgkinson, and P.W. Garratt, “ A neuro fuzzy cost estimator”, Proceedings of Third International Conference on Software Engineering and Applications, 1999, pp. 401-406.
- Mockus A., Weiss D.M. and Zhang P. “Understanding and Predicting Efforts in Software Projects”, IEEE Proceedings of 25th International Conference on Software Engineering (ICSE’03), pp. 274-84.
- I. Somerville, Software Engineering, 6th ed., Addison– Wesley Publishers Limited, 2001.
- B. W. Boehm, Software Engineering Economics, Englewoods Cliffs, NJ,Prentice-Hall, 1981.
- B.Boehm, C. Abts, S.Chulani,”Software Development Cost Estimation Approaches: A Survey,” University of Southern California Centre for Software Engineering, Technical Report, USC-CSE-2000-505, 2000.
- L.H. Putnam, “A general empirical solution to the macro software sizing and estimating problem”, IEEE transactions on Software Engineering, 1978, Vol. 2, pp. 345- 361.
- Hodgkinson, A.C. and P.W. Garratt, “ A neuro fuzzy cost estimator, ” Proceedings of the 3rd International Conference on Software Engineering and Applications,(SEA’99), pp.401-406.
- Burgess C.J. and Lefley M., “Can genetic programming improve software effort estimation? A comparative evaluation”, Information and Software Technology, 2001, Vol. 43, No. 14, pp. 863 -873.
- A. Idri, A. Abrian, and L. Kjiri, “COCOMO Cost Model using Fuzzy Logic”, International Conference on Fuzzy Theory and Technology Atlantic, New Jersey, 2000.
- B. Boehm, B. Clark, E. Horwitz, R. Madachy, C. Abts, S.Chulani, A.W.Brown and B. Steece, “COCOMO II model definition manual”, Universityof South California Center for Software Engineering, 2000.
- M. Jorgenson and D.I.K. Sjoberg, “The impact of customer expectation on software development effort estimates”, International Journal of Project Management,2004, Vol. 22, No. 4, pp. 317-325
- Zadeh. L. A., Fuzzy Sets, Information and Control, 1965, Vol. 8, pp. 338-353.
- www.promisedata.org
