An Analytic Approach for Calculating Frame Erasue Rate in Cellular GSM Networks

Author: Ahmed M. Alaa, Hazem Tawfik
Journal: International Journal of Information Technology and Computer Science(IJITCS) @ijitcs
Article in issue: 12 Vol. 5, 2013.
Free access
The Quality of Service (QoS) of a GSM system is quantified in terms of Bit Error Rate (BER) and Frame Erasure Rate (FER) observed by the user. The problem of obtaining analytical expressions for BER and FER in a fading channel with multiple cochannel interferers (CCI) is an extremely complex mathematical problem. The reason for this complexity is that the involvement of several GSM physical layer modules is required to obtain an expression for the probability of bit error. Besides, one needs to obtain the statistical properties of faded cochannel interferers in order to obtain the raw BER of GMSK modulation. Thus, error rate metrics are usually obtained by simulating the GSM physical layer rather than treating the problem analytically. A reliable interface between system and link level models can be obtained by evaluating the BER and FER in terms of the Signal-to-Interference Ratio (SIR) analytically, instead of the pre-defined statistical mapping data usually used in literature. In this work, bounds on the uplink BER and FER are obtained for the GSM physical layer assuming a CCI limited system where both the desired and interference signals are subjected to Rayleigh fading. The analysis considers GMSK modulation, convolutional coding and Frequency Hopping.
Component, Bit Error Rate (BER), Cochannel Interference (CCI), Convolutional Coding, Frame Erasure Rate (FER), GMSK, GSM
Short address: https://sciup.org/15011999
IDR: 15011999
Text of the scientific article An Analytic Approach for Calculating Frame Erasue Rate in Cellular GSM Networks
Published Online November 2013 in MECS
The problem of designing a GSM network that satisfies the Quality of Service (QoS) requirements usually requires the inclusion of both system and link level models. The system level model is used to obtain statistics for the Signal-to-Interference Ratio (SIR), while the link level model is used to map these SIR values to corresponding BER and FER values. The QoS requirements are defined in terms of the FER; it is required that the FER be kept below 2% for 90% of the service area. Mapping system level to link level data requires the usage of statistical field measurements or simulations for the complete GSM receiver chain. However, these statistical data differ for different system loads, number of hopping frequencies and number of interferers. Thus, it is more reliable to obtain analytical expressions for BER and FER that are functions of all system parameters. To the extent of the authors’ knowledge, the problem of obtaining the error rates analytically for a faded and CCI limited channel with the whole GSM physical layer included was seldom encountered in literature. The reason for this is the great complexity of the problem; in order to obtain the exact probability of error for the system’s link level, all GSM physical layer modules that impact the error rate must be included. These modules include; convolutional decoder, equalizer and GMSK detector. In [1], a bound was developed on the error rate observed at the output of the GSM convolutional decoder, but without considering CCI statistics or GMSK bit error rate. The statistical characterization of the CCI limited and faded channel differs from the conventional noise limited (AWGN) faded channel. Thus, the proposed analysis must start from inception as one can’t directly make use of the GMSK error probability expressions based on Gaussian noise found in literature. Previous research on GSM spectral capacity evaluation [2], capacity gain due random Frequency Hopping [3] and system-link level interfacing [4] [5] fully relied on statistical mapping data obtained from either field measurements or physical layer simulations. In this work, novel analytical upper bounds for the BER and FER are pursued for the sake of generic system-link level interfacing. The derived expression would incorporate various system parameters such as: number of hopping frequencies, system load, convolutional code parameters, and SIR ratio. The rest of the paper is organized as follows: section II presents the problem model, objectives and assumptions, in addition to the physical layer model. Section III includes a derivation of the approximate BER for the GMSK modulation in a CCI limited and Rayleigh faded channel based on an equivalent FSK (Frequency Shift Keying) constellation diagram. The effect of FH (Frequency Hopping) is considered and the BER is obtained as a function of the number of hopping frequencies and system load. Section IV shows the upper bound of the GSM convolutional encoder error probability. This upper bound is then used to obtain the probability that any of the class IA bits in the GSM speech frame is erroneous.
-
II. System Model
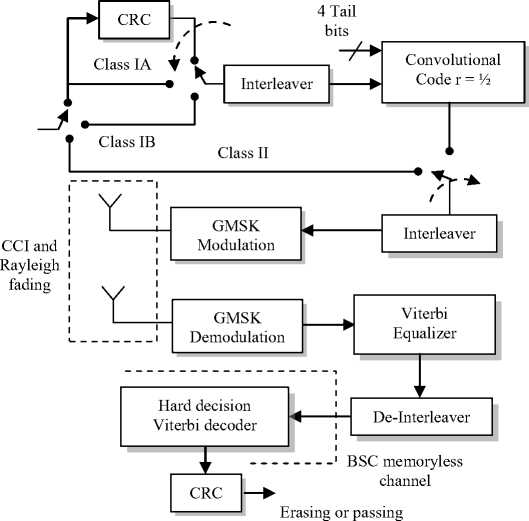
The GSM cellular network considered in this analysis is a Cochannel Interference (CCI) limited system. We only consider the first tier of interferers. The hexagonal cell radius in the cellular system is R . The distance between the home cell and the reuse cells is D . Without loss of generality, it is assumed that the Mobile Stations (MS) have fixed locations; the home user is located at the cell border at a distance R from the Base station (BTS). The interferers are located at the center of cocells with a distance of D . Assume that the number of interferers is n and the maximum number of interferers is N = 6. The physical layer of the GSM system consists of several processing and coding modules. One has to focus on the modules that impact the system’s error rate. The output of the speech encoder is classified into three classes of bits [6]. The class IA bits are 50 bits and are the most significant bits and are protected via CRC parity bits. The class IB bits are 132 bits and are applied with the class IA bits to rate ½ convolutional coding. The class II bits are the least significant bits and are transmitted without coding. We track the error rate on the full rate speech channel (TCH). Figure 1 depicts the physical layer chain considered in the analysis.
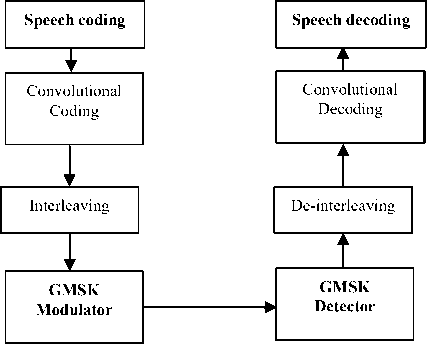
Fig. 1: GSM physical layer overview
S | h | 2
I =∑ i | h i | 2
where |h| is the channel gain amplitude multiplied by the signal/interferer power, this amplitude follows a Rayleigh distribution with a parameter σ = mean power of the received signal. The mean power of the recei v ed signal is proportional to the path loss; S α R-γ and I α n D-γ where γ is the path loss exponent . The distribution of |h| is given by:
h 2
h - 2 ph ( h ) = 2 e 2 σ
σ h≥ 0
The mean power received is given by P mean = 2σ2, by applying transformation to the random variable |h| to h2, the channel gain follows a Chi-squared random variable with two degrees of freedom :
p 2 ( x = h 2 ) = e Pmean , x ≥ 0 (3)
P mean
The PDF of the received power for the signal S and each of the n interferers (denoted by J ):
- S
P s ( S ) = 1 - γ eR - γ , S ≥ 0 (4)
- J
P J ( J ) = 1 - γ eD - γ , J ≥ 0 (5)
The PDF of the summation of n interferers that are Chi-squared distributed is obtained by convolving n Chi-squared PDFs:
n
I = ∑ J i (6)
i = 1
-
III. GMSK Bit Error Rate
The first module with the lowest level of abstraction in the physical layer of the GSM system is the GMSK modem. It is required to obtain the probability of error of the modem in a CCI limited channel with Rayleigh faded signals. The probability of error in Minimum Shift Keying (MSK) behaves exactly as conventional Binary Phase Shift Keying (BPSK) [7]. For a CCI limited channel, one cannot employ conventional error probability expressions in the analysis as the encountered additive channel is non-Gaussian. Hence, it is mandatory to start the analysis from inception by characterizing the additive interference statistical properties. The Signal-to-Interference Ratio (SIR) is given by:
The convolution problem presented in (7) is very tedious. By using the central limit theorem for causal functions [8], the summation yields a Gamma distributed random variable.
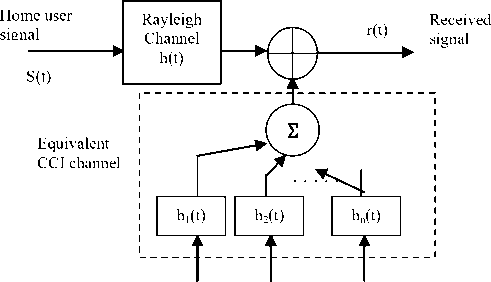
d 1 (t) d 2 (t) d n (t)
Interferer signals
Fig. 2: System Model for CCI limited and Rayleigh faded channel
- y 2
p ( y = I ) = y 2 n - 2 eD - γ .2 y
- y
2 n - 1 - γ
D - n γ Γ ( n )
Based on the constellation depicted in figure 4 and by translating the axes to obtain an equivalent BPSK constellation, the probability of error will be given by:
The PDF of the equivalent CCI additive signal power is given by:
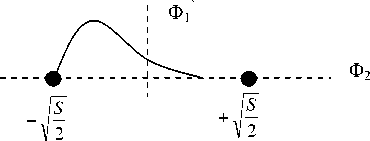
Fig. 4: The equivalent BPSK constellation
n
= p I ( ∑ d i )~ Γ ( n ,2 σ 2)~ Γ ( n , D - γ ) i = 1
∞
Pe=∫
D - n γ Γ ( n )
- y
2 n - 1 - γ
In order to calculate the error probability of the GMSK modem, one can utilize the constellation diagram of the FSK (Frequency Shift Keying) with a Gamma distributed additive interference power. The probability of error is calculated by integrating over the Nakagami distributed additive interference amplitude (as shown in figure 3), and then the average BER is obtained by averaging the error probability over the PDF of the Chi-squared faded signal power. By applying square-root transformation for the CCI signal, one can show that the PDF of the additive interference is given by:
∫ 0 D - n γ Γ ( n )
- y
- γ y 2 n - 1 e D dy
=1 -
=1-
( - 1 D - n γ Γ ( n
D - n γ Γ ( n ) 2
2 I S , D x - γ )| 0 2)
D - n γ Γ ( n )
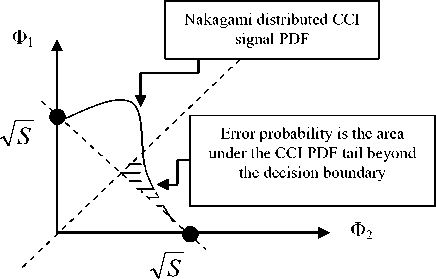
Fig. 3: The MSK constellatio diagram (Φ 1 and Φ 2 are the orthonormal basis functions)
S’ 1
( - 1 D - n γ Γ ( n , S - γ ) + 1 D - n γ Γ ( n ,0))
Γ ( n , S ) Γ ( n , n S )
2 D - γ 2 I
Γ ( n ) Γ ( n )
This error probability expression considers only the additive faded CCI effect, but doesn’t consider the Rayleigh fading of the user’s signal. The channel gain follows a Chi-squared PDF:
P ψ ( ψ ) =
-ψ e SIR
SIR
I ~ Γ ( n , D - γ ) = 1 1 In - 1 eD - γ (9)
D - n γ Γ ( n )
Where SIR = S/I, the BER is given by:
P e = J P elV (. SIR I V ). P № d ^
n ад Г (n, v )
= ----2 eS!Rd y
Jo Г( n) SIR
= Г ( n ) • SIR "
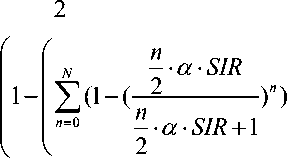
(SIR • (1 + "Ad "T( n ’(n +• n ■ SIR2
- SIR • eSR-Г( n, nV ))C nSIR
= (1 - (—------)n)
-SIR + 1
Unlike the MSK modem, GMSK is subjected to pulse shaping before the FM modulation process. Thus, residual ISI (Inter Symbol Interference) is experienced at the receiver side causing SIR degradation. Let the degraded SIR be equivalent to α.SIR, where 0 < α < 1 is an empirical factor that is dependent on the BT (Bandwidth-symbol duration product). The BT product is equal to 0.3 in GSM, and α is usually found to be 0.8 [8].
In the previous analysis, we assumed a flat fading channel, or equivalently a frequency selective channel with perfect CSI (Channel State Information) at the receiver. The effect of imperfect CSI and imperfect equalization are not considered in the derived error probability expression. By considering the effect of imperfect CSI in a frequency selective channel, one may use the same expression in (13) but with the “de-facto” SIR degrading by another factor that is dependent on the channel estimation and equalization algorithms. This factor can be incorporated with the factor α. Thus, for a flat fading channel, one may set α = 0.8, while in a dispersive channel, a separate analysis must be carried out to obtain the new value of α based on the adopted CSI estimation and equalization algorithms. The receiver designer is required to apply an appropriate equalization, CSI estimation and Gaussian pulse equalization algorithms such that α is as close as possible to 1. A generic expression for the GMSK error probability is given by:
- • a • SIR
P . = (1 - (-5----------) n ) (14)
- • a ■ SIR + 1
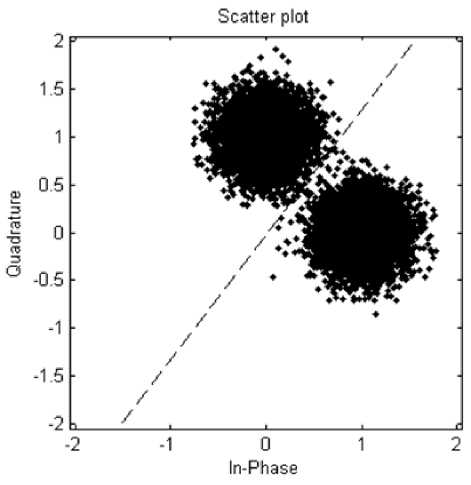
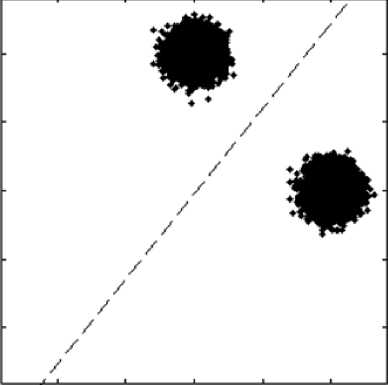
Note that the Signal-to-Interference Ratio included in equation (14) is proportional to the ratio (D/R) γ. The ratio Q = (D/R) is called the quality reuse ratio , and is considered as an important system parameter that controls the amount of CCI and thus affects the system’s QoS. Figures 5 (a), (b) and (c) depict the impact of the quality reuse ratio on the GMSK constellation diagram by plotting the received constellation points after being added to random interference, creating an interference cloud surrounding each signal point. As the quality reuse ratio decreases, the variance of the CCI signal increases and the interference cloud expands. Thus, the probability of an erroneous decision increases. Notice that by plugging n = 0in equation (14), one obtains P e = 0 (no errors encountered when there are no active interferers).
The expression obtained in (14) is a function of the number of cochannel interferers. This number ranges between n = 0 to N = 6 for the first tier of co-cells only. The number of interferers at a given instant is decided by the system load. Another factor that affects the number of co-cell interferers is random Frequency Hopping . For each burst, every interferer is assigned a specific hop frequency. Thus, the probability of collision between the home user and co-cell interferers is reduced by a factor that is dependent on the number of hopping frequencies. Hence, the probability of error depends on both the number of hopping frequencies and the system load . The Probability Mass Function (PMF) of the number of co-cell interferers can be modelled by a binomial distribution as:
P n ( n ) =
( N )
к n 7
• z n • (1 - Z ) N - n
(a)

Scatter plot
-0.5
■1
-1 -0.5 0 0.5 1
In-Phase
The averaged overall error probability for GMSK is given in equation (19):
N
P b = 2 P. ( SIRIn ) * P n ( n ) n = 0
N
=2 (i - ( n=0
n* a * SIR
- * a ■ SIR + 1
*
X * Kf . B ch ■ Nsec
(—Tt ) *
U TDMA B sys
(1--)
UTDMA * Bsys
(b)
Fig. 5: (a) Received GMSK signal points with reuse figure K f = 3 and Q = 9 (b) K f = 7 and Q = 21
Where ζ is the probability that a certain channel is occupied (traffic/channel). This factor is denoted by the system load . The factor ζ incorporates many network parameters and this leads to linking the error probability with system configuration parameters like: system bandwidth B sys (in MHz), GSM channel bandwidth B ch (in MHz), traffic λ (Erlangs), Reuse figure K f and number of sectors per site N sec . Let the number of available hopping frequencies be N HOP . The number of hopping frequencies can be given by:
N
HOP
Bsys
B ch * N sec * K f
The probability of error expression is developed in (19) as a function of all system configuration parameters. The effect of frequency hopping is that different bursts perceive different number of interferers; this is called Interference diversity [3]. Due to this diversity effect, the overall interference perceived by the receiver during a transmission period is averaged. This effect is called Interference averaging . The interference diversity and averaging effect is accounted for by considering all bits fed to the Viterbi decoder to be independent, and thus, burst errors are not considered in our analysis (this is justified by the presence of an interleaver). Besides, the error probability for individual class IA bits will be considered independent while calculating the rate of frame erasures. The overall Bit Error Rate (BER) of the GMSK is plotted versus SIR in figure 6. We assume a GSM system with system load of 25% and first tier interferers.
The factor ζ is given by:
X X * K f • B ch • N sec
TDMA HOP TDMA sys
The PMF of the number of interferers as function of system configuration parameters is given by:
P n ( n ) =
l n J Bsys
X * Kf . B ch * N sec - n
(1--)
в sys
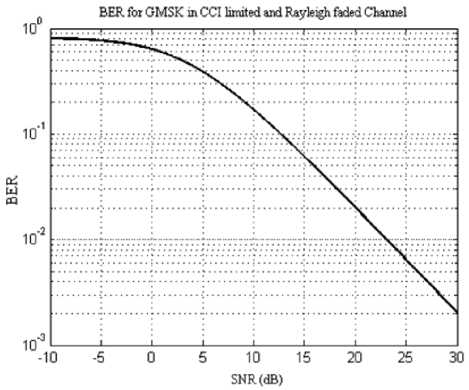
Fig. 6: The BER for GMSK in CCI limited and Rayleigh faded channel
-
IV. Post-decoding Bit Error Rate
The GSM full rate speech channel (TCH) is a 260 bits that are protected via block and convolutional coding. The class IA bits are the most important 50 bits in a TCH frame and are protected by 3 CRC parity bits and rate r = ½ convolutional code. The class IB bits are 132 bits and are only applied to convolutional coding. The class II bits are 78 un-coded bits. The usage of bit interleaving, frequency hopping and the assumption of flat fading channel allow the assumption of a memoryless Binary Symmetric Channel (BSC). The BSC is characterized by a crossover probability, which represents the probability that the receiver receives an erroneous bit. The analysis approach for the channel decoder is to set the BSC crossover probability as the error probability for the GMSK modulation, and then study the performance of the GSM conventional Viterbi decoder. The overall system view is demonstrated in figure 7.
to vocoder
Fig. 7: The uplink transceiver system model
As the aim of this work is to obtain an upper bound on the error rate performance, it is assumed that the receiver utilizes a hard decision Viterbi decoder (using soft decision decoder would improve the performance). The GSM convolutional encoder is a rate r = ½ encoder with constraint length of 5. The codes generator functions are given by [6]:
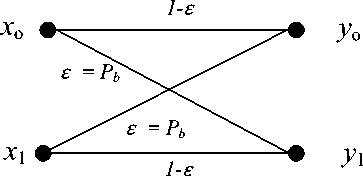
Fig. 8: Channel transition figure of the BSC perceived by Viterbi decoder. Crossover probability is calculated in (19)
Gx ( D ) = 1 + D + D 3 + D 4
G 2 ( D ) = 1 + D 3 + D 4
The channel transition figure of the memoryless BSC is drawn in figure 8. The error correction capability of convolutional codes depends on the distance between codeword sequences. Determining the code’s free distance (hamming distance) d H is done by calculating the distance between the minimum weight and the all zero codewords.
Assuming an all zero codeword is transmitted, the error probability is bounded by the probability that the hamming distance between the received vector Y and the error pattern E is less than the distance between Y and the all-zero word, summed over all possible error patterns.
P < P { U ( dH (Y , E ) < dH (Y ,0)) | 0 was sent }
E
UnionBound
< Z P { dH ( Y , E ) < dH ( Y ,0) | 0 was sent }
E to
< Z A w • P ( = ) w = dH
Where { A w } is the weight distribution of a convolutional code, which represents the number of detours from the all-zero path with code sequence weight of w [9]. The crossover probability ɛ is the probability of error for the GMSK modulator calculated in (19). The quantity P w ( ɛ ) is the probability of error between two codewords that are w distance apart. An error between two binary codewords that are of distance d apart occurs if more than d/2 of the bits composing the hamming distance (the bits where the two codewords differ) are erroneous. The number of erroneous bits is randomly distributed with a binomial distribution; the probability of more than d/2 erroneous bits out of d bits is a summation over the binomial distribution from d/2 to d.
Pd (£) = Z
e =
к e J
• £e • (1 - £)d-e
Л (d) d
< Z e=Г d 1к e J
• £ 2 • (1 - £)
d
d
d
= £
= • (1 - £ к • Z
К (d )
e =
к e J
d
d
< £ 2 • (1 - £ )2 • 2 d
It was shown in [11] that the GSM convolutional encoder, the hamming distance d H is 7 and the weight distribution belongs to the set {4, 12, 20 ...}. It is stated in [10] that for small crossover probability, the postdetection BER is dominated by the first component of the summation. The preliminary post-decoding error rate upper bound is given by:
d
Z e = (d+1)/2
( d )
к e J
к d/2 J
• £e • (1 - £)d-e
• (1 - £ ) d /2
(d)+ Z • £e • (1 - £)d Д e
This piecewise definition can be reduced into a unified expression by neglecting the first term in the expression of even values of d [8]. The probability of error between two codewords of distance d apart reduces to:
d
Pd (£) 2 Z
Г d e =
I 2
(d 1 к e J
• £e • (1 - £)d-e
A more simplified, albeit much looser bound can be developed as follows:
P . < 1 ZZ A w ■ 2 w • V £ w • (1 - £ ) w k w = dH
< - dH- • 2 d H • yl^d H • (1 - £ ) d H
Where k is the number of input bits to the encoder (185 in GSM). Figure 10 shows a log-log plot for the bit error rate bound for the convolutional code versus the crossover probability. The performance of the convolutional code is decided by the crossover probability value, which is dependent on the GMSK BER.
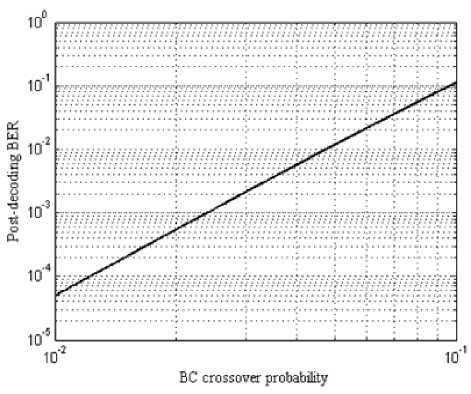
Fig. 9: The post-decoding BER versus crossover probability of BSC
Z (i - (
- = 0
n ___
-•a • SIR
- • a • SIR +1
• z - • (1 - Z ) N - -
dH
•
( N )
• z- • (1 — Z)N--
dH
z=
^ K f • B ch • N sec
TDMA • Bsys
The overall GSM system BER would incorporate the GMSK probability of error with the error probability bound for the rate ½ convolutional encoder. The resulting expression includes all system configuration parameters in addition to the coder’s free distance and weight distribution. An expression for the coded GSM BER in a faded and CCI limited channel is expressed in (26). Note that the approximations leading to the expression given in (26) is only valid for crossover probability < 0.5, which corresponds to an SIR of ≈ 5 dB. A comparison between the pre-decoding and postdecoding probability of error is depicted in figure 10. The results closely match the post and pre decoding error rate bounds obtained via simulation in [11].
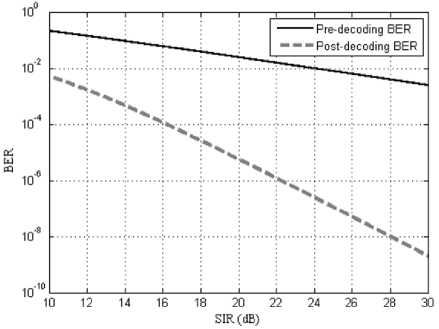
Fig. 10: The post-decoding BER versus pre-decoding BER
3 < 1 ek
d H + 2
w
•Z Aw •Z w=dH e=rw
( w
V e 7
• Z(1 - (
- = 0
-
- •a • SIR
-
- •a • SIR + 1
• z - • (1 - z ) N - -
e
•
•
—
Z (1 - (
- = 0
-
- •a • SIR
-
- •a • SIR + 1
• z - • (1 - Z ) N - -
A tighter bound on the error rate can be obtained by keeping equation (24) without simplification. We consider three weighting coefficients only. Thus, the tight error bound is given by equation (27). This bound is valid for all values of the crossover probability and provides a considerably tighter upper bound on the probability of error for the system.
The factor ζ (system load) represents the effect of the traffic offered by the system and the available number of channels on the BER. As the system load increases, the BER degrades due to the increase in the probability of channel occupancy, resulting in an increase in the average number of interferers perceived by the MS. Figure 11 shows the impact of ζ on the FER for ζ = 10%, 25%, 50% and 75%.
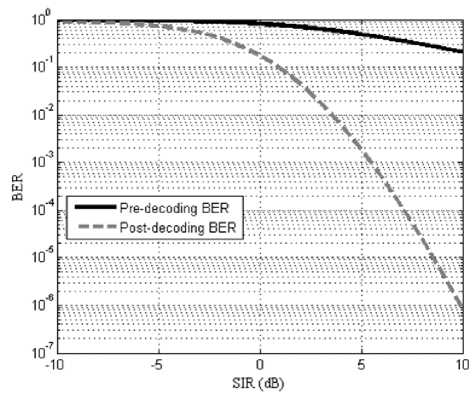
Fig. 11: The tight post-decoding BER and pre-decoding BER bounds
-
V. Frame Erasure Rate Calculation
A speech frame is erased if the 3-bit CRC parity detects an error in the significant class bits. A frame is erased if the CRC error detector signals a bit error. Assuming that all bit errors in the class Ia bits are detected. This gives an upper bound on the FER. The FER can be calculated as the probability that any of the 50 class Ia bits are erroneous. This is equivalent to the complement of the probability that all class Ia bits are correct. Equation (28) represents the FER as a function of all system configuration parameters (I a denotes the number of class IA bits). The FER is plotted for different values of the system loads in figure 12.
Pe й< 1 - (1 - P ) I a FER e
-
d H + 2 w
1 • X A w -X k w = d w
( w ^
•
H
e =1
V e J
X (1 - ( n=0
— -a
e
I a
= 1 -
n • a • SIR +1 2

• z n • (1 - z ) N - n
к
1 - X (1 - (
n = 0
n •a • SIR n •a • SIR +1

• z n • (1 - Z ) N - n
J
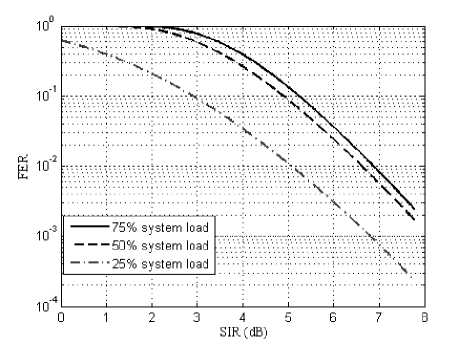
Fig. 12: The tight FER bound for GSM system versus SIR
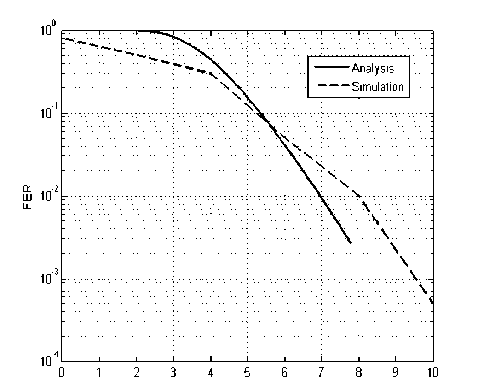
The accuracy of the proposed bound was tested by comparison with simulation results. In [12], the GSM link level was simulated to obtain the FER performance versus SIR in a TU3 channel using 8 hopping frequencies. It is shown in figure 13 that the proposed bound acts as an upper bound for SIR < 7 dB. As the SIR increase, the system becomes limited by the intersymbol interference (ISI) resulting from the urban channel profile and an offset of 1 dB is observed in the FER curve. The analytical approach can be enhanced further by modelling ISI as another additive random process. However, this would introduce significant complexity to the problem.
SIR (dB)
Fig. 13: Comparison between simulation and analytical results
-
VI. Conclusion
New analytical expressions for evaluating upper bounds for BER and FER of GSM cellular system are developed in this work. These expressions can provide means for system-to-link level mapping for a GSM network in a computationally efficient manner instead of the time consuming link level simulators. The developed expressions link the QoS metrics (BER and FER) with all system configuration parameters (system bandwidth, reuse figure, sectors per site, offered traffic...). Hence, one can use such expressions to optimize system parameters while satisfying the GSM standard QoS requirements. All GSM PHY layer modules that impact the error rate are considered in the analysis. A Cochannel Interference (CCI) limited and Rayleigh channel is considered for evaluating the raw BER of the GSM GMSK modulation. The calculated BER is then used as a crossover probability for a Binary Symmetric Channel (BSC) that is perceived by the convolutional code. The channel is considered memoryless due to interleaving and frequency hopping effects. An upper bound for the error probability of a hard decision Viterbi decoder is derived. This postdecoding error probability represents the GSM system BER that can be easily converted into an equivalent Frame Erasure Rate (FER). Plots for BER and FER are shown and the impact of system load on the error rate bound is emphasized.
Acknowledgements
This work was sponsored by the National Telecomm Regulatory Authority
References An Analytic Approach for Calculating Frame Erasue Rate in Cellular GSM Networks
- Bruce F. McGuffin, “A Bound On Frequency Hopped GSM Performance In Co-Channel Interference”, ELECTRO '96. Professional Program. Proceedings, pp. 235-240, May 1996.
- K. Ivanov, C. Lüders, N. Metzner, U. Rehfue,”Frequency hopping spectral capacity enhancement of cellular networks”, vol. 3, IEEE 4th International Symposium on Spread Spectrum Techniques and Applications Proceedings, pp 1267-1272, 1996.
- Hikan Olofsson, Jonas Naslund, Johan Skold, “Interference diversity gain in frequency hopping GSM”, vol. 1, pp 102-106, IEEE 45th Vehicular Technology Conference, 1995.
- Jeroen Wigard and Preben Mogensen, “A simple mapping from C/I to FER and BER for a GSM type of air-interface”, vol. 1, Seventh IEEE International Symposium on Personal, Indoor and Mobile Radio Communications, PIMRC'96, pp 78-82, 1996.
- Simon Haykin, Communication Systems, Fifth edition, Wiley, March 2009.
- Andrea Giorgetti and Marco Chiani, “Influence of fading on the Gaussian approximation for BPSK and QPSK with asynchronous cochannel interference”, vol. 4, pp 384-389, IEEE Transactions on Wireless Communications, March 2005.
- Hakan Olofsson, Magnus Almgren, Christer Johansson, Mikael Hook and Fredric Kronestedt, “Improved interface between link level and system level simulations applied to GSM”, vol. 1, 1997 IEEE 6th International Conference on Universal Personal Communications Record, pp 79-83, 1997.
- GSM 05.03, ETSI Version 5.2.0, Digital cellular communication system, August 1996.
- Viterbi, “Error bounds for convolutional codes and an asymptotically optimum decoding algorithm”, vol. 13, pp 260-269, IEEE Transactions on Information Theory, April 1967.
- P. Wijesinghe, U. Gunawardana, R. Liyanapathirana, “Improved error bounds for rate-1/2, terminated convolutional codes with QPSK in Nakagami-m fading channels”, pp 1-4, International Conference on Signal Processing and Communications (SPCOM), 2010.
- Christine N. Liu, “Channel Coding for Enhanced Full Rate GSM”, Master Thesis, Massachusetts Institute of Technology (MIT), September 1996.
- L.B. Lopes and A.F. Molisch, "Research into performance and enhancement of second generation systems: GSM and DECT", pp. 209-284 in "Digital Mobile Radio - the view of COST 231", E. Damosso and L. Correia (eds.), European Union Publications (1999).
