An anomaly detection based on optimization

Author: Rasim M. Alguliyev, Ramiz M. Aliguliyev, Yadigar N. Imamverdiyev, Lyudmila V. Sukhostat
Journal: International Journal of Intelligent Systems and Applications @ijisa
Article in issue: 12 vol.9, 2017.
Free access
At present, an anomaly detection is one of the important problems in many fields. The rapid growth of data volumes requires the availability of a tool for data processing and analysis of a wide variety of data types. The methods for anomaly detection are designed to detect object’s deviations from normal behavior. However, it is difficult to select one tool for all types of anomalies due to the increasing computational complexity and the nature of the data. In this paper, an improved optimization approach for a previously known number of clusters, where a weight is assigned to each data point, is proposed. The aim of this article is to show that weighting of each data point improves the clustering solution. The experimental results on three datasets show that the proposed algorithm detects anomalies more accurately. It was compared to the k-means algorithm. The quality of the clustering result was estimated using clustering evaluation metrics. This research shows that the proposed method works better than k-means on the Australia (credit card applications) dataset according to the Purity, Mirkin and F-measure metrics, and on the heart diseases dataset according to F-measure and variation of information metric.
Optimization, anomaly detection, Big data, clustering, regularization parameter
Short address: https://sciup.org/15016446
IDR: 15016446 | DOI: 10.5815/ijisa.2017.12.08
Text of the scientific article An anomaly detection based on optimization
Published Online December 2017 in MECS
The growth in the volumes of collected information and the development of tools and methods for its reliable storage lead to an increase in the relevance of the development of new methods and algorithms for analyzing large and super-large data sets.
For example, in [1] the author affirmed that the identification of regularities in large data sets becomes the main tool for research and obtaining new knowledge in the advanced fields of science in our time. Indeed, the rapid growth in the volume of data intended for processing characterizes not only IT companies and the scientific sphere (including meteorology, genetic research, complex physical simulators, and biology and environmental research), but also a wide range of organizations in various fields. In modern science and technology, a separate direction appeared related to the analysis of large and super-large data sets, known as “Big data” [2].
“The term “Big data” applies to information that can't be processed or analyzed using traditional processes or tools.” [3] Today, organizations are increasingly experiencing more and more problems associated with large volumes of data [4].
They have access to a wealth of information, but they do not know how to take advantage of these data, because they are in raw form or in an unstructured format. As a result, organizations do not even know there is any valuable information in the data and whether it is worth keeping. Data issues include capture, storage, retrieval, transmission, analysis, and visualization. All these factors together turn into a real information problem of the generation.
Analysis of such data volumes requires the involvement of technologies and tools for implementing high-performance computing.
In recent years, the world community has seen a large volume of data as a data set, characterized by the following main features: volume, velocity, variety, veracity, and value.
At present, the methods of large volume data sets representation and intellectual analysis are successfully developed [5]. There are many approaches to the classification of the main scientific and engineering directions in the solution of various urgent problems in this field.
Anomaly (outlier) detection is a common problem in the analysis of large volumes of data. Anomaly can both represent individual observations, and can be combined into certain groups.
The presence of anomalies in the data set can be associated with the appearance of so-called "shifted" values associated with a systematic error, input errors, data collection errors, etc.
The solution of the anomaly detection problem is not trivial [6, 7]. Another reason is that several methods for anomaly detection require labeling of normal and/or abnormal behaviors that are not easy to archive [8, 9]. In addition, it is not easy to choose a suitable tool for anomaly detection. The assigned tool can be well suited for only one type of anomaly, but not for all [10]. Thus, when the types of anomalies are not known a priori, this is a very realistic assumption, that the selection of method for their detection is not easy.
The effectiveness and accuracy of data analysis methods directly depends on their quality, which in turn depends on the amount of outliers in the data.
Many statistical approaches have been proposed for data analysis, such as analysis of variance, linear/multilinear regression, discriminant analysis, correlation analysis, factor analysis, principal component analysis (PCA), and cluster analysis [11, 12].
Cluster analysis can be used to get an idea of the data, generate a hypothesis, detect anomalies, and for classification.
Often, applications are defined in terms of outliers (for example, in cases of fraud, network anomaly detection, etc.), in which case a direct approach is likely to be more effective [13, 14].
The aim of this paper is to develop an approach for anomalies detection in “Big data” based on clustering. The challenge of clustering large amounts of data is associated with computational complexity. The solution of this problem was proposed in [15]. For a known number of clusters, an algorithm for anomaly detection is proposed.
The rest of the paper is organized as follows. Section 2 gives a literature review of existing works. The proposed clustering method is described in Section 3. In Section 4, test datasets and clustering evaluation metrics are presented. The experimental results are given in Section 5, followed by conclusions in Section 6.
-
II. Related Work
The data mining methods allow extracting previously unknown, understandable and useful knowledge from large volumes of data [16].
A data point that is different from the remaining data according to some metric often contains useful information about the abnormal system behavior described by the data that is known as outlier. This problem usually occurs in the context of data sets of very high dimensionality.
Outliers are more useful, depending on their diagnosis of data characteristics, which differ significantly from the average behavior. In many applications, such as network intrusion detection, these characteristics can provide a guidance to discover cause-effect relationships of abnormal behavior of the main application.
A new approach for detection of anomalous values was discussed in [17], which is particularly suited for data sets of very high dimensionality.
Chandola et al. [18] attempt to provide a structured and comprehensive review of research in the field of anomaly detection for discrete sequences.
Furthermore, many of the discussed methods can be applied to continuous sequences or time series.
For example, methods based on Euclidean distance [19, 20] and cross-correlation [21], window-based methods [20], and Hidden Markov models [22].
The authors in [23] seek to provide a comprehensive and structured overview of methods for outlier detection for temporal data. Simulation of temporal data is a complex task because of the dynamic nature and complex evolutionary patterns in the data. In the paper, an organized review of the various methods proposed for detection of anomalous values in temporal data was presented.
The paper [24] is devoted to the problem of outliers detection in distributed environment based on the determination of the outlier density. In particular, in the data set, for each tuple p , its local outlier factor (LOF) is calculated, which represents the degree of the data set as an outlier. A distributed LOF computing method (DLC) for distributed calculation of outliers based on density is proposed. The algorithm first classifies tuples in the grid into two categories: GRID-local tuples and crossgrid tuples. Then the proposed method was presented for outlier detection of these two types of tuples, which can further save network resources. In addition, the effectiveness of the proposed approaches is tested through a series of experiments.
An efficient multi-step outlier-based method to analyze high dimensional voluminous network-wide traffic data for anomaly detection was proposed by Bhuyan et al. [25] The method selects a subset of relevant features that reduces the computational cost of anomaly detection. It can identify both disjoint and overlapping clusters for any dataset. The approach showed good results for DoS, probe and R2L attacks detection in large-scale networkwide traffic data.
A new algorithm employing stochastic differential equation (SDE) models to anomaly detection in stochastic processes was proposed [26]. Authors specify whether there exists an anomaly in the test data. Local polynomial kernel regression was applied to estimate SDE coefficients. The log-likelihood of the model parameters over a sliding window using Girsanov’s formula was constructed. The log-likelihood value as an anomaly indicator for making a decision about the presence of anomaly in the test data was used. The method was estimated on real data and used to discriminate speech/non-speech samples. In both simulated and real data, proposed algorithm outperforms other methods.
The k-means algorithm is the most widely used algorithm for data mining applications [6, 27]. It is simple, scalable, easily understood, and can be adopted to work with high-dimensional data [28-30]. However, the k-means algorithm works on data sets with only numeric attributes, which limits its use in solving clustering problems of categorical data. To solve this problem, the K-modes algorithm was proposed in [31, 32].
Due to sensitivity of the algorithm to the initial parameters, it is important to ensure K-modes clustering with good initial cluster centers [33]. However, there are still no generally accepted initialization methods for k-means clustering. In [34], the initialization of k-means clustering from the point of view of anomaly detection was considered.
-
III. Proposed Approach
In this section, the authors propose a clustering method for anomaly detection and describe the details of this algorithm.
Let us denote the following notations: r e Rn (i = 1, n) is the point from the data set, where r is the total number of points in the input data set, c ∈Rl (k =1,l) is the number of clusters, where l is the number of clusters, β=[β,...,β ]T∈Rn is the set of weights assigned to each data point.
The task is to minimize the following function in order to detect anomalies in dataset as follows:
n min(1 -λ)∑βi r* -riII +λIIβ I 2
β,r subject to
n
∑βi=1;βi≥0 ∀i(2)
i = 1
where 0 ≤ λ ≤ 1 is the regularization parameter, which will be determined experimentally, and r * are the centers of the clusters.
The algorithm of the proposed method for anomaly detection is as follows:
Input: r = { r 1, r 2,..., rn }
λ : regularization parameter
β (0) = { β (0) ,..., β (0) } : initial weights of data points k : number of clusters
Output: β ( s ) = { β 1( s ) ,..., β n ( s ) }
Step 1. Calculate the centers of clusters r * .
Step 2. s = 0
Step 3. for all r ∈ R n do
n ci =∑βi(s) r* -riII 2 i=1
end for
Step 4. Calculate the value of the function according to (1) taking into account condition (2)
n
f ( s ) = (1 - λ ) ∑ c i + λ β ( s ) 2 i = 1
Step 5. s = s + 1
Step 6. Repeat steps 3-5 until the convergence condition is met.
Step 7. Return β ( s )
End
In the algorithm, each cluster is represented by its center, and the goal is to find a solution that maximizes the similarity between each point and the cluster center to which it is assigned [35].
-
IV. Datasets and Evaluation Metrics
In the paper to evaluate the effectiveness of the proposed method, several experiments were carried out. The experiments were conducted on two data sets taken from the UCI repository [36, 37], including Australia and Heart datasets. These data sets cover examples of small, medium and large data sets, and they have been used in many research areas.
Australia dataset concerns credit card applications. All names and variables in the file have been replaced with arbitrary symbols to protect the privacy of the data. The data set contains eight categorized and five numerical characteristics (continuous, nominal with small numbers of values, and nominal with larger numbers of values) with 690 instances [37]. The fifteenth attribute contains a class label, i.e. 1 or 2. The number of instances for each of the two classes is 383 (55.5%) for the first class and 307 (44.5%) for the second.
The second data set (Heart) contains information about heart disease and includes 270 instances. It contains 13 features (age, sex, chest pain type, resting blood pressure, etc.). As class labels, the presence (2) or absence (1) of the disease are considered.
In addition, the NSL-KDD dataset of attack signatures [38] was constructed. This data set is based on KDD-99 database on the initiative of the American Association for Defense Advanced Research Projects Agency (DARPA) [39]. To conduct research in the field of intrusion detection, a set of communication data was compiled and covered a wide range of various intrusions simulated in an environment that mimics the US Air Force network. The database contains training (125973 samples) and test (22544 samples) sets. Each instance has 42 attributes and describes different characteristics. Labels are assigned to each instance either as an "attack" type or as "normal" behavior.
All the considered data sets contain two classes.
Metrics for clustering methods evaluation took into account compactness and separation factors while working with a complex data set structure. The great importance of these measures indicates the correctness of the division into clusters.
The experiments were focused on comparing the results of clustering the proposed approach and k-means. In situations where records from data sets are already labeled, the authors can compare clusters with "ground truth" class labels.
Assume that the data set N is divided into classes C + = ( C + ,..., C + + ) (true clustering), and, using the clustering procedure, clusters C = ( C ,..., C ) can be found in this data set.
A comparison of the clustering solutions is based on counting the pairs of points. Based on the results, a decision will be made: an abnormal/"normal" behavior. The most well-known clustering distance metrics based on data point pairs are the purity [40, 41], the Mirkin metric [42], the partition coefficient [43], the variation of information [44], the F-measure [45] and the V-measure [45].
A. Purity
The purity of the cluster C gives the ratio of the
dominant class size in the cluster to the cluster size itself
[40, 41, 46]. The value of the purity is always in the
interval
1 ,1 k+
. The purity of the entire collection of
clusters was evaluated as a weighted sum of the individual cluster purities:
The higher the F-measure, the better the clustering solution. This measure has a significant advantage over the purity, because it measures both the homogeneity and the completeness of a clustering solution [41].
D. Partition coefficient
1k purity(C) - - 2 max C П CJ (3)
n^ p += 1,..., k +l p p I
PC ( C . C + ) - -^ 2
kk 2
where k + is the initial number of classes, and k is the number of clusters that need to be found. According to this measure, a higher purity value indicates a better clustering solution.
B. Mirkin metric
The Mirkin metric is defined as follows [42]:
1 ( k 9 k+
M (C. C+)=-г |z n +2 C++ n V p=1
k k + । |2 ^
- 2 22 c p n C;
p = 1 p +- 1 )
Mirkin metric (4) is scaled with the factor in order n 2
to restrict its range to the interval [0, 1]. This metric is obviously 0 for identical clusterings, and positive otherwise [47].
C. F-measure
Another evaluation measure, also known as the “clustering accuracy”, based on the F value of the cluster C and the class C ++ , that is the harmonic mean p p of the precision and the recall:
F ( C , . C + + ) -
2 1 C p n C P I •
I C p I | C p 1 c pn c p. I C p n C ;.
---— +---—
I C p I I C + + 1
The F-measure of the cluster C is the maximum F value attained at any class in the entire set of classes C + - ( C + ..... C ++ ). The F-measure of the entire collection is considered as the sum of the individual cluster specific F-measures, weighted according to cluster size. That is,
k | C |
F ( C ) - 2~" max F(Cp . C + ) (6)
+ <=C+ p p p-1 n Cp + eC
k k+ p-1 p +-1
I C p n C +r
I C p I
A higher value of PC ( C . C + ) indicates a better clustering solution.
E. Variation of information
This is another information-based clustering measure [44]. It measures the amount of information that the authors gain and lose when going from the clustering C to another clustering C + .
According to [44, 46] variation of information (VI) can be defined as
M ( C . C + ) -
1 n log n
X log
k k + I |2
22 Cpncp- p-1 p +-1
' I C p^ C + + 1 ' v Cpnc ; ■ Г)
The maximum value of the variation of information is log n , which is achieved when the partitions are as far apart as possible. In this case, it means that one of them places all the documents together in a single cluster while the other places each document in a cluster on its own. The maximum value increases with n because larger data sets contain more information, but if this property is undesirable then one can simply normalize by log n .
In general, the smaller the variation of information, the better the clustering solution. The variation of information is presented as a distance measure for comparing clusterings of the same data set. Therefore, it does not distinguish between hypothesized and target clusterings.
F. V-measure
The V-measure is an entropy-based measure that explicitly measures how successfully the criteria of homogeneity and completeness have been satisfied [41]. The homogeneity can be defined as
hom( C ) = <
1,
H ( C + | C ) H ( C + ) ,
if H(C + | C ) = 0
else
2hom( C ) comp( C ) hom( C ) + comp( C )
where
k k +
H ( C + | C ) = -Ц p = 1 p += 1
;
n
x log
I C-nC+l
Xk^C-nC+1
h ( c+)=-I p +=1
X p = , C p n c ;L
x log
k+
Ik-KncLl
k+
H(C + | C ) is equal to 0 when each cluster contains only members of a single class, a perfect homogeneous clustering. In the degenerate case when H ( C + ) is equal to 0, when there is only a single class, the authors define the homogeneity to be 1.
Completeness is symmetric to homogeneity. The completeness can be defined as
comp( C ) = <
1,
H ( C | C + )
H ( C ) ,
if H ( C | C + ) = 0
else
where
k + k
H ( C | C + ) = - II p += 1 p = 1
ICpiC+'L
n
x log
X p -iM c p J
k
H ( C ) = - I p = 1
!PyC,nC;Jx
x log
k+ flP-ICnc^P
k+
V-measure of the clustering solution is calculated by finding the harmonic mean of homogeneity and completeness as follows:
Notice that the computation of the homogeneity, the completeness and the V-measure are completely independent from the number of classes, the number of the clusters, the size of the data set and the clustering algorithm used.
V. Experimental Results and Discussion
To evaluate the performance of the proposed approach, a number of experiments were implemented in Matlab 2016a on a 64-bit Windows-based system with an Intel core (i7), 2.5 GHz processor machine with 8 Gbytes of RAM.
Experimental datasets Australia, Heart and NSL-KDD were used as initial data. The characteristics of the data sets are presented in Table 1. 760, 301 and 1000 records from the data sets Australia, Heart and NSL-KDD were considered, respectively, based on the results of normalization. In the experiments, the number of clusters is set to be the same as the number of pre-assigned classes in the datasets for all clustering methods. All datasets contain two classes: abnormal ( C + ) and
"normal" ( C ).
Table 1. Summary of the Datasets
|
Dataset |
Number of instances |
Number of attributes |
Description |
||
|
Before processing |
After processing |
||||
|
C : |
c + n |
||||
|
Australia |
690 |
383 |
377 |
14 |
Credit card applications |
|
Heart |
270 |
120 |
181 |
13 |
Heart disease |
|
NSL-KDD |
125973 |
533 |
467 |
41 |
Network attacks |
The influence of the regularization parameter on the performance of the proposed algorithm on different data sets was considered. For X , the authors used the values 0.1, 0.2, 0.3, 0.4, 0.5, 0.6, 0.7, 0.8 and 0.9.
In addition, the performance of the proposed approach was compared to k-means algorithm. In the algorithm, each cluster is represented by its center, and the goal is to find a solution that maximizes the similarity between each point and the cluster center to which it is assigned [35].
The results of clustering are shown in Table 2, Table 3, Table 4, and Table 5, which gives a comparative analysis of the methods on the Australia, Heart, and NSL-KDD datasets on six evaluation metrics.
The best results were marked in bold. The evaluation metrics Purity, Mirkin's metric, F-measure, VI, PC, and V-measure were considered.
It can be concluded from Table 2, Table 3, and Table 4 that X =0.4 and X =0.5 give the best results for the NSL-KDD and Australia data sets, respectively. In addition, at X =0.1 and X =0.2, according to the F-measure and VI,
and Purity and the Mirkin metric, respectively, the best indicators for the Heart dataset were achieved.
V-measure does not possess discriminative ability, i.e., its value on various datasets was almost identical for all methods.
From this, it can be concluded that the use of V-measure metric is inappropriate to evaluate the results of clustering. Therefore, in the following comparisons it was not considered (see Fig.1, Fig.2 and Fig.3).
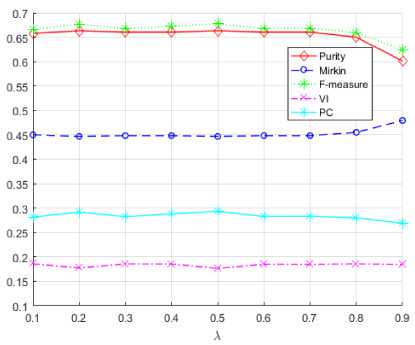
Fig.1. The influence of X values on the evaluation metrics for
Australia dataset.
The analysis reveals that the proposed approach yields the low quality of clustering by the PC metric in comparison to k-means (Table 5).
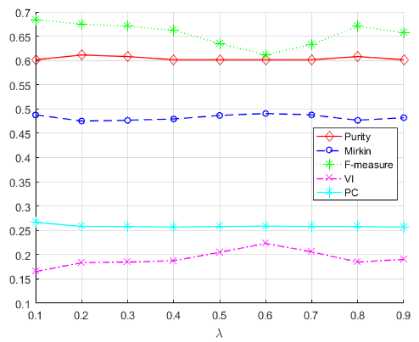
Fig.2. The influence of X values on the evaluation metrics for
Heart dataset.
So, the results for Purity metric (0.6632), Mirkin's metric (0.4468) and F-measure (0.6778) for the Australia dataset were better than k-means. The best indicators for Heart dataset were F-measure (0.6841) and VI (0.1650), whereas for NSL-KDD - VI (0.1139).
The influence of X value on the evaluation metrics: Purity, Mirkin's metric, F-measure and VI for the examined data sets (Australia, Heart, NSL-KDD) is more graphically demonstrated in Fig.1, Fig.2 and Fig.3.
Table 6 shows the comparison of our method with k-means algorithm. Here the authors use relative improvement for comparison:
our method - another method --------------------------x 100%.
another method
Table 2. Performance evaluation of the proposed approach on Australia dataset
|
X |
Ca |
Cn |
C^C |
C a^ C n |
Cn^C |
c nc+ nn |
Purity |
Mirkin |
F-measure |
VI |
PC |
V-measure |
|
0.1 |
491 |
269 |
307 |
184 |
76 |
193 |
0.6579 |
0.4501 |
0.6654 |
0.1859 |
0.2815 |
1.0006 |
|
0.2 |
531 |
229 |
329 |
202 |
54 |
175 |
0.6632 |
0.4468 |
0.6770 |
0.1773 |
0.2920 |
1.0005 |
|
0.3 |
489 |
271 |
307 |
182 |
76 |
195 |
0.6605 |
0.4485 |
0.6677 |
0.1856 |
0.2823 |
1.0006 |
|
0.4 |
521 |
239 |
323 |
198 |
60 |
179 |
0.6605 |
0.4485 |
0.6726 |
0.1854 |
0.2882 |
1.0005 |
|
0.5 |
535 |
225 |
331 |
204 |
52 |
173 |
0.6632 |
0.4468 |
0.6778 |
0.1764 |
0.2932 |
1.0005 |
|
0.6 |
493 |
267 |
309 |
184 |
74 |
193 |
0.6605 |
0.4485 |
0.6682 |
0.1850 |
0.2829 |
1.0006 |
|
0.7 |
495 |
265 |
310 |
185 |
73 |
192 |
0.6605 |
0.4485 |
0.6685 |
0.1847 |
0.2832 |
1.0006 |
|
0.8 |
503 |
257 |
310 |
193 |
73 |
184 |
0.6500 |
0.4550 |
0.6594 |
0.1857 |
0.2801 |
1.0006 |
|
0.9 |
556 |
204 |
318 |
238 |
65 |
139 |
0.6013 |
0.4795 |
0.6239 |
0.1845 |
0.2690 |
1.0005 |
Table 3. Performance Evaluation of the Proposed Approach on Heart Dataset
|
X |
Ca |
Cn |
C 'C |
C nn C + |
C A C+ nn |
Purity |
Mirkin |
F-measure |
VI |
PC |
V-measure |
|
|
0.1 |
23 |
278 |
8 |
15 |
112 |
166 |
0.6013 |
0.4878 |
0.6841 |
0.1650 |
0.2663 |
0.9997 |
|
0.2 |
39 |
262 |
21 |
18 |
99 |
163 |
0.6113 |
0.4752 |
0.6748 |
0.1833 |
0.2582 |
1.0004 |
|
0.3 |
40 |
261 |
21 |
19 |
99 |
162 |
0.6080 |
0.4767 |
0.6705 |
0.1847 |
0.2576 |
1.0005 |
|
0.4 |
42 |
259 |
21 |
21 |
99 |
160 |
0.6013 |
0.4795 |
0.6620 |
0.1874 |
0.2569 |
1.0005 |
|
0.5 |
60 |
241 |
27 |
33 |
93 |
148 |
0.6013 |
0.4867 |
0.6347 |
0.2049 |
0.2578 |
1.0011 |
|
0.6 |
88 |
213 |
39 |
49 |
81 |
132 |
0.6013 |
0.4907 |
0.6119 |
0.2231 |
0.2588 |
1.0016 |
|
0.7 |
61 |
240 |
27 |
34 |
93 |
147 |
0.6013 |
0.4878 |
0.6330 |
0.2058 |
0.2580 |
1.0011 |
|
0.8 |
40 |
261 |
21 |
19 |
99 |
162 |
0.6080 |
0.4767 |
0.6705 |
0.1847 |
0.2576 |
1.0005 |
|
0.9 |
44 |
257 |
21 |
23 |
99 |
158 |
0.6013 |
0.4821 |
0.6570 |
0.1900 |
0.2568 |
1.0006 |
Table 4. Performance evaluation of the proposed approach on NSL-KDD dataset
|
X |
C a |
C n |
Ca^C |
c nc+ an |
c nc+ na |
c nc+ nn |
Purity |
Mirkin |
F-measure |
VI |
PC |
V-measure |
|
0.1 |
69 |
931 |
66 |
3 |
467 |
464 |
0.5330 |
0.4982 |
0.6371 |
0.1267 |
0.3542 |
0.9999 |
|
0.2 |
66 |
934 |
63 |
3 |
470 |
464 |
0.5330 |
0.4985 |
0.6405 |
0.1261 |
0.3533 |
0.9999 |
|
0.3 |
69 |
931 |
66 |
3 |
467 |
464 |
0.5330 |
0.4982 |
0.6371 |
0.1267 |
0.3542 |
0.9999 |
|
0.4 |
24 |
976 |
22 |
2 |
511 |
465 |
0.5330 |
0.4997 |
0.6931 |
0.1139 |
0.3371 |
0.9996 |
|
0.5 |
67 |
933 |
64 |
3 |
469 |
464 |
0.5330 |
0.4984 |
0.6394 |
0.1263 |
0.3536 |
0.9998 |
|
0.6 |
53 |
947 |
50 |
3 |
483 |
464 |
0.5330 |
0.4996 |
0.6560 |
0.1233 |
0.3484 |
0.9999 |
|
0.7 |
68 |
932 |
65 |
3 |
468 |
464 |
0.5330 |
0.4983 |
0.6383 |
0.1265 |
0.3539 |
0.9999 |
|
0.8 |
71 |
929 |
67 |
4 |
466 |
463 |
0.5330 |
0.4982 |
0.6360 |
0.1280 |
0.3484 |
0.9999 |
|
0.9 |
74 |
926 |
68 |
6 |
465 |
461 |
0.5330 |
0.4983 |
0.6348 |
0.1300 |
0.3377 |
0.9999 |
Table 5. Performance evaluation of k-means algorithm on all data sets
|
Dataset |
Ca |
Cn |
C a^ C a |
MC |
cc |
C n c+ nn |
Purity |
Mirkin |
F-measure |
VI |
PC |
V-measure |
|
Australia |
754 |
6 |
383 |
371 |
0 |
6 |
0.5118 |
0.4907 |
0.6737 |
0.1097 |
0.3750 |
1.0002 |
|
Heart |
177 |
124 |
55 |
122 |
65 |
59 |
0.6213 |
0.4706 |
0.6587 |
0.2285 |
0.2682 |
1.0019 |
|
NSL-KDD |
514 |
486 |
74 |
440 |
393 |
93 |
0.8330 |
0.2782 |
0.8360 |
0.1303 |
0.3610 |
1.0003 |
Table 6. Performance evaluation compared between our method and k-means algorithm
|
Dataset |
Purity |
Mirkin |
F-measure |
VI |
PC |
|
Australia |
29.58% (+) |
8.95% (+) |
0.61% (+) |
60.80% (-) |
22.13% (-) |
|
Heart |
1.61% (-) |
0.98% (-) |
3.86% (+) |
27.79% (+) |
0.71% (-) |
|
NSL-KDD |
36.01% (-) |
79.08% (-) |
17.09% (-) |
12.59% (+) |
1.88% (-) |
In the Table 6 “+” means the result outperforms and ‘‘-” means the opposite.
Our approach (on Australia dataset) improves the performance by 29.58%, 8.95% and 0.61% in terms of Purity, Mirkin metric and F-measure, respectively.
As seen from Fig.1 the values of the Purity, F-measure and Mirkin metrics for different X are constant except for the value X =0.9.
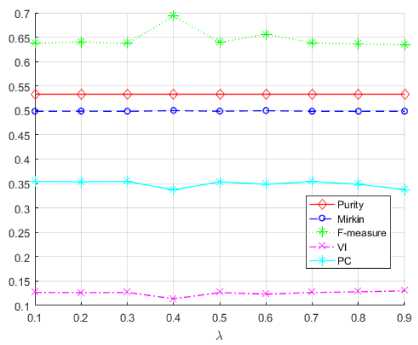
Fig.3. The influence of X values on the evaluation metrics for NSL-KDD dataset.
The worst results are highlighted by magenta and cyan colors for VI and PC metrics, respectively.
For Heart dataset the values of the metrics for the parameter X are constant except for the values X =0.1, X =0.5, X =0.6 and X =0.7 (Fig.2).
The best result was obtained for the VI measure (marked with magenta color) for X =0.1, and the worst for X = 0.6.
The best result for Purity metric (NSL-KDD dataset) was obtained at X =0.4, while the worst result was obtained for the PC metric with the same value of X (Fig.3.). The Mirkin (blue line) and Purity (red line) metrics are approximately constant for all X values.
Our research has shown that the proposed method works better than k-means on the Australia data set according to the Purity (29.58%), Mirkin metric (8.95%) and F-measure (0.61%), on the Heart data set according to F-measure (3.86%) and VI (27.79%), and NSL-KDD for the metric VI (12.59%).
-
VI. Conclusion
In this paper, a new clustering method was proposed to detect abnormal values in Big data.
The aim of the algorithm presented in the paper is to improve the anomaly detection.
This study assigns to each point that determines its relative position in the entire data set. In this research, the weights were assigned to each point (instance) and determine the relative position of this point in the entire data set. The purpose of this paper was to show that weighting improves the clustering solution. The comparison was made using three data sets containing anomalous values. The quality of the clustering result was estimated using six metrics. An important feature of the proposed approach is that it increases the accuracy of anomalous values detection based on clustering.
The experimental results showed that the proposed algorithm more accurately detects anomalous values compared to k-means algorithm.
Our research has shown that the proposed method works better than k-means on the Australia data set according to the Purity, Mirkin metric and F-measure, on the Heart data set according to F-measure and VI, and NSL-KDD for the metric VI.
It can be concluded that the proposed approach for anomaly detection is of practical importance.
Acknowledgement
This work was supported by the Science Development Foundation under the President of the Republic of Azerbaijan – Grant № EİF-KETPL-2-2015-1(25)-
56/05/1.
References An anomaly detection based on optimization
- T. Hey, S. Tansley, and K. Tolle, The fourth paradigm: data-intensive scientific discovery. Redmond, Washington: Microsoft Research, 2009, 284 p.
- S. Kaisler, F. Aemour, J.A. Espinosa, and W. Money, “Big Data: Issues and Challenges Moving Forward,” IEEE Computer Society, vol. 1, pp. 995-1004, 2013 [46th Hawaii International Conference on System Sciences (HICSS 2013), 2013].
- P.C. Zikopoulos, Ch. Eaton, D. Deroos, T. Deutsch, and G. Lapis, Understanding Big data, analytics for enterprise class hadoop and streaming data. New York: McGraw-Hill, 2011, 166 p.
- R.M. Alguliyev, R.T. Gasimova, and R.N. Abbaslı, “The obstacles in Big data process,” International Journal of Modern Education and Computer Science (IJMECS), vol. 9, no. 3, pp.28-35, 2017. doi:10.5815/ijmecs.2017.03.04
- J. Leskovec, A. Rajaraman, and J.D. Ullman, Mining of massive datasets. Cambridge: Cambridge University Press, 2014, 511p.
- M. Xie, S. Han, B. Tian, and S. Parvin, “Anomaly detection in wireless sensor networks: A survey,” Journal of Network and Computer Applications, vol. 34, no. 4, pp. 1302–1325, 2011.
- H. Nallaivarothayan, D. Ryan, S. Denman, S. Sridharan, and C. Fookes, “An evaluation of different features and learning models for anomalous event detection,” Proc. of the 2013 International Conference on Digital Image Computing: Techniques and Applications (DICTA’13), Hobart, Australia, November 2013, pp. 1–8.
- J.J. Davis and A. J. Clark, “Data preprocessing for anomaly based network intrusion detection: A review,” Computers & Security, vol. 30, no. 6–7, pp. 353–375, 2011.
- U. Fiorea, F. Palmierib, A. Castiglionec, and A. D. Santis, “Network anomaly detection with the restricted Boltzmann machine,” Neurocomputing, vol. 122, pp. 13–23, 2013.
- R. Kaur and S. Singh, “A survey of data mining and social network analysis based anomaly detection techniques,” Egyptian Informatics Journal, vol. 17, no. 2, pp. 199-216, 2016.
- M.E. Agha and M. Wesam, “Efficient and fast initialization algorithm for k-means clustering,” International Journal of Intelligent Systems and Applications (IJISA), vol. 4, no. 1, pp.21-31, 2012.
- M. Verma, M. Srivastava, N. Chack, A. Kumar Diswar, and N. Gupta, “A comparative study of various clustering algorithms in Data mining,” IJERA, vol. 2, no. 3, pp. 1379-1384, 2012.
- G. van Capelleveen, M. Poel, and R. Muller, “Outlier detection in healthcare fraud: A case study in the Medicaid dental domain,” Int. J. Accounting Information Syst., vol. 21, pp. 18-31, 2016.
- W. Wang, T. Guyet, R. Quiniou, M.-O. Cordier, F. Masseglia, and X. Zhang, “Autonomic intrusion detection: Adaptively detecting anomalies over unlabeled audit data streams in computer networks,” Knowl.-Based Syst., vol. 70, pp. 103-117, 2014.
- R.M. Alguliyev, R.M. Aliguliyev, A. Bagirov, and R. Karimov, “Batch clustering algorithm for Big data sets // Proc. of International Conference on Application of Information and Communication Technologies (AICT’16), Baku, Azerbaijan, 2016, pp. 79-82.
- J.D. Kelleher, B. MacNamee, and A. DArcy, Fundamentals of machine learning for predictive data analytics: algorithms, worked examples, and case studies, Cambridge, MA: MIT Press, 2015, 624 p.
- H. Ren, Z. Ye, and Z. Li, “Anomaly detection based on a dynamic Markov model,” Information Sciences, vol. 411, pp. 52-65, 2017.
- V. Chandola, A. Banerjee, and V. Kumar, “Anomaly detection for discrete sequences: a survey,” IEEE Trans. on Knowl. and Data Eng., vol. 24, no. 5, pp. 823-839, 2012.
- M. Abubaker and W. Ashour, “Efficient data clustering algorithms: improvements over Kmeans,” International Journal of Intelligent Systems and Applications (IJISA), vol. 5, no. 3, pp. 37-49, 2013. doi:10.5815/ijisa.2013.03.04
- D. Yankov, E. J. Keogh, and U. Rebbapragada, “Disk aware discord discovery: finding unusual time series in terabyte sized datasets,” Proc. of International Conference on Data Mining, 2007, pp. 381–390.
- U. Rebbapragada, P. Protopapas, C. E. Brodley, and C. Alcock, “Finding anomalous periodic time series,” Machine Learning, vol. 74, no. 3, pp. 281-313, 2009.
- Z. Liu, J.X. Yu, L. Chen, and D. Wu, “Detection of shape anomalies: a probabilistic approach using hidden Markov models,” Proc. of IEEE 24th International Conference on Data Engineering, April 2008, pp. 1325-1327.
- M. Gupta, J. Gao, C. Aggarwal, and J. Han, “Outlier detection for temporal data: a survey,” IEEE Trans. Knowl. Data Eng., vol. 26, no. 9, pp. 2250-2267, 2014.
- M. Bai, X. Wang, J. Xin, and G. Wang, “An efficient algorithm for distributed density-based outlier detection on big data,” Neurocomputing, vol. 181, pp. 19-28, 2016.
- M.H. Bhuyan, D.K. Bhattacharyya, and J.K. Kalita, “A multi-step outlier-based anomaly detection approach to network-wide traffic,” Information Sciences, vol. 348, pp. 243-271, 2016.
- Y. Rajabzadeh, A.H. Rezaie, and H. Amindavar, “A dynamic modeling approach for anomaly detection using stochastic differential equations,” Digital Signal Processing, vol. 54, pp. 1-11, 2016.
- T. Velmurugan and T. Santhanam, “A survey of partition based clustering algorithms in Data mining: an experimental approach,” Information Technology Journal, vol. 10, no. 3, pp. 478-484, 2011.
- M. Capo, A. Perez, and J.A. Lozano, “An efficient approximation to the k-means clustering for massive data,” Knowl.-Based Syst., vol. 117, pp. 56-69, 2017.
- L. Bai, J.Y. Liang, C. Sui, and C.Y. Dang, “Fast global k-means clustering based on local geometrical information,” Information Sciences, vol. 245, pp. 168-180, 2013.
- M.C. Naldi and R.J.G.B. Campello, “Comparison of distributed evolutionary k-means clustering algorithms,” Neurocomputing, vol. 163, pp. 78-93, 2015.
- A. Saha and S. Das, “Categorical fuzzy k-modes clustering with automated feature weight learning,” Neurocomputing, vol. 166, pp. 422-435, 2015.
- L. Bai, J. Liang, C. Dang, and F. Cao, “A cluster centers initialization method for clustering categorical data,” Expert Systems with Applications, vol. 39, no. 9, pp. 8022-8029, 2012.
- S.S. Khan and A. Ahmad, “Cluster center initialization algorithm for K-modes clustering,” Expert Systems with Applications, vol. 40, no. 18, pp. 7444-7456, 2013.
- F. Jiang, G. Liu, J. Du, and Y. Sui, “Initialization of K-modes clustering using outlier detection techniques,” Information Sciences, vol. 332, pp. 167-183, 2016.
- R.M. Alguliyev, R.M. Aliguliyev, T.Kh. Fataliyev, and R.Sh. Hasanova, “Weighted consensus index for assessment of the scientific performance of researchers,” COLLNET Journal of Scientometrics and Information Management, vol. 8, no. 2, pp. 371-400, 2014.
- Y. Fu, Human activity recognition and prediction. Cham, Switzerland: Springer International Publishing AG, 2016, 181 p.
- K. Bache and Lichman, UCI Machine Learning Repository [http://archive.ics.uci.edu/ml]. Irvine, CA: University of California, School of Information and Computer Science. (accessed on 21/03/17), 2013.
- P. Aggarwal, S.K. Sharma, “Analysis of KDD dataset attributes-class wise for intrusion detection,” Procedia Computer Science, vol. 57, pp. 842–851, 2015.
- J. McHugh, “Testing intrusion detection systems: a critique of the 1998 and 1999 DARPA intrusion detection system evaluations as performed by Lincoln laboratory,” ACM Transactions on Information and System Security, vol. 3, no. 4, pp. 262–294, 2000.
- F. Boutin and M. Hascoet, “Cluster validity indices for graph partitioning,” Proc. of the 8th International Conference on Information Visualization (IV’2004), London, UK, 2004, pp. 376–381.
- A.M. Rubinov, N.V. Soukhorukova, and J. Ugon, “Classes and clusters in data analysis,” European Journal of Operational Research, vol. 173, pp. 849-865, 2006.
- B. Mirkin, Mathematical Classification and Clustering, Kluwer Academic Press, Boston, Dordrecht, 1996, 580 p.
- J.C. Bezdek and N.R. Pal, “Some new indexes of cluster validity,” IEEE Transactions on Systems, Man and Cybernetics – Part B: Cybernetics, vol. 28, pp. 301–315, 1998.
- A. Patrikainen and M. Meila, “Comparing subspace clusterings,” IEEE Transactions on Knowledge and Data Engineering, vol. 18, pp. 902–916, 2006.
- A. Rosenberg and J. Hirschberg, “V-Measure: a conditional entropy-based external cluster evaluation measure,” Proc. of the 2007 Joint Conference on Empirical Methods in Natural Language Processing and Computational Natural Language Learning(EMNLP-CoNLL), 2007, pp. 410-420.
- R.M. Aliguliyev, “Performance evaluation of density-based clustering methods,” Information Sciences, vol. 179, no. 20, pp. 3583-3602, 2009.
- S.M.R. Zadegan, M. Mirzaie, and F. Sadoughi, “Ranked k-medoids: a fast and accurate rank-based partitioning algorithm for clustering large datasets,” Knowl.-Based Syst., vol. 39, pp. 133-143, 2013.
