An Application of Opposition Based Colonial Competitive Algorithm to Solve Network Count Location Problem

Author: Hamid Reza Lashgarian Azad
Journal: International Journal of Intelligent Systems and Applications(IJISA) @ijisa
Article in issue: 1 vol.6, 2013.
Free access
Origin–destination (OD) matrix estimation largely depends on the quality and quantity of the input data, which in turn depends on the number and sites of count locations. In this paper, we focus on the network count location problem (NCLP), namely the identification of informative links in the road network. Also we employ opposition based colonial competitive algorithm (OCCA), which originally inspired by imperialistic competition, to determine the desirable number and locations of counting points satisfying location rules. The model and algorithm is illustrated with numerical examples.
Origin–Destination (OD) Matrix, Network Count Location Problem (NCLP), Opposition Based Colonial Competitive Algorithm (OCCA)
Short address: https://sciup.org/15010512
IDR: 15010512
Text of the scientific article An Application of Opposition Based Colonial Competitive Algorithm to Solve Network Count Location Problem
Published Online December 2013 in MECS
Urban congestion is a result of an increase in the number of workers, an increase in private vehicle usage, the high rate of population growth in the suburbs, and the high rate of employment growth in the suburbs [1].
The need for effective management of traffic congestion has never been greater. The 2009 US National Surface Transportation Infrastructure
Financing Commission report states, using figures from the Texas Transportation Institute (TTI) 2007 Urban Mobility Report, that ‘Traffic congestion in many of the nation’s metropolitan areas is endemic, with the cost of congestion – including lost time, wasted fuel, and vehicle wear and tear – topping $78 billion per year for the nation’s 437 urban areas’. The 2009 TTI report puts the US urban congestion cost at $87.2 billion, with extra travel time of 4.2 billion hours and extra fuel of 2.8 billion gallons. Figures of £10–20 billion have been estimated for the cost of congestion in the UK, and €120 billion (US$168.7 billion) per year in the EU (or 1% of EU GDP) [2].
To develop a coordinated strategy to address urban congestion, a transportation planning agency must be able to predict the consequences of alternative strategies.
This in turn requires that it be able to abstract from a complex system a simplified representation {a model} that it can manipulate to analyze the options open to it. The planning applications of such a model could include, for example, evaluation or design of a traffic control system, study of the impact of construction activity on traffic flow distribution, evaluation of alternate incident management schemes, etc.
Regardless of either the model or the application, a necessary input into the planning process is the underlying demand for use of the transportation network. The usual way of expressing this demand is by way of an Origin-Destination (O-D) matrix. Each cell of this matrix represents the number of trips between a specific combination of an origin and destination [3].
An origin-destination (OD) matrix is essential for efficient traffic control and management. In the past two decades, we have witnessed the development of a fast growing body of research focused on methods of estimating OD matrices from traffic counts. Because traffic counts are readily available in many urban areas and relatively inexpensive to collect, the estimation method has great economic advantages and is directly applicable for tactical and operational transportation planning. Generally, the quality of the estimated OD matrices is greatly dependent upon the accuracy of the input data (traffic counts and prior matrix and so on) and the number and locations of traffic counting points in the network. Conventionally, the impacts of the errors in input data have been investigated through numerical simulation with varying degrees of the accuracy of model input data. There has been, however, very limited attention that has been devoted to the key problem of identifying a set of links for which flow information should be collected and used. To our best knowledge, Lam and Lo proposed some heuristic procedures of identifying the order in which the links should be selected for estimating OD matrices. Based on the maximum possible relative error (MPRE), Yang et al. examined the reliability of the estimated O-D matrix with respect to the number and locations of counting points in the network [4].
The remaining of this paper is organized as follows. Section II explains network count location problem.
Section III gives an overview of colonial competitive algorithm, presents the concept of opposition based learning and provides a background of work that has been conducted to improve the performance of CCA. An experimental results for the opposition based colonial competitive algorithm for the network count location problem is included in section IV, which is followed by the conclusions and future work in section V.
-
II. Network Count Location Problem
OD matrix estimation from traffic counts is regarded as a convenient and reliable way to obtain up-to-date information about travel patterns in a region. In addition, this technique is relatively inexpensive compared with the conduct of extensive surveys, including road side interviews, number plate recognition and household surveys. However, the accuracy of such estimates depends largely on the quality and quantity of the input data, of which the number and sites of count locations play an essential part. Related mathematical problems have been formulated. One such problem is the determination of the number of count stations required for complete OD coverage. Another, the identification of informative links for a given number of stations in the road network, is referred to as the network count location problem (NCLP).
Recent approaches to solve the NCLP follow a number of selection rules. Yang and Zhou (1998) defined the most comprehensive set of rules:
Rule (1) OD covering rule: A certain minimum proportion of trips between each OD pair should be observable.
Rule (2) Maximal flow fraction rule: For a particular OD pair, links with the highest fraction of that OD flow should be selected.
Rule (3) Maximal flow interception rule: The set of links which intercept the maximum number of OD movements should be selected.
Rule (4) Link independence rule: Links with linearly independent flows should be selected [4].
Yang and Zhou formulated a rigorous mathematical framework for the problem. The final objective is to find the set of link count locations and the minimum number that minimizes the Maximal Possible Relative Error (MPRE), i.e. a minmax-risk averse methodology. The developed framework is founded on the above rules. Constraints can be assumed for the upper number of detectors for e.g. budget reasons [4].
Ehlert et al. (2006) started with the work of Yang and Zhou (1998) and developed a software tool, based on Mixed Integer Programming techniques, which solves the complex problem formulated only mathematically by the previous authors. In this software also the extension of Chung’s budget constraint and a set of weight, for ranking OD pairs by importance were included [5].
So far, the sensor problem has been dealt with analytically, i.e. OD flows and vehicle counts have been interrelated in a system of equations. Yang (1998) proposed a risk-averse solution in order to minimize the error in traffic count information while maximizing the information inference power. Yang’s solution is strongly dependent on the assignment approach adopted, and, as said in the case of OD-matrix estimation problems, DTA-type of approaches are not yet fully developed. Fei et al. (2007) among other studies adopted a simulation approach to solve the problem. The simulation software used was Dynasmart. Adopting from Yang the 4-rule criterion, they propose to solve the problem with the GLS approach as in and a Kalman filtering method to match real traffic counts and the ones simulated with the DTA [6].
-
III. Brief Review of Opposition Based Colonial Competitive Algorithm
Although the history of evolutionary computation dates back to the 1950s and 1960s, only within the last decade have evolutionary algorithms become practicable for solving real-world problems on desktop computers. As computers continue to deliver accelerated performance, these applications will only become more routine. The flexibility of evolutionary algorithms to address general optimization problems using virtually any reasonable representation and performance index, with variation operators that can be tailored for the problem at hand, and selection mechanisms tuned for the appropriate level of stringency, gives these techniques an advantage over classic numerical optimization procedures. Moreover, the two-step procedure to self-adapt parameters that control the evolutionary search frees the human operator from having to handcraft solutions, which would often be time consuming or simply infeasible. Evolutionary algorithms offer a set of procedures that may be usefully applied to problems that have resisted solution by common techniques, and can be hybridized with such techniques when such combinations appear beneficial [7].
-
3.1 Colonial Competitive Algorithm (CCA)
Colonial Competitive Algorithm (CCA) is a new evolutionary algorithm in the Evolutionary Computation field based on the human's socio-political evolution. Colonial Competitive Algorithm (CCA) and its extended version by opposition-based concept (OCCA) have been briefly reviewed in following subsections.
This algorithm starts with an initial random population called countries. Some of the best countries in the population selected to be the imperialists and the rest form the colonies of these imperialists. In an N dimensional optimization problem, a country is a 1× n array. This array defined as below
Pn =
country = [Р1, p2, p3 ,..., p^,r ]
Cn imp
2 Ci i=1
The algorithm starts with N initial countries and the best of them (countries with minimum cost) chosen as the imperialists. The remaining countries are colonies that each belong to an empire. The initial colonies belong to imperialists in convenience with their powers. To distribute the colonies among imperialists proportionally, the normalized cost of an imperialist is defined as follow:
C n = mx{ c i } - C „ i
cC
Where, n is the cost of nth imperialist and n is its normalized cost. Each imperialist that has more cost value, will have less normalized cost value. Having the normalized cost, the power of each imperialist is calculated as below and based on that the colonies distributed among the imperialist countries.
Figure 1 shows the initial empires. As shown in this figure, bigger empires have greater number of colonies while weaker ones have less. In this figure imperialist 1 has formed the most powerful empire and consequently has the greatest number of colonies.
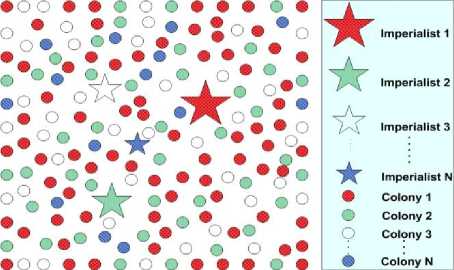
Fig. 1: Generating the initial empires: The more colonies an imperialist possess, the bigger is its relevant ★ mark
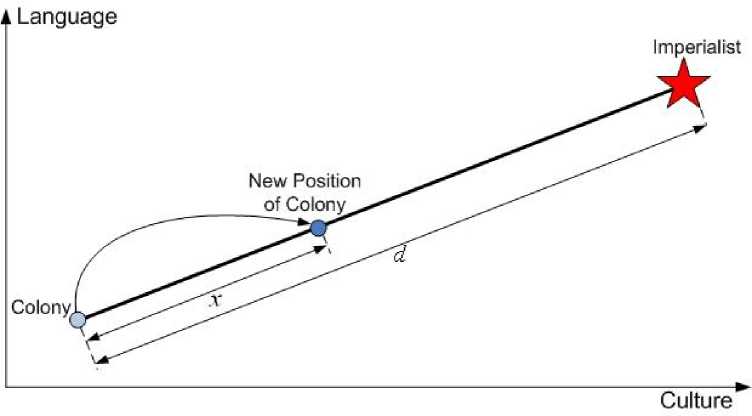
Fig. 2: Movement of colonies toward their relevant imperialist
To distribute the colonies among imperialist, of the colonies is selected randomly and assigned to their imperialist. The imperialist countries absorb the colonies towards themselves using the absorption policy. The absorption policy shown in Figure 2 makes the main core of this algorithm and causes the countries move towards to their minimum optima. The imperialists absorb these colonies towards themselves with respect to their power. The total power of each imperialist is determined by the power of its both parts, the empire power plus percents of its average colonies power.
T .C .n = Cost (imperialist n)+ §mean{Cost (4)(colonies of empire )}
T . C .
Where ..n is total cost of the nth empire and ξ is a positive number which is considered to be less than one.
In this algorithm, the imperialistic competition has an important role. During the imperialistic competition, the weak empires will lose their power and their colonies. To model this competition, firstly we calculate the probability of possessing all the colonies by each empire considering the total cost of empire.
N T .C. = max{T .C.}- T .C.
n i i n (5)
T . C .
Where n is the total cost of nth empire and
N . T . C . n
is the normalized total cost of nth empire.
Having the normalized total cost, the possession probability of each empire is calculated as below ppn
N.T.C.n imp
ZNTC..
i = 1
After a while all the empires except the most powerful one will collapse and all the colonies will be under the control of this unique empire [8].
Figure 3 shows a big picture of the modelled imperialistic competition.
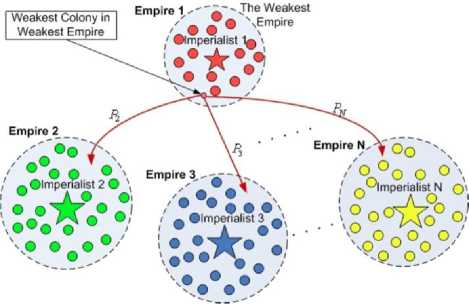
Fig. 3: Imperialistic competition: The more powerful an empire is, the more likely it will possess the weakest colony of the weakest empire
-
3.2 Opposition Based Learning (OBL)
The concept of opposition-based learning (OBL) was introduced by Tizhoosh [9] and has thus far been applied to accelerate reinforcement learning and backpropagation learning in neural networks. The main idea behind OBL is the simultaneous consideration of an estimate and its corresponding opposite estimate (i.e., guess and opposite guess) in order to achieve a better approximation for the current candidate solution.
To clarify, see the figure below.
k=0
a1
Solution
b1
k=1
a1 x
X0
b1
k=2
a1 XI—^
X0
b2
k=3
X0
a2
X b2
k=4
X0 X
Fig. 4: Solving a one-dimensional equation via recursive halving of the search interval with respect to optimality of the estimate x and oppositeestimate xo
Considering the unite interval [a1, b1] in Figure 4, the solution for a given problem can be found by repeated examination of guess and counter-guess. The opposite number xo of the initial guess x will be generated. Based on which of the estimate or counterestimate is closer to the solution, the search interval can be recursively halved until either the estimate or the counter-estimate is close enough to an existing solution.
Any population-based optimization algorithm has two main phases, namely, population initialization and evolutionary generating of the new population. Three possible stages are recognizable to employ oppositionbased optimization to accelerate the parent algorithm.
These three stages are [10]:
-
(1) During population initialization
-
(2) During population evolution, and
-
(3) After population evolution
-
3.3 Opposition Based Colonoal Competitive Algorithm (OCCA)
Concept of opposition has been employed to accelerate CCA. Opposition concept was utilized to introduce opposition-based population initialization and opposition-based generation jumping. By embedding these two steps within CCA, OCCA was proposed. [11]
We now employ opposition based colonial competitive algorithm to determine the desirable number and locations of counting points. Let us define a coverage matrix в =[ Ьуа ] with rows corresponding to paths in R, and columns corresponding to links in A, where bra =1 if link a is on path r, and 0 otherwise. With a given prior OD matrix, the coverage matrix can be obtained using an appropriate assignment model. If path flows between OD pairs are known, link flows Va can be obtained below:
va =∑rzrbra=ZBa
Where Z=(…,zr,…) is a row vector of all path flows and B a is the a-th column vector of the coverage matrix B.
Let us define X=( ^1
…, ^a
…, ^number of links ) as
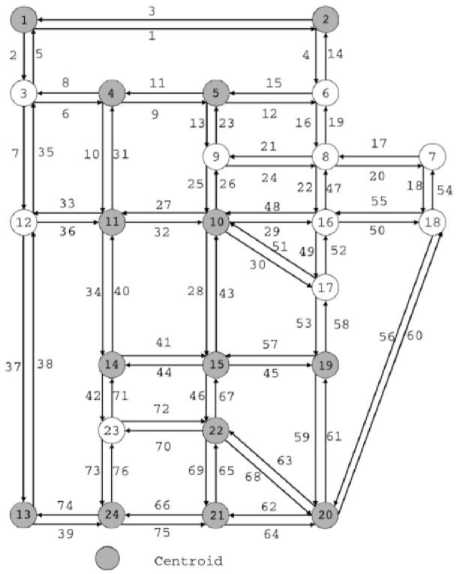
Fig. 5: City Network of Sioux Falls [4]
decision variables for network count location problem where Xa =1 if link a is selected as a informative link, and 0 otherwise. Therefore, objective function is to
F(X) =∑a∑rzrbraxa
Now we must maximize objective function subject to budget restriction. In this paper, we assume the cost of purchasing and installing detectors into the count location problem is equal to L. Thus, by assuming equal costs for each link, the maximization problem takes the following form:
Maximize
F(X)=∑∑zrb ra x
subject to
∑с .х=L
a
хa ∈ {0,1} (9)
Where L is a given budget and ca represents costs for placing a detector on link a. In the following section, NCLP model is solved by OCCA [11].
-
IV. A Numerical Example
In this paper, we employed Sioux Falls city network. Sioux Falls is the largest city in the U.S. state of South Dakota. This network includes 24 centroids and 76 links. There are link input data and prior OD matrix [4]. Network is shown in figure 5.
Table 1: Network Count Location Problem Solving Results NCL = Number of Count Location, %IC = Percentage of Information Coverage.
|
NCL |
% IC |
NCL |
% IC |
NCL |
% IC |
|
1 |
6.3 |
27 |
72.5 |
53 |
92.9 |
|
2 |
12.1 |
28 |
73.9 |
54 |
93.1 |
|
3 |
14.1 |
29 |
74.6 |
55 |
94.1 |
|
4 |
19.4 |
30 |
76.0 |
56 |
94.2 |
|
5 |
24.3 |
31 |
78.5 |
57 |
94.8 |
|
6 |
28.8 |
32 |
78.8 |
58 |
95.2 |
|
7 |
29.8 |
33 |
78.8 |
59 |
95.7 |
|
8 |
33.1 |
34 |
80.7 |
60 |
96.0 |
|
9 |
36.0 |
35 |
81.0 |
61 |
96.6 |
|
10 |
39.5 |
36 |
82.7 |
62 |
96.8 |
|
11 |
43.1 |
37 |
83.4 |
63 |
97.1 |
|
12 |
44.4 |
38 |
84.9 |
64 |
97.2 |
|
13 |
47.1 |
39 |
85.2 |
65 |
97.5 |
|
14 |
50.0 |
40 |
85.4 |
66 |
97.9 |
|
15 |
54.1 |
41 |
86.0 |
67 |
98.4 |
|
16 |
54.2 |
42 |
86.6 |
68 |
98.5 |
|
17 |
57.1 |
43 |
87.2 |
69 |
98.7 |
|
18 |
58.6 |
44 |
88.2 |
70 |
99.4 |
|
19 |
60.3 |
45 |
88.5 |
71 |
99.5 |
|
20 |
62.0 |
46 |
89.7 |
72 |
99.8 |
|
21 |
64.1 |
47 |
89.8 |
73 |
99.9 |
|
22 |
67.5 |
48 |
90.3 |
74 |
99.9 |
|
23 |
67.6 |
49 |
90.8 |
75 |
99.9 |
|
24 |
69.5 |
50 |
91.4 |
76 |
100 |
|
25 |
69.7 |
51 |
92.5 |
||
|
26 |
71.4 |
52 |
92.6 |
||
We solve the problem (NCLP) by opposition based colonial competitive algorithm and the results are shown in the table 1. The main steps in the algorithms are summarized in the pseudo code shown in figure 4.
To obtain further insights into the optimization detector locations information coverage is examined by increasing the number of detectors one by one until complete information coverage is achieved. From Table 1, we can see that as the number of added counting links increases, information coverage will increase. Information coverage for each number of counting links is in optimum state. Therefore, there are two options for estimating OD matrix:
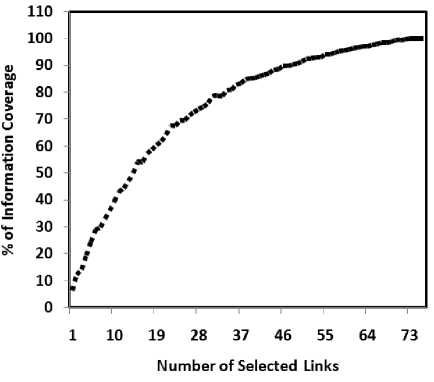
Fig. 6: Chart of experiment results
Figure 6 also shows that the observation of 76 links to achieve complete information coverage in the network. As you seen in the figure, after the selection of more than half of links, information coverage rate is reduced. For example, to increase information coverage from 90% to 100%, 29 links must be selected while the increase information coverage from 80% to 90% is needed to select 14 links. It is important to budget planning by considering the information required.
-
V. Conclusion
This paper examined the application of opposition based colonial competitive algorithm to locate traffic counting points in a road network for effective estimation of OD trip matrix from traffic counts. We formulated the problem of locating counting points on a network as mathematical programs, where fix cost for detectors installing as constraints, and the traffic information observed are taken as the objective function to be maximized. The formulated model runs using Sioux Falls network data. Our numerical examples show that OCCA has the potential for practical applications.
In the future work, cost of detectors installing can vary on each link or research can be done on network size.
// Begin of Population Initialization//
I would like to thank the anonymous reviewers for their careful reading of this paper and for their helpful comments.
Also, I would like to thank my supervisors, Dr. N. Shetab Boushehri and Dr. N. Mollaverdi, for their valuable support and encouragement, which led to the creation of this paper. I would also like to extend my thanks to my advisor, Dr H. R. Tizhoosh, for their time and feedback.
-
[1] J. N. Ostler. An institutional and economic analysis of the transportation-land use system. Master thesis, Massachusetts Institute of Technology, 1989.
-
[2] J. Walker, The acceptability of road pricing, RAC Foundation, 2011.
-
[3] K. Ashok. Estimation and Prediction of TimeDependent Origin-Destination Flows. PhD thesis, Massachusetts Institute of Technology, 1996.
-
[4] H. Yang, J. Zhou, Optimal Traffic Counting locations for Origin-destination matrix estimation, Transportation Research, 32B, 2, (1998) 109 - 126.
-
[5] Ehlert, A., Bell, M.G.H., Grosso, S., The
optimisation of traffic count locations in road networks, Transportation Research Part B, Vol. 40 , pp. 460 – 479, 2006.
-
[6] Fei, X., Eisenman S.M., Mahmassani H.S., 2007. Sensor coverage and location for real-time prediction in large-scale networks. Proceedings of the 86th TRB Annual meeting, January, Washington D.C.
-
[7] D. B. Fogel, The advantages of evolutionary computation, World science press, 1997, p.1-11.
-
[8] Atashpaz-Gargari, E., Lucas, C., 2007. “Imperialist Competitive Algorithm: An algorithm for
optimization inspired by imperialistic competition”. IEEE Congress on Evolutionary Computation, pp.4661 – 4667.
-
[9] H. R. Tizhoosh, Opposition-based learning: a new scheme for machine intelligence, Proceedings of the international conference on computational
intelligence for modeling, control and automation, Vienna, Austria, vol. I, pp. 695-701, 2005.
-
[10] Rahnamayan, S. (2007) ‘Opposition-based differential evolution’, PhD thesis, Department of Systems Design Engineering, University of Waterloo, Waterloo, Ontario, Canada.
-
[11] Azad, H.R.L., Boushehri, N.S. and Mollaverdi, N. (2012) ‘Investigating the application of opposition concept to colonial competitive algorithm’, Int. J. Bio-Inspired Computation, Vol. 4, No. 5.
Author’s Profile

Hamid Reza Lashgarian Azad is received MSc degree in Industrial Engineering from Isfahan University of Technology, Isfahan, Iran, in 2011 and his BE in Applied Mathematics from Arak University, Arak, Iran, in 2008. His research interests are in optimization, system dynamics, and decision making problems.
References An Application of Opposition Based Colonial Competitive Algorithm to Solve Network Count Location Problem
- J. N. Ostler. An institutional and economic analysis of the transportation-land use system. Master thesis, Massachusetts Institute of Technology, 1989.
- J. Walker, The acceptability of road pricing, RAC Foundation, 2011.
- K. Ashok. Estimation and Prediction of Time-Dependent Origin-Destination Flows. PhD thesis, Massachusetts Institute of Technology, 1996.
- H. Yang, J. Zhou, Optimal Traffic Counting locations for Origin-destination matrix estimation, Transportation Research, 32B, 2, (1998) 109 - 126.
- Ehlert, A., Bell, M.G.H., Grosso, S., The optimisation of traffic count locations in road networks, Transportation Research Part B, Vol. 40 , pp. 460 – 479, 2006.
- Fei, X., Eisenman S.M., Mahmassani H.S., 2007. Sensor coverage and location for real-time prediction in large-scale networks. Proceedings of the 86th TRB Annual meeting, January, Washington D.C.
- D. B. Fogel, The advantages of evolutionary computation, World science press, 1997, p.1-11.
- Atashpaz-Gargari, E., Lucas, C., 2007. “Imperialist Competitive Algorithm: An algorithm for optimization inspired by imperialistic competition”. IEEE Congress on Evolutionary Computation, pp.4661 – 4667.
- H. R. Tizhoosh, Opposition-based learning: a new scheme for machine intelligence, Proceedings of the international conference on computational intelligence for modeling, control and automation, Vienna, Austria, vol. I, pp. 695-701, 2005.
- Rahnamayan, S. (2007) ‘Opposition-based differential evolution’, PhD thesis, Department of Systems Design Engineering, University of Waterloo, Waterloo, Ontario, Canada.
- Azad, H.R.L., Boushehri, N.S. and Mollaverdi, N. (2012) ‘Investigating the application of opposition concept to colonial competitive algorithm’, Int. J. Bio-Inspired Computation, Vol. 4, No. 5.
