An astute SNA with OWA operator to compare the social networks

Author: Poonam Rani, M.P.S. Bhatia, Devendra K. Tayal
Journal: International Journal of Information Technology and Computer Science @ijitcs
Article in issue: 3 Vol. 10, 2018.
Free access
This paper mainly focuses on the development of quantitative approach based algorithm for comparing the social networks. Firstly, comparison of social networks can be done on different parameters at all the three levels – network, group and node level characteristics. Secondly, for getting more accurate results, the paper has incorporated weights to these parameters according to their importance. For addressing these two, the paper has taken an advantage from the Ordered Weighted Averaging (OWA) operator in the proposed algorithm. This algorithm outputs one quantitative value for each of the social network, on which the comparison has to be made. This paper has also employed the Gephi tool, in order to accomplish the quantitative and graphical comparison between the social networks. The analysis has been done on multiple varied social network data sets. This paper has made an effort to analyze, which among them is better in terms of connectivity and coherency factors. The paper takes into account six vital metrics of the social networks so that there will be low complexity with high accuracy. They are average degree, network diameter, graph density, modularity, clustering coefficient and average path length. The proposed SNA approach is very advantageous for finding the potential group suited for a particular task in different areas like identification of criminal activities, and more fields like economics, cyber security, medicine etc.
Gephi, OWA (Ordered Weighted Averaging), Social Network, Social Network Analysis (SNA)
Short address: https://sciup.org/15016247
IDR: 15016247 | DOI: 10.5815/ijitcs.2018.03.08
Text of the scientific article An astute SNA with OWA operator to compare the social networks
Published Online March 2018 in MECS
A social network [1]-[4] is defined as a set of nodes, where each node depicts a social circle on its own, connected with each other via links The social structure, which defines the network, depicts a relationship among the nodes. This relationship is central to the very existence of the mankind. One can identify a social group, nearly anywhere around them, including the social circle in the office and family. The social networks examples are pervasive, and widespread in the areas like representing the friendship linkages in the online social networking sites (Facebook, Twitter), offline social groups that are concerned with business opportunities, groups of people concerned with an activity. Thus, it is crucial to study the parameters affecting the modeling of these social networks. This allows analyzing the ties, relationships, and nodes of any network beholding importance in a particular task. The study and analysis of these ties named as social network analysis, helps in identifying the patterns and also to examine network dynamics. The social network analysis [4]-[6] is made up of variety of different small tasks - identification, extraction, visualizations, classification, comparison, modification and molding of the social networks. All of these tasks have varied advantages and importance in the real world. The social network analysis is useful in wide range of disciplines. SNA helps in identifying key nodes in a network, to determine the leader in a network. It is used to predict terrorist attacks by the prominent groups of major associations. The vast span of the applications of social network analysis makes it a crucial domain of study. The scientists and researchers are pouring in the resources to apply concepts of machine learning, and artificial intelligence to make the progress in this field. Thus, it makes sense to develop a quantitative algorithm, which helps in enhancing the quality of results obtained by one such fragment of SNA, namely, the comparison of the social networks.
Comparing the social networks is one of the potential challenging tasks in the SNA as discussed in our previous work [5] under communication. It can be used as the vital part of the SNA for its fruitful application in various diverse fields. One might wonder the uses of the comparison operation, and the need for such an important task. There are numerous reason why this is a vital and mandatory operation. The comparison helps in addressing the issue of identifying the criminal group among the innocent groups. It also helps in finding the most favorable group for a pathogen attack. It is used in sciences to compare similar tailored networks to find the optimal network. So, this work is very advantageous for finding the potential group suited for a particular task in the areas like identification of criminal activities, and more fields like economics, cyber security, medicine etc. So, the comparison of the social networks has its influence in so many areas, that it is only logical to explore the comparison by imploring all the possibilities to make it an easier and efficient task. So the paper has focused on developing the quantitative approach based algorithm for comparing the multiple and diverse social networks. The comparison of the social networks involves taking in as input, a number of social networks, with certain fixed parameters, and the task is to identify which among the networks is a perfect fit for a criteria. This criterion is decided based on the need for the comparison, like, in a case of comparing the online social networks, and to determine which network will help in dispersing the important information the fastest. Now, the criteria for such a network selection is to find the network with best connectivity, i.e. shortest average path length, and highest clustering coefficient. The metrics of the social networks are the parameters, which capture the essence of social networks. These are the ones, which help us to distinguish between the networks, and are used as a basis for the comparison of the networks. Some of such metrics are degree centrality, betweenness centrality, closeness centrality, node centrality, average shortest path, density, page Rank and clustering coefficient etc. The details of these metrics are provided in the consequent section.
Firstly, we need to compare these social networks on the number of parameters of the social network at all the three levels – network, group and node level characteristics for good results. Secondly, for getting more accurate and robust results, we need to associate these parameters with some weightage or importance factor. For addressing these two above needs, we have exploited the OWA operator [7]. So, the paper has compared the social networks by using an operator called Ordered Weighted Averaging (OWA) operator. The basic intuition behind using an averaging operator is to be able to compare networks based on many metrics. Since, the metrics of social networks are varied in nature, a simple averaging operator would not serve the purpose well. The OWA operator is applied by formulating an algorithm, which helps in furnishing an output value. This output value can then directly be used to compare various social networks and get the results instantly with much more precision. The OWA operator is advantageous over other averaging operators as it assigns a priority or some weightage value to every metric taken into consideration. This in turn, helps us to control the importance of metrics while comparing social networks. The comparison we have done in this paper is purely quantitative in nature, with a tinge of the graphical methodology. This paper has also explored the Gephi [8] tool, in order to accomplish the quantitative and graphical comparisons between the social networks. The metric values are obtained in a definitive manner using the visualization and analysis tool called Gephi. The analysis has been done on the multiple and varied social network data sets. The comparison is carried out on various networks based on size viz. small, medium and large. This paper has made an effort to analyze, which among these is better in terms of connectivity and coherency factors. The paper has taken into account six vital metrics of the social networks so that there will be low complexity with high accuracy. They are average degree, network diameter, graph density, modularity, clustering coefficient and average path length. These parameters are chosen because they tend to encompass the complete scenario of the social network in terms of coherency and connectivity. The comparison done in this paper is very generic, simple and purely quantitative in the nature. The efficiency of the algorithm results is measured in terms of both time and space complexity. Besides efficiency, the results shown by the proposed algorithm are precise and accurate.
In this paper the work has been subdivided into various sections. In the Ist section, we have provided an overview of the paper. In the IInd section, we have presented the related work. In the IIIrd section, we have given the list of important concepts or metrics parameters in the social networks. In the IVth section, we have given the introduction of the OWA operator. In the Vth section, we have discussed about the comparisons of the social networks. In the VIth section, we have introduced and explained our proposed algorithm. In the VIIth section, we have provided our results from using five datasets from GephiGitHub website. In the VIIIth section, its various application fields have been proposed. In the IXth section, challenges and future directions have been stated. At the end, a well-formed conclusion is given.
-
II. Related Work
Faust [9] has done the comparison of social networks on metrics like size, density and triad censuses. They have explored similarities in local structure properties among 51 social groups using triad census measuring different relational contents like friendship, advice, encounters, victories in fights, dominance, etc. Perkins et al. [10] have presented the comparison of social networks derived from ecological data. They have done study on rats. They have worked efficiently for the comparison of the specific social networks. They have shown how radio-tracking and capture–mark–recapture data collated from wild rodent populations can be used to generate contact networks. They have taken into account a few metrics like average contact rate, closeness and betweenness centrality, and connectedness score to compare social networks. The distribution of contacts has been presented by a negative binomial probability distribution. The outcome is a value, which depicts how well connected the social networks are on the basis of the selected parameters. The approach they have designed is only suitable for some particular social networks. Lippold and Burns [11] have presented a comparison between social networks of adults with intellectual disability and those with physical disability. They have compared social networks based on statistical measurements on factors such as social support, functional support and life experiences. These parameters are relevant to the study to determine the social behavior of nodes in the network. Their families form an important part of their network. The factors -Life Experiences Checklist (LEC), intellectual disabilities (ID), and physical disabilities (PD) are used to compare the network capability. The most significant finding they have provided which is the underlying hypothesis of this study is that the PD group has significantly more people in their social circle. This is true across the range from close friends to acquaintances, once again supporting the hypothesis that people with ID have more restricted networks than people with PD. These parameters are relevant to the study to determine the social behavior of nodes in the network. The statistics applied to this problem gives optimal results, as they have been specifically tuned to work for this model. Johnson et al. [12] have compared “the email networks and the survey-based social networks in a bank”. They have related the email networks to survey-based social networks, but with some differences. They have done the case study of a bank. They have used the survey of the ego networks of the employees. They have explored exponential random graph (ERG) models. They have investigated that off-line social networks are strongly shaped by gender, tenure, and hierarchical boundaries. The role of these boundaries is much weaker in the email network. The proposed approach in our paper is a more general one, which enables us to work on different types of diverse networks simultaneously.
-
III. Social Network Metric Parameters
Social Network Analysis (SNA) involves focusing on the different features of the social networks, which means redefining the relations existing in the networks. Prior to resolving to do this work, we started by exploring various metrics, which encompass the uniqueness of a social network. These parameters have evolved during the ages, and continue to grow more in number and diversity. They give the insight into the ties of the social network, and contribute majorly to the understanding of the network. The parameters, which are widely used to distinguish among the social networks, are highlighted to shed more light on the matter. Many online sites, and the social circles enable the economy of the social networks to increase drastically. Currently, the social network analysis has become a humungous topic, which is widely researched and draws a lot of attention of the researchers. We have listed below various important metrics from [1]-[4],[13] for the analysis of social networks.
-
A. Size
This parameter defines the number of node(s) in the network under study. This parameter is the primary attribute used for the comparison as well as for the classification tasks in the social networks. The majority networks under study may be generally of the same or different sizes.
-
B. Density
The density metric is the ratio of the current number of the links in a network to the maximum number of possible links, when each node is connected to every other node of the network. The density parameter is quite useful in terms of how closely connected the nodes are in the network. The density of a network may vary from sparse - less value to highly dense - higher value. The connectivity of network is directly proportional to the density.
-
C. Diameter
Diameter is defined as the shortest distance between the two farthest nodes. It is useful to calculate the slowest path in the network, which determines the critical path in the network.
-
D. Average shortest path
The average shortest path is for checking on the connectivity of the network. It is basically the mean of the path length between any two nodes. It is used to find the best connectivity between two nodes in a network.
-
E. Nodal Degree
This metric concerns with the number of links that are incident with the current node in consideration. It helps in deciding the popularity of the node in a network.
-
F. Node betweenness centrality
This measures the frequency with which a node occurs in the path of other nodes. Betweenness is quite useful in finding the central node. The most connected node is determined by finding out the highest frequency node.
-
G. Node closeness centrality
It is used to indicate how much the node is close to other nodes in the network. This could be very useful when the consideration is router placement.
-
H. Node Degree centrality
Degree is basically the number of nodes that are connected to it directly. It shows the direct span of the nodes in the network.
-
I. Eigenvector centrality
This is called as a recursive version of node degree centrality. The node with the highest frequency is a part of the most popular sub-graph of the network.
-
J. PageRank
It is an algorithm developed by scientists at Google Inc. to rank the popularity of the web pages. It is an important metric for rating online pages, and to devise a ranking system for publications.
-
K. Motif
Motif is an important property defining the statistical pattern in a network. It indicates the general flow in the graph.
-
L. Clustering coefficient
This coefficient is used to measure the degree to which the nodes have a tendency to form a cluster in the network. This coefficient depicts the closeness of a particular set of nodes to each other.
-
M. Degree distribution
It is associated with the node degree centrality; this denotes the probability distribution of the degrees of the complete network. It helps in determining the distribution of popularity in the network.
-
N. Assortativity
It is the inclination of a particular node to another node in the network. This affinity is important when defining some special relations in a network.
O. Distance
The distance parameter is for a pair of nodes in a network, it defines as the work it takes to get information transferred from one node to the other. Alternatively, it may also be defined at the number of the edges between the two nodes. It helps in calculating the path cost for transfer of information.
-
P. Modularity
Modularity measures the strength of the network, when divided into sub-groups. It typically denotes how many well-formed sub-groups are present in the current mother network.
-
Q. Efficiency
It is measured using the number of nodes that can access vast number of other nodes. It is related to the average path length. Both of these promote a healthier communication among the nodes of the network.
Based on the above stated metrics, several researches have been carried out in the social network analysis. It is comparatively harder to take into account each one of these metrics while judging a network, and hence it is important to consider the most important and general metrics.
Now, looking at the evaluation method of the metrics, which would be used to classify, or compare the social networks as given in Table 1. It comprises of the methods to evaluate the metric values for a given social network, with n nodes, e edges, d(x,y) shows the path between nodes x and y. The social network taken into consideration has the following properties-
-
• An undirected graph, i.e. the edges which connect two nodes are undirected in nature.
-
• A non-weighted graph, the weight of each edge in the graph has a uniform weight of one unit.
The evaluation methods of different metrics of a social network, makes it certain that the calculation procedure is not a tedious task. It only requires one to plug in the values and obtain the results effectively, as will be discussed and shown in the later sections. One can take all these above metrics if suitable for the criteria but if we include all these attributes, complexity of system will increase with the number of attributes and result in less accurate results and findings, as accuracy also decrease with number of attributes. So, we should always try to take the limited attributes so that there will be less complexity and high accuracy in system. Hence, this paper has selected six metrics of the social networks with complete certainty in the attributes so that there will be low complexity with high accuracy with simple experiments. But for hard real time system we can tolerate with less accurate results. But they should be taken wisely so that information must not be lost. There are a variety of tools available, which help us to calculate such parameters by a click of a button. One such tool is a Gephi, which has been explored in this paper to calculate the values of the required metrics for the working of the algorithm. Geph i is an open source interactive visualization and exploration package for all the platforms and for all the kinds of networks and complex systems, dynamic and hierarchical graphs. It is a widely known social network analysis tool, which has userfriendly interface. This tool is best suited for the visualizations from small to very large social networks.
Table 1. Mathematical function to evaluate metrics in SNA
|
Metrics in SNA |
Evaluation of metrics |
|
Size |
n; Number of nodes |
|
Density |
e n * (n — 1) 2 e: Number of edges |
|
Average Shortest Path |
* . 1 I'- ' i*j |
|
Degree Centrality |
r z != 1[cD(y*) —СВ(У , )] c d (G) = |
|
Closeness Centrality |
1 ССО = V 1 Z y d(y,x) |
|
Betweenness Centrality |
r r x V OtO) СвО) = 2 Ost s*v*tev |
|
Eigenvector Centrality |
^ v =12a v,t .* t t=G |
|
Clustering Coefficient of ith node |
Cl i (G) = z( #((jk eG,k* j,(j,k)€Ni(G)))/^i#(jke G,(k*j),((j,k)ENi(Gy)) |
-
IV. Ordered Weighted Averaging (OWA) Operator
Yager [7] first introduced the Ordered Weighted Averaging (OWA) operator in the year 1988. Now it has
become widely used technique, especially for dealing with the problems of decision making like MCDM (multi-criteria decision making) and GDM (group decision making). The OWA operator function in a way to produce a result by taking the aggregation of the given values, each have a particular weight value associated with them. The mathematical notation for the operator, is given by
F(a 1 , a2,.., an) = W^ + W2b2+... Wnbn (1)
Here, b [ is the largest element in the collection, a 1 , a2, ... a „ is the set of elements based on which the decision is to be made for comparison. The W is the weight vector associated with the operator. The order in which the elements are arranged is descending, this is irrespective of the constraints fed into the function F. The OWA operator works between the two extreme (AND, OR) operators. The basic intuition behind using OWA operator is that ‘most’ of the given constraints should be satisfying the criteria, instead of all or at least one. The unique functionality of the OWA operator is its ability to incorporate the varied criteria into a single picture. It makes an informed decision by taking an aggregate according to the weight vector, W, provided to the mechanism. The conditions that must be satisfied for using the operator are given below.
Let, the OWA operator be of dimension n, when associated with function F, and a weighting vector W,
- W1-W2
W =
.
LwJ
In (2), there are two conditions which needs to be satisfied-
-
1. W , E (0,1)
-
2. ZWi = 1
Provided that the conditions hold, the value of function F can be specified as in (1). The applications of OWA operator have surfaced in many fields viz. -decision making [14], doctoral student selection problem [15], minkowski distance [16], data mining [17], information retrieval using metasearch [18], sports management [19], relationship aggregation in social network analysis [20], and regression problems [21] etc. The following sections aim at using this operator to take a collaborative decision to decide the effectiveness of the social network based on the metrics specified previously for the comparison of social networks.
The metrics like degree centrality and network diameter are by their natural virtue not constrained to the interval of (0, 1) inclusive of the end points. The inclusion into this interval is crucial to the application of OWA operator to analyze the strengths and weakness of a social network. Thus, an algorithm is proposed which takes into account this aberration and aims at tackling this problem to be able to produce better results at making a comparison of social networks at micro level.
V. Comparison of the Social Networks
There are varieties of social networking sites currently existing like Facebook, YouTube, Twitter, Instagram, LinkedIn, Reddit, VK, Tumblr, Pinterest, Google Plus, Flickr, meetup, Ask.fm, LiveJournal and myspace. People form their own social networks using these sites to meet their requirements. The social networks are the most dynamic, powerful and all-purpose tools for all the classes of people. They facilitate people to collaborate, share and express their own thoughts, opinions or past experiences. They also help people to learn, get influence and even get better job opportunities easily. They use structured, unstructured, multilingual, audio, video and all types of data or information efficiently and astutely. These social networks have variable and dynamic characteristics, properties and dimensions. They may be directed/undirected, weighted/unweighted, heterogeneous/homogeneous, real/virtual, static/dynamic, offline/online, single-relation/ multirelation, one-mode/multi-mode, egocentric/Sociocentric, Single-level/multi-level, classical/overlapped, mobile-based/web-based etc. as discussed in [5] our earlier work under communication. So comparing of these social networks is very difficult and cumbersome task. It may be a NP complete problem if all the parameters or metrics are to be considered. These multiple social networks can be differentiated based on different factors for the comparison of social networks. That is, if we define and fix some pre-criteria and parameters for comparison it may be accomplished to some extent. So, this section has presented the task of comparison of the social networks.
The Comparison of the social networks is defined as the process of comparing two or more social networks based on the pre-decided factors, and drawing a conclusion about the queries asked in the beginning of the process. The results of this comparison is to determine which network among the lot is better suited for a particular task, and identification of the advantages and disadvantages of the social networks when compared based on the certain factors. The social networks are generally compared based on the parameters/metrics mentioned previously. The metrics are important characteristics to define any social network. Whenever there is a need to compare the social networks, there comes number of issues or challenges to be faced during the analysis. They are following –
-
• Whether one can make use of either a single metric or multiple metrics.
-
• If multiple matrices are used then which parameters/metrics are to be selected?
-
• Which parameter should be given the maximum importance?
-
• Which methodology is to be selected while
comparing?
-
• Which sizes are to be taken into consideration?
-
• What will be the accuracy of the parameters to be used?
All these, above mentioned decisions or issues have pestered the researchers in the field of social sciences for the ages. Hence, the comparison of the social networks has been a hot topic of research, which is carried out to solve varied issues in the various domains. Thus, the use of an operator is proposed to distribute the weights in such a way, which gives fair results. This enables the user to choose many unrelated parameters, and handles them correctly. The operator also has to handle a large number of parameters, and provides them with the different priority. This priority handling is achieved by using the weight vector. In the proposed algorithm, the weight vector is chosen to be of Gaussian distribution to provide the least and greatest value with the highest priority. The Gaussian distribution is best suited because of the choice of parameters in the algorithm.
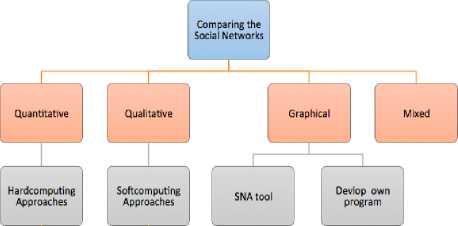
Broadly the comparison of the social networks may be done mainly on the following four approaches –
-
1. Quantitative approach,
-
2. Qualitative approach,
-
3. Graphical approach and
-
4. Mixed approach.
Various aggrgation operators
Fuzzy logic, Rough sets etc.
Fig.1. Broad approaches for the comparison of the social networks
In the quantitative approach, predetermined fixed numbers of variable or metrics are used for computation. These metrics are first measured quantitatively and then hard computing methods are used on these metrics, for getting the quantitative results. We may simple aggregate these metrics or use some special aggregation operators on them. So, in quantitative approach, the parameters for computing are fixed and if any of the parameter value is missing, uncertain and incomplete then we cannot get the results in this case. Here parameters are assumed to be fixed, certain and complete. The qualitative approach is used when there is uncertainty in the number and values of the attributes or parameters. For addressing these, we may often use soft computing techniques like Fuzzy logic [22], rough sets [23] etc. In the graphical approach, we may use already existing SNA tools to visualize and to compare the parameters of the networks. We may even write our own algorithms for the same. In the mixed approach, we may combine any of the above-discussed approaches. The broad classification for comparing of the social networks depending on the approaches used is shown in below Fig. 1.
We have proposed one mixed approach using quantitative and graphical approach in the next section. We have employed six important and vital metrics for the calculation purpose shown in Fig. 2.
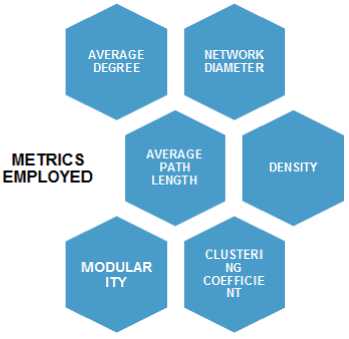
Fig.2. Metrics employed in the proposed algorithm
The SNA tool – Gephi for the quantitative and graphical analysis purposes is also explored.
VI. Proposed Algorithm
This section has presented the proposed algorithm pseudo code. The algorithm has taken in as input M number of social network graphs with parameters like number of nodes, number of edges, the edges catalogue -each edge between two nodes, and many more characteristics. The graph is loaded into various formats of graph files, like .gml into the Gephi tool. Therefore, the model for the input of the social network is graphical model, as opposed to matrix model. Now, looking at the algorithm for the comparing social networks, as given below. The parameters upon which the comparison of social network is done are six parameters supported by the Gephi. They are average degree, network (n/w) diameter, graph density, modularity, clustering coefficient and average path length. These parameters are chosen because they tend to encompass the complete scenario of the social network in terms of coherency and connectivity. The coherency of a network can be understood by looking at the symphony among the nodes and their relations. The factors such as clustering coefficient and modularity are responsible for determining the coherency of a social network. Whereas, the connectivity is purely in terms of physical links present in the social network, which looks at the closeness of the nodes in a network in terms of length, or cost of a path. These terms can be measured by average path length, and diameter. They together serve as a good bunch of metrics to compare the social networks. The proposed algorithm is a scalable, which can be used for more metrics depending on the user requirement and its application. The algorithm is able to achieve a good time complexity of 0 (mn In n), n is the number of metrics taken into consideration, and m is the number of social networks taken for comparison.
Algorithm Quantitative Social Networks
Comparison
Input: M social network graphs (SN1, SN2… SNM)
Output: SNi, where SN is the best connected network previous = 0
for I = 1 to M
-
1 Calculate normalized values of parameters in consideration, each value is in [0,1]
-
-- Vector B of size n, n is the no. of metrics
-
2 Assign weight vector, W for OWA operator
-
3 Distribute the weights in Gaussian manner
-
--OWA Operator Working
-
4 for i=1 to n
Arrange B, in descending order end for
-
5 Initialize val_network ← 0
-
6 for i=1 to n
val network^ W,* B, + val_network end for
-
7 if val_network > previous
answer = I previous = val_network end for return answer
In the first step, we calculated the normalized parameter values for a social network using the tool Gephi. In second step, we assigned the weight vector its values using a random number generator. While in third step, we ensured that values of the W vector are distributed in the Gaussian manner, i.e. the values follow the bell curve. This helps in giving more weightage to metrics with mediocre value ranges, than to average path or diameter, which needs to have the least weightage to achieve correct results. In the fourth step, parameter values are set in descending order using a simple sorting algorithm like bubble sort, or even manual sort. In the fifth step, we have initialized the value of val_network to zero. In step 6, we have added to val_network the product of B , and W , . Thus, we got the value to be used to compare the social networks. The algorithm is to be repeated for the multiple social networks and the value is compared. The resulting comparison is based on which network has higher value of the val_network. The simplicity of the algorithm is its major advantage. The social network analysis, in general, is a tiring and onerous task. If an algorithm tries to simplify it by making use of lesser parameters, it is considered a feat. This is the exact reason to justify the success of the proposed algorithm. Looking at the application of the algorithm on varied datasets, and comparing the results will give more insight into the working of the algorithm.
-
VII. Experiments Results
For presenting the findings and results of our proposed algorithm, this section has taken into consideration four different data sets collected from the Gephi GitHub website [24]. The Gephi tool has been explored for the graphical analysis of the datasets. Th e dataset (DS) consists of four social network graphs named DS1-DS4. The figures are explaining the very basic properties like the number of nodes, the number of edges, whether the graph is directed or undirected. Fig. 3, 4, 5 and 6 depict the four datasets taken into account. Dataset 1 is directed social network having 77 nodes and 254 edges as shown in fig.3. Dataset 2 is also directed social network having 1538 nodes and 8032 edges as shown in fig.4. Dataset 3 is undirected social network having 34 nodes and 78 edges as shown in fig.5. Dataset 4 is also undirected social network having 53 nodes and 179 edges as shown in fig.6. The proposed algorithm has been applied to all for datasets. It evaluates the final value, by using, which the comparison of the social networks has been made. Table 2 contains the normalized values of the average degree, network diameter and graph density. Table 3 contains the normalized values of modularity, clustering coefficients and average path length. After running the proposed algorithm presented in the preceding section, the val_network of all four DSs are find out and their value is mentioned in Table 4. DS1 val_network comes out to 0.201197, which is max of all as shown in table 4. Thus, among the four DS1-DS4 networks, DS1 is better in terms of connectivity and proximity after combining the three level analyses. Its linkage can confirm this, which is very close besides the other characteristics. Among DS2-DS4, DS3 val_network comes out to be 0.130704, which is maximum of all three. So DS3 is at second place. On third place is DS4. DS2 val_network comes out to be 0.080114, which is minimum out of all four social network.
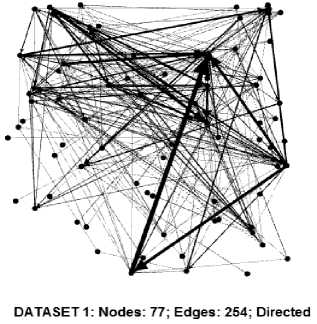
Fig.3. DS1
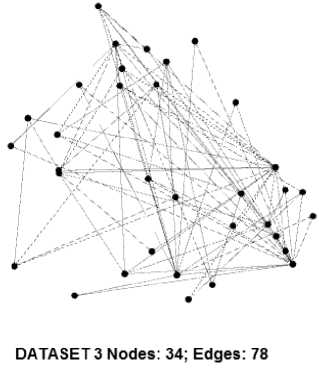
Fig.5. DS3
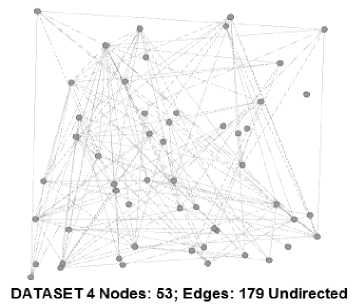
Fig.6. DS4
Table 2. Normalized values of parameters for all data sets
|
Avg. Degree |
N/w diameter |
Graph Density |
|
|
DS1 |
0.0868 |
0.0196 |
0.087 |
|
DS2 |
0.0067 |
0.00149 |
0.007 |
|
DS3 |
0.139 |
0.03846 |
0.07 |
|
DS4 |
0.129 |
0.04469 |
0.065 |
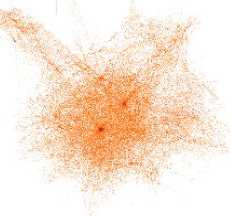
DATASET2: Nodes: 1538; Edges: 8032; Directed
Fig.4. DS2
Table 3. Normalized values of parameters for all data sets
|
Modularity |
Clustering Coeff. |
Avg. Path Length |
|
|
DS1 |
0.557 |
0.736 |
0.01039 |
|
DS2 |
0.464 |
0.216 |
0.00063 |
|
DS3 |
0.416 |
0.285 |
0.01633 |
|
DS4 |
0.295 |
0.147 |
0.01889 |
Table 4. Results of the algorithm for the datasets
|
DATASET |
val_network |
|
DS1 |
0.201197 |
|
DS2 |
0.080114 |
|
DS3 |
0.130704 |
|
DS4 |
0.098257 |
-
VIII. Advantages and Various Applications Fields of the Proposed Work
The advantages set this algorithm apart from the previous techniques to compare the social networks. The algorithm is generic and can be used to compare varied social networks. It provides faster calculation of the best-fit social network for a particular connectivity. The algorithm takes into account six metrics for comparing social network and outputs the result taking all of them into account. The weights or important factor is assigned to the different metrics of the social networks. It is a scalable for more number of metric parameters too. The ease of the algorithm makes it a strong competitor in the evaluation terms.
The applications of the comparison of the social networks are prevailing in the number of fields. The importance of the social network analysis is so vast and important that it makes impossible to not expend resources on it. The industry is all built on the relations and the nodes are the very people working in it. Few of the many application areas where our proposed work can be deployed are following –
-
A. Terrorism and crime investigation
-
• Analysis of social networks empowers the data scientists to predict crucial crisis in the terrorist activity.
-
• The comparison of social network to identify the terrorist activity to counter its effects may be a major application. The parameters that may play an important role to distinguish the terrorist group from an innocent group are clustering coefficient, isolation factor, and direction of the relationships. Thus, we can see how we can use this algorithm to figure out this problem.
-
B. Academics
-
• This may be used for finding the potential student or faculty groups among their different existing social networks. A good project work may be assigned to this potential group for getting better performance and results.
-
C. Medicine
-
• Analysis of disease enhancement networks, to capture the risks of failure of a network communication by virtue of spread of a disease.
-
D. Robotics
-
• The comparison among the movement networks to determine which path to follow to reach the destination in shortest time, or by saving maximum energy.
-
E. Finance and Business
-
• The statistical analysis of social networks of companies is done to predict rise or fall in price of stocks.
-
F. Environmental Sciences
-
• The comparison of social networks may enable the scientists to best fit the category for a specific purpose like in case of nodes to edges ratio for a sustainable social environment.
Comparison may helps in cementing the ideas of social networks in learners’ understanding and makes it less abstruse for further work.
-
IX. Challenges and Future Direction
There are certain challenges that may be overcome to obtain better results for the comparison of social networks.
-
A. Handling uncertainty:
The uncertainty in network information these days, with the advent of changing conditions makes the metric information less reliable. This problem may be tackled by introducing a qualitative methodology that can take care of this uncertainty factor.
-
B. Dynamic Comparison:
The networks are becoming more and more dynamic because these are getting wider. The number of nodes keeps on adding and this changes the network dynamics, which may be overcome by recording the metrics timely or periodically. Finding stable patterns from this number of periods and using these stable patterns getting comparison results.
-
C. Communication types:
We may also compare the social networks on the type of quality of communication between nodes like positive, negative and neutral between the nodes. One example is whether there is positive, negative or neutral talk depending upon the content of communication.
-
D. Handling multidimensional model:
The comparing of the social networks with multinodes and multi-relations is one of the challenging tasks for researchers in this field.
-
E. Big data comparison:
The power of social networks is making it fall into the category of big data. Handling big data needs data analysis and coming up with intelligent solutions to manipulate them efficiently with the help of data scientists.
Work in this direction may be continued and made feasible for the advancement in science and understanding of mysterious phenomenon like patterns in social circles. Therefore, the work has lots of potential in social network analysis, and the algorithm provided takes it one step further. These issues may be tackled with a different approach in the future work.
-
X. Conclusion
The paper has effectively carried out the comparison of varied social networks by making use of an astute OWA operator. The OWA operator deployed here for getting more robust results by including number of metric simultaneously. The comparison approach used here is quantitative in nature, and other types of comparison methodologies possible are qualitative, and graphical. These may be employed too, which may give a different outlook to compare the social networks. The algorithm’s ability to be scalable helps in overcoming the partial problem of a vast database. The complexity of the algorithm also helps in the computing power of the system, which would use comparison as its pre-requisite. The applications of comparison of social networks are also stated which tells us how important a task it is, and its usefulness. At the end, the paper has also given the potential challenges in this field. In future prospect, we have discussed about incorporating the changing trends of social networks using another qualitative approach.
References An astute SNA with OWA operator to compare the social networks
- K. Wasserman, Stanley and Faust, Social network analysis: Methods and applications, 8th ed. Cambridge university press, 1994.
- J. Scott, “Social network analysis.” Sage publishers, 2012.
- M. Hanneman, Robert A and Riddle, Introduction to social network methods Ta. University of California, 2005.
- M. O. Jackson, Social and economic networks. Princeton university press, 2010.
- P. Rani, M. P. S. Bhatia, and D. Tayal, “A Survey on the Social Networks – Types , Operations , Models , Tools and Applications,” Submitt. Publ. ACM Surv.
- C. T. Butts, “Social network analysis: A methodological introduction,” Asian J. Soc. Psychol. Wiley Online Libr., vol. 11, no. 1, p. (13-41), 2008.
- R. R. Yager, “On ordered weighted averaging aggregation operators in multicriteria decisionmaking,” IEEE Trans. Syst. Man. Cybern., vol. 18, no. 1, pp. 183–190, 1988.
- M. Bastian, S. Heymann, and M. Jacomy, “Gephi: An Open Source Software for Exploring and Manipulating Networks,” Third International AAAI Conference on Weblogs and Social Media, 2009. [Online]. Available: http://www.aaai.org/ocs/index.php/ICWSM/09/paper/view/154%5 Cnpapers2://publication/uuid/CCEBC82E-0D18-4FFC-91EC-6E4A7F1A1972.
- K. Faust, “Comparing Social Networks : Size , Density , and Local Structure,” Metod. Zv., vol. 3, no. 2, pp. 185–216, 2006.
- S. E. Perkins, F. Cagnacci, A. Stradiotto, D. Arnoldi, and P. J. Hudson, “Comparison of social networks derived from ecological data: Implications for inferring infectious disease dynamics,” J. Anim. Ecol., vol. 78, no. 5, pp. 1015–1022, 2009.
- T. Lippold and J. Burns, “Social support and intellectual disabilities: a comparison between social networks of adults with intellectual disability and those with physical disability,” J. Intellect. Disabil. Res., vol. 53, no. 5, pp. 463–473, 2009.
- A. Johnson, Rebeka and Kov{’a}cs, Bal{’a}zs and Vicsek, “A comparison of email networks and off-line social networks: A study of a medium-sized bank,” Soc. Networks, Elsevier Publ., vol. 34, no. 4, pp. 462–469, 2012.
- J. Alhajj, Reda and Rokne, Encyclopedia of social network analysis and mining. Springer Publishing Company, Incorporated, 2014.
- R. Full{’e}r, “OWA operators in decision making,” Explor. Limits Support Syst., vol. 3, pp. 85–104, 1996.
- S. Carlsson, Christer and Full{’e}r, Robert and Full{’e}r, OWA operators for doctoral student selection problem. Springer, 1997.
- A. M. Merig{’o}, Jos{’e} M and Gil-Lafuente, “Using the OWA operator in the Minkowski distance,” Int. J. Comput. Sci., vol. 3, no. 3, pp. 149–157, 2008.
- V. Torra, “OWA operators in data modeling and reidentification,” IEEE Trans. Fuzzy Syst., vol. 12, no. 5, pp. 652–660, 2004.
- V. V De, Arijit and Diaz, Elizabeth E and Raghavan, “On fuzzy result merging for metasearch,” in Fuzzy Systems Conference, 2007. FUZZ-IEEE 2007. IEEE International, 2007, pp. 1–6.
- A. M. Merig{’o}, Jos{’e} M and Gil-Lafuente, “Decision-making in sport management based on the OWA operator,” Expert Syst. Appl., vol. 38, no. 8, pp. 10408–10413, 2011.
- M. Brunelli, Matteo and Fedrizzi, “A fuzzy approach to social network analysis,” in Social Network Analysis and Mining, 2009. ASONAM’09. International Conference on Advances in, 2009, pp. 225–240.
- G. Yager, Ronald R and Beliakov, “OWA operators in regression problems,” IEEE Trans. Fuzzy Syst., vol. 18, no. 1, pp. 106–113, 2010.
- L.A.Zadeh, “Fuzzy Sets,” Inf. Control, vol. 8, no. 3, pp. 338–353, 1965.
- Z. Pawlak, “Rough sets,” Int. J. Parallel Program. Springer, vol. 11, no. 5, pp. 341–356, 1982.
- “Datasets @ github.com.” [Online]. Available: https://github.com/gephi/gephi/wiki/Datasets.
