An automated detection of CAD using the method of signal decomposition and non linear entropy using heart signals

Author: Padmavathi C., Veenadevi S.V.
Journal: International Journal of Image, Graphics and Signal Processing @ijigsp
Article in issue: 2 vol.11, 2019.
Free access
The Coronary Artery Disease (CAD) which is one among the major class of cardiovascular diseases is emerging as an epidemic in the society and has proven to be the leading cause for more number of deaths when compared to the other cardiovascular diseases. It is emerging as one of the threats to the economy. It has become very important to detect CAD in its early stage which can help society in a broader way by saving a significant number of lives. The proposed method is a novel efficient automated approach which is capable of detecting CAD among the large group of patients using Electrocardiogram (ECG) signal. The system design provides a complete model of pre-processing of ECG, finding the heart rate which is further decomposed up to 4 level sub-bands using analytic transformation based signal decomposition method. The signal decomposition method is used to analyze the low frequency components of the signal and to deal with non stationary nature of heart signals. Two Non-linear entropy estimators as K-Nearest Neighbor (K-NN) and Correlation entropy are applied to decomposed sub- bands obtained after applying Analytic wavelet transformation based flexible decomposition technique to extract non-linear dynamics. The clinical significant features from the large data set can be selected by employing wilcoxon ranking method which assigns ranks on the applied signal. Further, an entropy-based classification approach and a suitable classifier namely Linear support vector machine (L-SVM) is used to classify among CAD and normal class. The algorithm is simulated in MATLAB and it is found that the results matched closely with the available data. This computer-assisted automated system which characterizes the heart signal can serve as an aid for the cardiologists in their daily screening of a large number of patients and can be used in primary health care centers which help the physicians in the early detection of a CAD.
Coronary artery disease (CAD), Flexible Analytic Wavelet Transform (FAWT), Linear support vector machine (LSVM), Correlation entropy
Short address: https://sciup.org/15016032
IDR: 15016032 | DOI: 10.5815/ijigsp.2019.02.04
Text of the scientific article An automated detection of CAD using the method of signal decomposition and non linear entropy using heart signals
Published Online February 2019 in MECS
In recent times, the heart related problems are emerging as the fundamental cause of death worldwide. Each year nearly 17 million people lose their life due to heart related problems globally. Among the class of cardiovascular diseases, CAD is proven to have high mortality rate when compared to others [1].
CAD is referred to a condition in which the coronary artery which carries the blood to the muscles of the heart is blocked due to atherosclerosis which is referred to as hardening of arteries. This normally occurs when hard cholesterol start depositing in the arteries, which further if increased in quantity produces tiny clots which obstructs the normal flow of blood leading to the lack of availability of oxygen which in turn reduces the strength of muscles of heart affecting the regular pumping action of the heart which results in various arrhythmias and failure of the heart in general it may lead to other cardiovascular diseases [2].
Currently the health professional learn about the clinical history of the subject and suggest various diagnostic tests as: blood test, X- Ray, ECG, Computed tomography scan, Stress test, Angiography and Cardiac catheterization to detect any cardiac abnormality. All these diagnostic tests have certain complications. In some cases the accurate difference between normal and CAD affected subjects cannot be observed from the ECG recordings [3]. Other diagnostic tests as angiography and catheterization are invasive painful techniques which need to be carried out under the observation of expert physician. During the stress test it becomes necessary to attain specific heart rate and few patients fail to attain this targeted heart rate [4].
Based on the heart rate calculation itself, one cannot conclude whether a person is affected by CAD or not. Heart rate theories are still evaluating and the clinicians have different opinions about CAD affected heart rates [5]. These issues can be overcome to an extent using computerized automated support system with advanced digital signal processing techniques for the detection of cardiovascular diseases. These methods are used to extract the nonlinear information from the heart rate signal which serves as a tool to aid clinicians in diagnosing CAD.
The objective of our work is to develop a noninvasive efficient automated abnormality prediction system which can automatically detect the CAD using heart rate signal. The nonlinear and non stationary nature of heart signal is dealt with the help of flexible analytic wavelet transformation based method to divide the signal into subsequent components. Non linear entropy based parameter estimator as K-NN and correlation entropy estimator are applied to estimate non linear features present in sub bands, the entropy features extracted are used as basis to classify among normal and CAD class. In proposed work an automated linear support vector machine based classification is used to increase classification accuracy.
-
II. Related Work
The methodologies used by different researchers in the process of early detection of CAD are described as found from the survey. The conventional methods considered for the study are based on automated detection system which mainly extracts the heart rate signal from the real time ECG signal and the heart rate signals of both the normal and abnormal classes and are analyzed using time domain, frequency domain and nonlinear methods and relevant variations are seen in the range of nonlinear features for CAD and normal HR signals.
The heart rate signals are decomposed into frequency sub-bands using Discrete Wavelet Transform (DWT) in paper [3]. Principle Component Analysis (PCA), Linear Discriminant Analysis (LDA) and Independent Component Analysis (ICA) were applied on the set of DWT coefficients extracted from particular sub-bands in order to reduce the data dimension. A study of eight types of cardiac abnormalities are done and the ranges of linear and nonlinear parameters are calculated for them with a confidence level of more than 90% .The heart rate variability signal parameters, extracted and analyzed using computers, are highly useful in diagnostics is presented in paper [4].
The heart rate variability (HRV) signal for disease identification and classification which uses continuous time wavelet analysis is presented in paper [5], in which fractal dimension (FD) of heart rate signals are calculated and compared with the wavelet analysis patterns. The FD obtained indicates more than 90% confidence level for all the classes studied. Fractal dimension showed decreased for diseased heart. This was also used to diagnose diabetes mellitus automatically. Nonlinear dynamics descriptors which were derived from 12-lead rest ECG data, and evaluated by originally developed computer software. fluctuations of potentials of ECG leads that occur during the period of 20 ms with a magnitude of 5– 20 μV were significantly less beat-to-beat predictable in ischemic versus non-ischemic patients. The well-known nonlinear dynamics descriptors as recurrences percentage, mutual information, fractal dimension, and a new descriptor, next embedding dimension error, were good quantitative descriptors of fluctuations [6]. They considered finite differences of measured potentials with the time step of 20 ms as the initial source for nonlinear analysis. It is seen that the nonlinear features such as mutual information, embedding dimension errors, and fractal dimension and recurrence percentage are noticed to be different for CAD and normal class.
In [7] it is proven that the spectral components of HR signals bear a relation with angiographic features of CAD. The power spectral analysis and time based feature are obtained from HR signals which showed that these parameters are low for CAD patients when compared to normal.
The Higher order spectral analysis (HOS) of the HRV signals of normal heart beat and seven classes of arrhythmia and also some general characteristics for each of these classes of HRV signals in the bispectrum and bicoherence plot, and also extracted features from the higher order spectra and performed an analysis of variance (ANOVA) test in paper [8] .
Artificial intelligence techniques are being effectively used in medical diagnostic support tools to increase the diagnostic accuracy and to provide additional knowledge to medical stuff. An effect of principle component analysis on the assessment of exercise stress test with support vector machine in determination of coronary artery disease is depicted in paper [9].
A new technique which is capable of detecting CAD using the HRV signals is presented in paper [10,11], These signals are decomposed to sub-band signals using Flexible Analytic Wavelet Transform (FAWT). Then, two nonlinear parameters namely; K-Nearest Neighbor (K-NN) entropy estimator and Fuzzy Entropy (FzEn) are extracted from the decomposed sub-band signals. Ranking methods namely wilcoxon, entropy, Receiver Operating Characteristic (ROC) and Bhattacharya space algorithm are implemented to optimize the performance of the designed system. The proposed methodology has shown better performance using entropy ranking technique. The Least Squares-Support Vector Machine (LS-SVM) with Morlet wavelet and Radial Basis Function (RBF) kernels is used with a highest classification accuracy of 100%, but the method is very complex and high cost and was used only for limited data set.
Nonlinear features are extracted from the HRV signals obtained using the following techniques: recurrence plots (RP), Poincare plots, and detrended fluctuation Analysis (DFA). Three types of entropy, namely, Shannon entropy, approximation entropy (ApEn), and sample entropy (SampEn) are extracted. These features were subjected to principal component analysis (PCA). The significant principal components were evaluated using eight classification techniques, and the performances of these techniques were evaluated to determine which presented the highest accuracy in classifying normal and CAD classes in paper [12]. It is observed that the multilayer perceptron (MLP) method resulted in the highest classification accuracy (89.5%).
HRV signals of normal and CAD subjects are studied for different sample lengths [13]. Five features namely, Amplitude Modulation (AM) bandwidth, Frequency Modulation (FM) bandwidth, Second-Order Difference Plot (SODP), Analytic Signal Representation (ASR) area and mean frequency of Fourier-Bessel Expansion (FBE) are extracted from intrinsic mode functions. Among these features FM bandwidth, AM-bandwidth and mean frequency of FBE showed more discriminating ability.
In [14] ECG and photoplethysmography signals of CAD and normal subjects are studied. Further, heartbeat interval series, diastolic time interval series, and systolic time interval series are constructed from these signals. Thereafter, cross-correlation, mutual information, crossconditional entropy, coherence function, cross fuzzy entropy and cross sample entropy are studied on these constructed series for diagnosis of CAD.
From the literature review it is found that in the automatic frequency analysis of heart rate is based on the assumption that the recorded signals are stationary, periodic with both positive, negative alterations but this is not valid for long duration signals. The high order spectrum based analysis is more prone to the effect of noise. But because of confined frequency decision the wavelet transforms proved to be more appropriate method for the analysis of heart rate signals and also to extract dynamical statistics from the same heart rate signals and proven to be the most appropriate method to be used for non-linear, non-stationary long duration ECG signals. In this work we have used the FAWT based technique for the analysis of ECG signal of large number of CAD and normal subjects with improved classification accuracy.
-
III. Implementation of the Proposed Method
The “Fig.1,” clearly shows the various stages involved in the process of implementing the methodology proposed in the paper.
-
A. Data Collection
The required signal of both CAD and normal class for the study is downloaded from physionet.org which will usually be available in different formats as .mat, .csv and .txt or the real time ECG signal can be recorded from any hospital using BIOPAC equipment. In this paper the data in text format is considered for further analysis, and 10 subjects of CAD and 10 healthy subjects is chosen with 1000 samples each. Obtained readings in the form of text which is extracted from ECG downloaded from physionet.org database are plotted in MATLAB to get the ECG signal of both CAD normal classes which is clearly shown in “Fig.2a,” and “Fig.2b,” respectively.
-
B. Preprocessing
The recorded ECG signal is usually corrupted by many types of noises which include the Baseline wander, power line interference, electrode contact noise, motion artifact, and electromyogram and instrumentation noise. This stage of processing is aimed at generating the Heart rate signal from the ECG plot. The ECG waveform is digitized at a sampling rate of 1 KHz. to ensure that the ECG trace is of a high resolution. The noisy signals of both classes are subjected to suitable filtering techniques namely notch filter to remove power line interference which is characterized by frequency of 50Hz., sampling frequency of 256Hz. and band pass filter with lower and upper cut off frequency of 0.3 and 15 Hz to remove all other noises. Further to detect and locate ‘QRS’ in the ECG wave and extract R peak the samples are squared so that all the sample amplitude other than R peak samples can be reduced and R peaks are detected and localized. Then the R to R time interval is noted which is denoted as tRR and the human heart rate which measures the number of beats per minute is defined as HR=60/tRR .
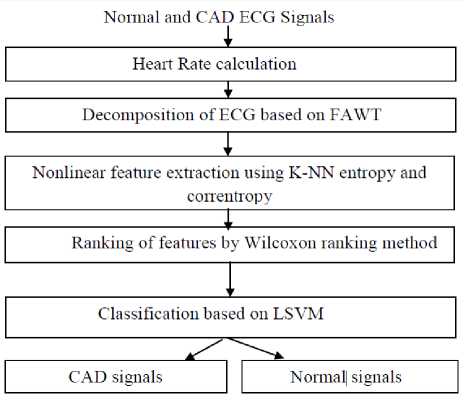
Fig.1. Stages in the implementation of the methodology
-
C. Implementation of the Methodology
Flexible Analytic Wavelet Transform (FAWT) as described in [10,11], is an efficient transformation method with flexible parameters used to decompose the segmented ECG beats which presents a way to analyze the extracted signal from which detailed coefficients are extracted depicting nonlinear features hidden in the recorded signal. The decomposition of beats is carried out to jth level with the implementation of Iterative filter bank. The filter is made up of two channels of type high pass and one channel of type low pass for implementation of each level up to jth level. The two high pass channels are considered to deal with positive and negative frequency components separately.
In FAWT method the five different parameters denoted by β, c, d, a and b are used to characterize the signal and all these parameters are found easily adjustable. The FAWT vital factors which include Quality factor, redundancy, dilation are adjusted according to the non linear nature of ECG signals of two classes by modifying β, c, d, a and b parameters. The Q-factor is the ratio of center frequency (2-β) to bandwidth (β).
The number of wavelet coefficients is determined by dilation factor. The rate of choosing the samples for low pass channel is determined by a and b and for high pass channels c and d parameters are used respectively. a denotes low pass channel up sampling parameter, b denotes low pass channel down sampling parameter whereas c and d denotes up/down sampling parameter for high pass channel.
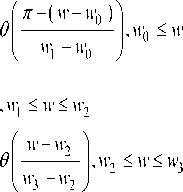
The response of low pass filter in frequency domain is defined in “(1),” and the response of high pass filter in frequency domain is defined in “(2),” [10].
( ab )2
( ab )2
w - w p
H ( w ) = ■
w, - w,
( ab )2
w, - w,
- w
G ( w ) = ■
(2 cd )2
(2 cd )2
1 (2 cd )2
0, w e[ ( 0, w 0 ) u ( w 3,2 n ) ]
( 1 — в ) * e
Where wp =--1— pass band frequency of low p aa
n is pass filter, w = — is stop band frequency of low pass sb filter.
(1 - p)n + e an w0 =----------, w1 = — , c bc n-e n + e a-1 + pb w2 =-----, w3 =-----, e<---------.
c c a + b
The θ ( w ) is defined as in [10] and given by “(3),” for w = (0, π).
[1 + cos ( w ) ][ 2 - cos ( w ) ]2
9 ( w ) =--------------------------- (3)
The reconstruction iterative filter bank is implemented as in [10] and given by “(4),”
1 9 ( n - w )|2 + 9 ( w )|2 = 1, ^ 1 - a J< p < c (4)
In the present work the parameters are chosen with values a=7, b=8, c=1, d=2 and β=0.8*(C/D) as in paper [10]. To analyze further CAD and normal signal the level of decomposition based on probability value computed has to be found. For each level of decomposition the probability value are computed and further K-NN entropy estimator and correlation entropy are computed from these levels. All the parameters are chosen using trial and error approximation.
-
D. Extraction of Non Linear Features Based on Entropy
The heart signals are analyzed using nonlinear features which depict the non linear nature of the signals [12, 13], In this study the K-NN and Correlation entropy based methods are applied to extract non linear features.
-
1) Non Parametric K-NN Based Estimation:
This method is considered as an improvement over the existing Kozachenko-Leonenkoe estimator. It considers the probability densities which are non uniform within the region covered by K nearest neighbors surrounding every point in sample. It enhances the performance of traditional estimators in three different conditions that is while the dimension of random variable is massive, and while near functional relationship results in high correlation between different components of random variable, and when the variance of components of random variable vary. The improved estimator denoted as H(x) which defines differential entropy of any random variable x is given as in [14] shown in “(5),”
M
H ( X ) = - ^ ( K ) + V ( M ) + log ( C d ) + D/M ^ log [e ( J ) ] (5) j = 1
where M represents the sample total, D represents the variable X dimension, ϵ (j) denotes the distance from any arbitrary jth sample of variable x to one of its K nearest neighbor and ψ(y) denotes digamma function and is defined as in “(6)”, [14]
V ( y ) =
1 d r ( y ) r ( y ) dy
The volume of D-unit dimension is denoted by C D and is defined as in “(7)”, [14]
C D
D n n^

-
2) Correlation Entropy:
This entropy method is a non linear similarity measure between two random variables. It is based on kernel which measures the similarity between two quantities and reveals the statistical information and temporal structure of dataset. It has the advantage of containing the nonlinear features present in the signal because of which the correlation entropy is chosen as a measuring index capable of determining non linear dynamics of any biomedical signal. As this entropy method relies on kernel based approach, its capability to compute the nonlinear dynamics is highly efficient.
The correlation entropy method is mathematically implemented by considering X and Y as two variables for which the similarity is measured. The ideal, similarity and estimator view is given by “(8),”, “(9),”, and “(10),” respectively.
V (X, Y ) = E [5 (X - Y)]
where δ is the dirac delta distribution function
V (X, Y )= E [ k (X, Y)]
where k is a non-negative definite function. It is not necessary that k is shift invariant as in the ideal view case as shown in “(8),”
V (X • Y )=Z Zk (*(k)- y (k))
where
N
Z{( * ( k ) • У ( k ) ) } k = 1
shown in “(10),”
is the set of observations as
min„ — a T Q„ - e T a a
-
E. Feature Selection Methods
Once the clinically significant non linear features needed to discriminate among various classes are extracted, the more significant features among large number of features can be chosen by applying feature selection method. These selection techniques allocate ranks to the extracted features and sort the features as per their clinical significance. The features with lesser rank can be discarded and the features with high rank are considered as a factor to classify among different classes. For finding the ranks the wilcoxon signed non parametric test is used in which the samples having same distribution are selected from large population the samples are taken to be dependent. In the entropy based method the correlation entropy and KNN entropy values are calculated for each filtered ECG signal, based on the entropy values estimated for various CAD signals the ranks are assigned [15]. The one with the highest magnitude of entropy value will be assigned the first rank and the other signals are assigned ranks according to ascending order. In order to execute this ranking, on MATLAB, box plot command is used.
-
F. Linear Support Vector Machine Classifier
The clinical significant features which are extracted are arranged according to the ranking assigned in descending order, this ranked parameters then subjected to Linear-support vector machine classifier to increase the robustness of classification. The principle used in classifier is to find which class a given data point is in among the two classes. In the SVM, every data point is considered as vector of p dimension and to find if it is possible to separate such points with a hyper plane of dimension p-1 need to be known which is known as linear classifier. In linear support vector method the various ranked features which corresponds to various data classes are categorized by determining hyper plane in upper dimensional space. It forms a single hyper plane or set of it in a high dimensional space. This hyper plane is used for classification and a remarkable separation is achieved by the hyper plane that covers more distance to the approachable training data points of any class which is chosen as functional margin. The principle used in this approach of classification is that in order to minimize the generalization error of the classifier the functional margin should be chosen higher. For implementing the linear support vector machine the training vectors for two classes is given as i= 1, 2,3….n and the L-SVM method is mathematically described as in “(11),”
1n min w, b , z wT^ + C Z Z (11)
2 i = 1
Subject to y i ( wT ф ( * i ) + b ) > 1 - Z i • Z i ^ 0, i=1,2^.n, the dual of “(11),” is shown in “(12),”
subject to yT a = 0 , 0 < a - c , i=1,2.....n where a is the vector of all ones, C>0 is the upper bound, Q positive semi definite matrix is Qy = y.yjk ( ** , ) where k is the kernel. Here the vector chosen for training is mapped onto a space of higher dimension by the decision function as in “(13),”
sgn
f
Z yiaik (* • *)+p к i=1
-
IV. Results
The results obtained from advanced signal processing techniques are portrayed and implemented using MATLAB. The entropy obtained from correlation entropy and K-NN entropy is used to classify the signals further. ECG signal readings of normal persons and CAD patients are obtained from PhysioNet.org. The .txt format file is read using suitable MATLAB commands and the same is plotted. The CAD and normal ECG signal is shown in “Fig. 2a,” and “Fig. 2b,”
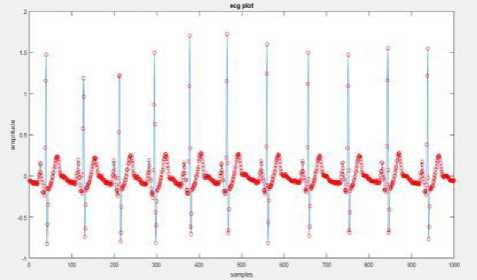
Fig.2a. Plot of sample readings to get ECG signal of CAD patients
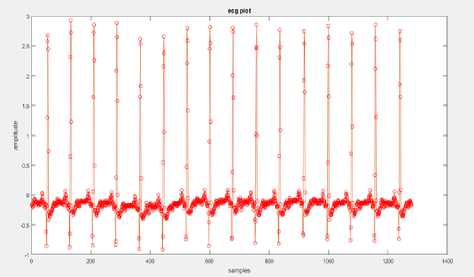
Fig.2b. Plot of sample readings to get ECG signal of Normal patients
To understand about PQRST components, the plotted ECG signal is enlarged for a period of one or two and the enlarged ECG shows a clear PQRST shown in “Fig.3,”.
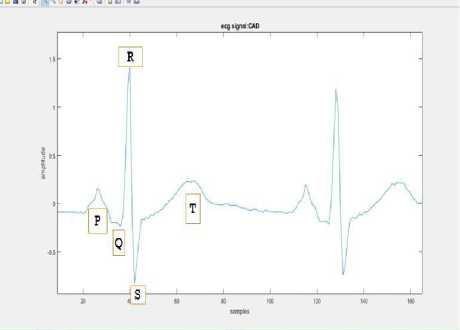
Fig.3. Enlarged ECG signal for identifying PQRST components.
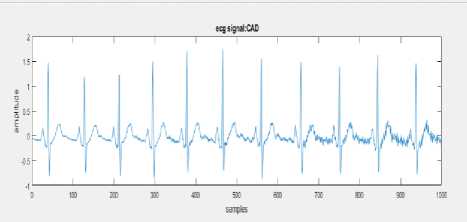
Fig.4a. Noise corrupted ECG signal
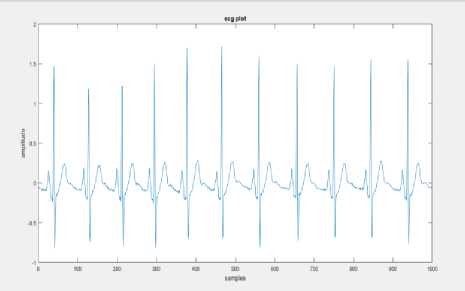
Fig.4b. ECG signal of CAD patients obtained after noise removal
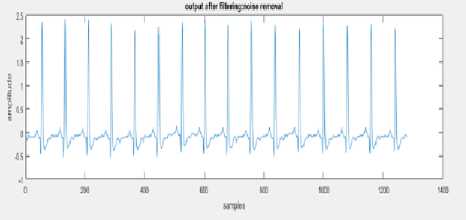
Fig.4c. ECG signal of normal person obtained after noise removal
The Power line interference of 50 Hz is generated with increasing noise amplitude for increase in sample numbers and this power line interference is added to ECG signal of both the classes. This noise corrupted ECG signals is then applied to the suitable filter which includes notch and band pass filter as a preprocessing phase. The noise corrupted signal, the filtered signal of both classes is depicted above in “Fig.4a,” “Fig.4b,” and “Fig.4c,”
To clearly locate the R-peak in QRS complex, the filtered signal samples are squared so that all the sample amplitudes other than R-peak samples are reduced. And it is further seen that in the squared signal, R-peaks are clearly highlighted. The squared ECG of normal and CAD class considered to calculate the heart rate is depicted below in “Fig.5a,” and “Fig.5b,”
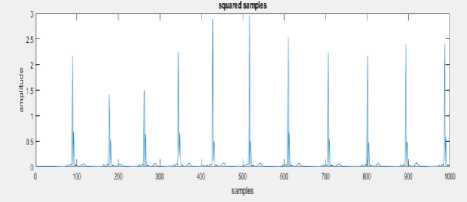
Fig.5a. Squared ECG signal of CAD patient to calculate heart rate.
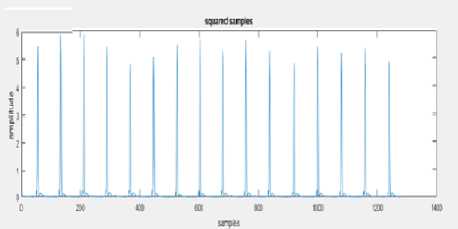
Fig.5b. Squared ECG signal of normal class to calculate heart rate.
The heart rate is calculated from squared ECG for both CAD and normal person’s ECG and it is observed that CAD patient’s heart rate in experimentally chosen ECG is found to be 66 bpm and that of normal person’s is 93.75 bpm. Even though the heart rate calculated for the CAD patient lies between the ranges of 60-100 bpm, the clinicians fails to conclude that he does not suffer from CAD. The heart rate theory for CAD patients is still an evaluating field and different clinicians has their own version of sayings on the heart rates that could possibly affected by CAD. So advanced signal processing techniques has to be applied for ECG signals in order to differentiate CAD patients from normal persons. The preprocessed filtered heart rate signal are applied with efficient signal decomposition method FAWT and the ECG beats is decomposed into 4 level low frequency sub bands for both normal and CAD class and the decomposed signal of CAD and normal class is shown below in “Fig. 6a,” and “Fig. 6b,” respectively. From these figures, it is observed that CAD affected ECG will have more fluctuations in their lower frequency wavelet transforms. The normal ECG will have very least fluctuations in the lower frequency components.
For the decomposed signal the wilcoxon ranking method is applied and for ranking calculation, 5 CAD signals were considered and they were applied with sign rank command in MATLAB, which is the command for wilcoxon ranking method. The output consists of a probability column that is first column in “Fig.7,”, where the CAD signal with highest probability will represent the highest ranked ECG CAD signal. Signals with lower probabilities will represent lowest rank tend to become normal ECG’s. The second column indicates acceptance column, where if h=0, null hypothesis (considered signal is a CAD affected signal) will be accepted. If h=1, null hypothesis will be rejected.
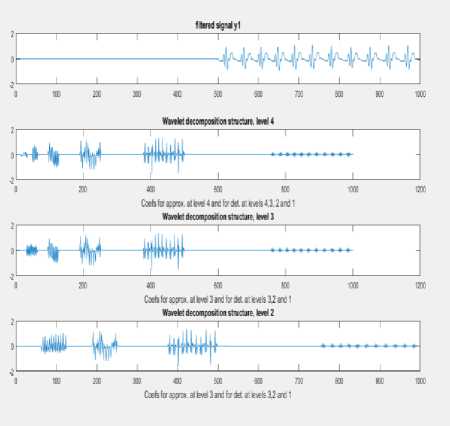
Fig.6a. Four level decomposition of CAD patient’s signal
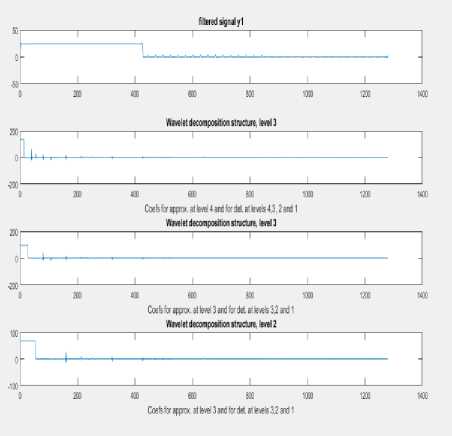
Fig.6b. Four level decomposition of normal person’s signal .
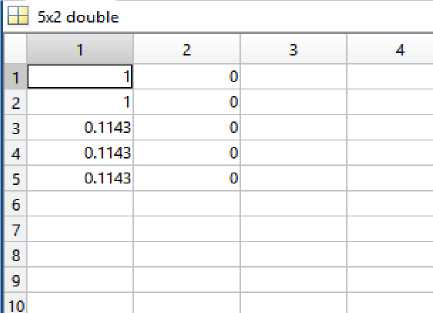
Fig.7. Determination of the rank of signal using wilcoxon method.
For each 4 level of low frequency samples, K-NN entropy is calculated and 4 such CAD signals are considered. A K-NN entropy matrix will be generated with each column of data indicating entropy with respect to each CAD signal. This informational matrix is classified using box plot and one with the highest magnitude K-NN entropy will be ranked as the highly affected CAD and as magnitude of entropy decreases, rank will be decreasing. The one with the lowest entropy will be assigned the least possibly affected CAD ECG. This classification is shown in “Fig.8a,”
|
Е |
6x4 |
||||
|
1 |
2 |
3 |
4 |
5 |
|
|
1 |
-1,3130 |
-1.3343 |
-1.3139 |
-0.9773 |
|
|
2 |
-1.3130 |
-1.3343 |
-1.3139 |
-0.9773 |
|
|
3 |
-1.1840 |
-1.1017 |
-0.8698 |
-0.5502 |
|
|
4 |
-1.1391 |
-1.0278 |
-0.7949 |
-0.4002 |
|
|
5 |
-1.1391 |
-1.0278 |
-0.7949 |
-0.4002 |
|
|
6 |
-1.3130 |
-1.3343 |
-1.3139 |
0.9773 |
|
|
7 |
|||||
|
3 |
|||||
|
9 |
|||||
|
1Л |
|||||
Fig.8a. K-NN entropy matrix.
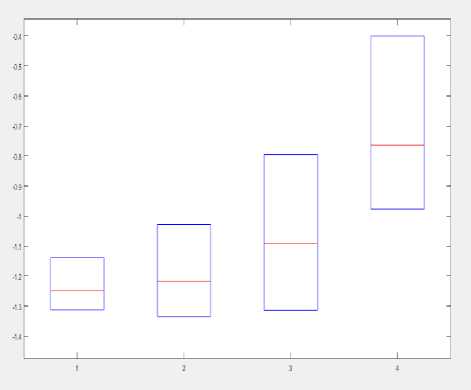
Fig.8b. K-NN entropy box plot.
Further for the filtered ECG signals, Correlation entropy’s are calculated. Here, entropies of CAD affected ECG is considered with respect to a reference normal ECG signal. 4 Such CAD signals are considered and Correlation entropy is calculated for each of them. A Correlation entropy matrix is generated, where each element in the row represents the Correlation entropy corresponding to that particular CAD signals. One with the highest Correlation entropy represents highest non similarity with the normal reference ECG and thus it will be assigned with the first rank. The efficiency of Correlation entropy will be low if the sampling intervals of both CAD and normal ECG are different. The Correlation entropy matrix is shown in “Fig.9,”
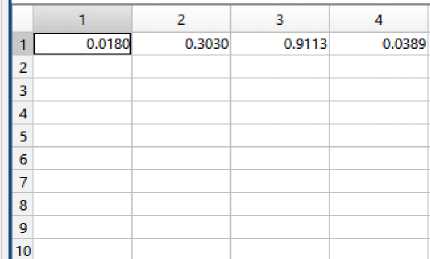
Fig.9. Correlation entropy of different CAD signals.
For the implementation of linear classifier, a normal person’s ECG signal will be normalized as shown in “Fig.10a,” and that will be considered as a response matrix (reference matrix). 4 CAD signals are considered for training in linear SVM and they will be selected as predictors. Each column will be representing a CAD affected ECG signal and distribution of samples with respect to each other with a response matrix will be considered. “Fig.10b,” shows distribution of samples among 2nd CAD and 4th CAD signals. A predicted class percentage matrix will be available as the output and it shows what is the positive predicted rate and what percentage of samples are falsely discovered as shown in “Fig.10c,”
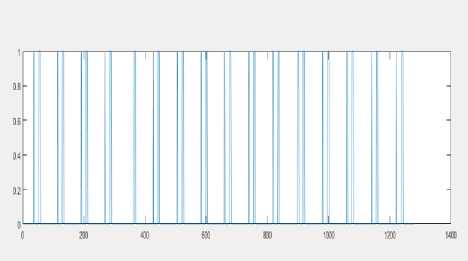
Fig.10a. Normalized reference ECG signal
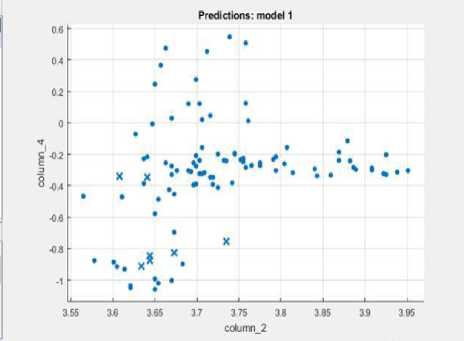
Fig.10b. Distribution of samples between 2nd CAD and 4th CAD signals
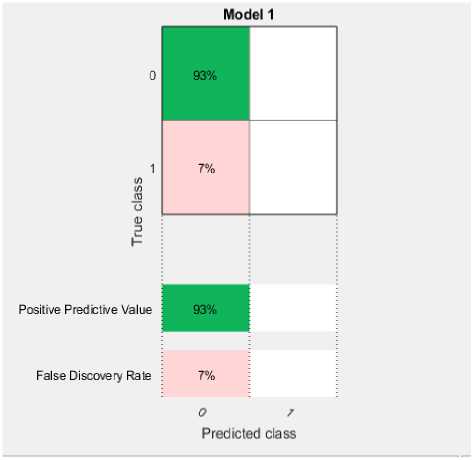
Fig.10c. Predicted class percentage matrix.
The results obtained from various methods in design implementation are showcased above and the discussions are made on the same. Results from Classification by Correlation entropy and K-NN entropy are shown. wilcoxon ranking method and L-SVM based classification results are discussed. The simulation results revealed how the two different normal and CAD class can be classified effectively based on ECG data. This proposed method can serve better in aiding the clinicians and could be set up in health center to automatically characterize and locate CAD. In future it can be made part of home tele-monitoring. The drawback of the study is that only small data set is considered and the kernel features and parameters used in the implantation of FAWT are selected on the use of trial and error method which leads to the increased computational complexity.
-
V. Conclusion
The results obtained after the execution and evaluation of the proposed method revealed that the combination of FAWT and entropy based feature extraction is a simple method to extract high quality non linear features and separate the CAD and normal class using efficient error free classifier. By decomposing heart rate variability signals using FAWT, normal ECG signals have shown least fluctuations in their lower level low frequency components and CAD affected ECG signals have shown higher fluctuations than normal signals. Correlation entropy and wilcoxon ranking methods will form a basic level of non-linear classification and are not fully efficient. K-NN entropy estimator classification will yield best results. The signals which have higher magnitude of entropy are assigned with highest ranks. Thus it can be concluded that signals in the highest ranks are highly affected by CAD and as rank decreases the severity decreases. Linear SVM classifies signals and provides insight to the distribution of samples with respect to reference signal. The proposed method provides an
a
a
complete model of preprocessing ECG by reducing power line interference noise, find the heart rate of the ECG signal which is further used in classification of CAD and Normal signals. MATLAB implementation of the proposed design is proven to be effective and it was found that the results matched closely with the available data.
The methodology can be used to automatically classify among other CAD classes and diagnose defects in heart due to CAD. For a large database of ECG signals, different classes in CAD can be explored and conclusions can be made. This method may help the clinical specialists to detect any heart defects while examining heart of a person. The method can be used to identify different stages of CAD and can help in detecting CAD in the early stages. The proposed method provides a complete model to find the heart rate of ECG signals, identifying whether the signals are affected by CAD or not and assigning ranks to the signals. The future scope is to implement the algorithm on DSP hardware and can be further applied on real time single channel, multichannel
ECG recordings and for holter monitor recordings. This approach can be applied to detect other diseases which include epilepsy, heart attack, stroke and autism and a effort can be taken to develop an automatic computer based technique which can automatically choose accurate kernel features and their parameters.
References An automated detection of CAD using the method of signal decomposition and non linear entropy using heart signals
- N.D. Wong, “Epidemiological studies of Coronary Heart Diseases and the evolution of preventive cardiology,” Nature Reviews Cardiology, vol. 11, pp. 276-289, April 2014.
- National Heart, Lung and Blood Institute, what is coronary heart disease? http”//www.nhlbi.nih.gov/health/health-topics/pics/cad/, 2015.
- U. Donna Giria and Rajendra Acharya, “Automated diagnosis of Coronary Artery Diseases affected patients using Linear Discriminant Analysis, Principal Component Analysis, Independent Component Analysis and Discrete Wavelet Transform,” Elsevier, pp. 274-282, 2013.
- U.R. Acharya and N. Kannathal, “Comprehensive analysis of cardiac health using heart rate signals,” Institute of Physics and Engineering in Medicine, vol.25, pp. 1139-1151, 2004.
- U.R. Acharya, P.S. Bhat, N. Kannathal, A. Rao and C.M. Lim, “Analysis of cardiac health using fractal dimension and wavelet transformation,” Elsevier, vol.26, pp. 133-139, 2005.
- Karolis Antanavičius, et al., “Nonlinear dynamics analysis of electrocardiograms for detection of coronary artery disease,” US National Library of Medicine, vol.92, pp.198-204, 2008.
- K. Karamanos, S. Nikolopoulos, K. Hizanidis, G. Manis, A. Alexandridi and S. Nikolakeas, “Block entropy analysis of heart rate variability signals,” International Journal of Bifurcation and Chaos, vol.16, pp. 2093-2101, 2006.
- K.C. Chua, V. Chandran and C.M. Lim, “Cardiac state diagnosis using high order spectra of heart rate variability,” Journal of Medical Engineering and Technology, vol.32, pp. 145-155, March/April 2008
- Ismail Babaoglu , Oguz Fındık , Mehmet Bayrak,“ Effects of principle component analysis on assessment of coronary artery diseases using support vector machine”, ELSEVIER, Expert Systems with Applications,Vol. 37,pp. 2182–2185,2010.
- A. Mohit Kumar and Ram Bilas Pachori, “An efficient automated technique for CAD diagnosis using flexible analytic wavelet transform and entropy features extracted from HRV signals,” Elsevier, Expert Systems with Applications, vol. 63, pp. 165-172, 2016.
- I. Bayram, “ An analytic wavelet transform with a flexible time- frequency covering ,” IEEE Transl. Signal processing, vol. 61(5), pp. 1131-1142, 2013.
- Xian du, Vinitha sree subbhuraam, “ Novel classification of coronary artery disease using Heart rate Variability analysis”, Journal of Mechanics in Medicine and Biology , Vol. 12, No. 4, 2012 .
- S. Sood , M. Kumar, Ram Bilas Pachori and U. R. Acharya, “Application of empirical mode decomposition-based features for analysis of normal and CAD heart rate signals,” Journal of Mechanics in Medicine of Preventive and Biology, vol.16 (1), 2016.
- K.A. Veselkov, V.I. Pahomov, J.C. Lindon, V.S. Volynkin, D. Crockford, G.S. Osipenko and J.K. Nicholson, “A metabolic entropy approach for measurements of systemic metabolic disruptions in patho- physiological states,” Journal of Proteome Research, vol. 9 (7), pp. 3537–3544, 2010.
- Ji, L. , Li, P. , Liu, C. , Wang, X. , Yang, J. , & Liu, C. ,“ Measuring electromechanical coupling in patients with coronary artery disease and healthy subjects”., Entropy, 18 (4), 153 , 2016
- U.R. Acharya, O. Faust, V. Sree, G. Swapna, R.J. Martis, N.A. Kadri and J.S. Suri, “ Linear and Non Linear analysis of normal and CAD affected heart rate signals,” Elsevier, Computer Methods and Programs in Biomedicine, vol.113, pp. 55-68, 2014.
- C. Zhang C, B. Li , B. Chen, H. Cao, Y. Zi and Z. He, “Weak fault signature extraction of rotating machinery using flexible analytic wavelet transform mechanical Systems and Signal Processing,” vol. 64-65, pp. 162-187, 2015.
- Ahmad Taher Azar and Shaimaa Ahmed El-Said, “Performance analysis of support vector machines classifiers in breast cancer mammography recognition”, Springer-Verlag London, Vol.24, pp.1163-1177, 2014.
