An edge based clustering technique with self-organizing maps

Author: G. Chamundeswari, G. P. S. Varma, Ch. Satyanarayana
Journal: International Journal of Information Technology and Computer Science @ijitcs
Article in issue: 5 Vol. 10, 2018.
Free access
Recently, artificial neural networks are fund to be efficiently used in clustering algorithms. So, the present paper focuses on the development of a novel clustering method based on artificial neural networks. The present paper uses an enhancement filter to enhance the segments in the input image. After this, the various sub images are generated and features are computed for each sub and edge image. Finally, the Self Organizing Map (SOM) is used for clustering process. The proposed novel method is evaluated with a database of 795 leaf images. Further various Probability Distributed Functions (PDFs) are used to evaluate the efficacy of the proposed method. The performance measures of the proposed method indicate the efficiency of the extended clustering method with SOM.
Filter, edge, sub image, feature vector, neural network
Short address: https://sciup.org/15016260
IDR: 15016260 | DOI: 10.5815/ijitcs.2018.05.03
Text of the scientific article An edge based clustering technique with self-organizing maps
Published Online May 2018 in MECS
In Current days, clustering techniques are found to be popular in wide range of applications viz., computer vision, pattern recognition, machine learning and statistics etc. The clustering algorithms can be broadly classified [1] into various categories viz., locality based, hierarchical and partitional methods. A silhouette based algorithms [2] are proposed for maximizing the class seperability. For this, an efficient clustering procedure is adopted for the multi dimensional numerical database. The database consists of various medical images. The clustering algorithms are found to increase the efficiency of the image retrieval systems. For this, adaptive fuzzy clustering algorithm [3] is developed. This algorithm uses polynomial fit for setting the parameters automatically. With this, the value of the parameter is computed with the inflection points of the polynomial fit result. A shadowed modified C-mean clustering algorithm [4] is found to efficient clustering based image segmentation technique. It uses modified fuzzy C-means clustering algorithm [5,6,7]. It suppresses the outliers of the noisy image with local and joint memberships.
-
II. Related work
A clustering algorithm is designed for the development of manifold learning [8,9,10]. The learning framework can be combined with the non linear dimensionality reduction process. The process can use the manifold ranking. The developed clustering technique can be used efficiently for the image retrieval. It provides efficient global visualization view. For visualizing the structure of the white matter in brain image is found efficient with the clustering approach. For this, the voxel based clustering [11] is used. An undirected graph is used to represent the white matter connectivity of the brain image. It consists of fiber bundles trajectories estimation procedure. For remote sensing image segmentation, the clustering methods are widely used. The fuzzy C-means clustering algorithms can be modified [12] and used for polarimetric remote sensing images.
The clustering algorithm combined with the association analysis approach is used widely for prediction of diseases [13]. Based on the post medical history of the patient, the local pattern models are designed. The clustering algorithms are found efficient in estimating the lane markings in the intelligent vehicle systems [14]. For this estimation, the clustering method can be combined with various fitting models and polynomial interpolations. The bagged clustering model [15] is used for compression. This method will improve the stability of the sparse models. For each set of points, low dimensional sub space is computed with the sub space clustering technique [16]. This clustering algorithm is efficiently designed with the rank approximation process. The approximations are computed by the
Logarithm-determinant of the matrix. A weakly Supervised Dual Clustering method [17] uses spectral clustering and linear clustering procedures. The spectral clustering method is used to estimate the super pixels of the region and the linear clustering method is used to compute the discriminative features of the super pixels.
A clustering algorithm based on image fusion is found to be efficient for processing clinical images [18]. This clustering approach is designed based on the neural networks [19] and wavelet transformation. The bird flocking algorithm based clustering technique [20] is found to be efficient for segmenting the geographical birds. This method is developed based on graph coloring concept. It is observed that the clustering techniques are widely used for mining the multimedia data sets. For this, development of new algorithms is demanded by the research community [21, 22, 23]. So, the present paper proposes a novel approach for clustering technique with neural networks.
The present paper is organized as follows. The section I give the introduction to the clustering techniques, section II discusses about the related work, section III discusses about the proposed methodology. The detailed results and discussion is provided in section IV and the conclusions in section V.
E = | 1 fe P l2 )> 1
0 otherwise
For each of the above image, co-occurrence matrix is estimated and the five features are evaluated and acted as a feature vector.
The present paper uses SOM for the clustering stage. The topology of the SOM is shown in Fig. 1. The proposed method is experimented with the leaf data base which consists of 90 groups of images. So, the SOM is designed with the size 15×6 topology. The neighborhood connections of the designed SOM are shown in Fig. 2. The weight positions of the designed SOM are shown in Fig. 3.
III. Methodology
The present paper considers the local window of size 3x3 as shown in Table 1.
Table 1. Local window for the pixel P 5 .
|
P 1 |
P 2 |
P 3 |
|
P 4 |
P 5 |
P 6 |
|
P 7 |
P 8 |
P 9 |
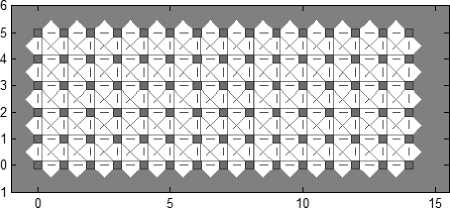
Fig.2. SOM Neighbor Connections with “gridtop” structure.
The present paper applies the filter given in (1) for enhancing the input image. The proposed filter uses the top left corner pixels of the current local window.
F = ( A x p + p , ) - ( B x p ) + ( C x P 5 - [ D x ( P 2 + P 4 )] + [ D x P 1 ])
After this, the sub images and edge image are
generated by using (2)-(6).
S 1 = F/ — F/8(2)
S2 = Fp, - Fp(3)
S3 = F/6 - F/3
S'4 = Fp2 - F/7
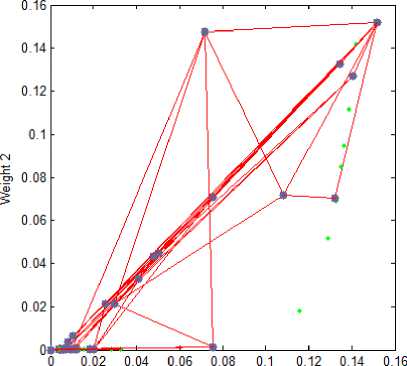
Weight 1
Fig.3. SOM Weight Positions with “gridtop” structure.
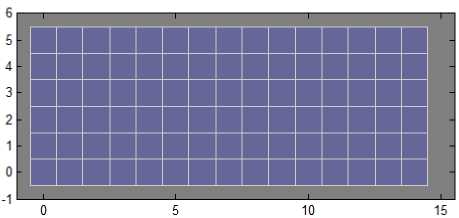
Fig.1. SOM Topology with “gridtop” structure.
-
IV. Results and Discussions
The present paper evaluated the proposed approach with the leaf database of 795 images which are grouped into 90categories. The present paper considers the values of A, B, C and D as 3.6, 0.15, 0.02 and 0.83. The Fig. 4 shows the original image and the estimated edge image. The feature vector is computed for all the sub images and the edge image. The described feature vector is given to SOM.
The present paper has conducted the experiment with four different SOM organizations viz., Hextop, Randtop, Tritop and Gridtop. The Hextop uses hexagonal pattern, Randtop uses random pattern, Tritop uses triangle pattern and Gridtop uses rectangular grid pattern in the topology of the SOM.
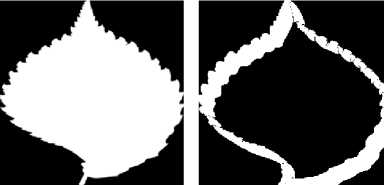
(a)
(b)
Fig.4 (a) Original Image (b) Edge image.
For each topology pattern structure, the present paper evaluates the performance of the proposed approach with various neighborhood sizes ranging from 3 to 20. For each experiment of SOM, the distance between the neurons is computed with four different distance measures viz., link dist, man dist, dist and box dist. The dist computes the Euclidean distance, the man dist computes the manhattan distance, the link dist computes the number of links as distance and the box list computes the layer neuron position vector based distance. For each experiment, the described feature vector is given to the designed SOM with the associated topology structure, neighborhood size and distance function. The performance of the experiment is indicated with fur measures viz., FNR (False Negative Ratio), FPR (false Positive Ratio), TPR (True Positive Ratio) and TNR (True Negative Ratio).
The SOM with Hextop topology structure is considered for the evaluation and the evaluated performance measures are shown in Fig. 5, 9, 13 and 17. The SOM with Randtop topology is considered for the evaluation and the performance measures are shown in Fig. 6, 10, 14 and 18. The SOM with Tritop topology is considered for the evaluation and the performance measures are shown in Fig. 7, 11, 15 and 19. The SOM with Gridtop topology is considered for the evaluation and the performance measures are shown in Fig. 8, 12, 16 and 20.
For each topology, the FNR is computed with all the four distance measures and are shown in Fig. 5, 6, 7 and 8. In these figures, FNR at various neighborhood sizes are portrayed. From this, it is observed that the least FNR is obtained with Hextop topology. For each topology, the FPR is computed with all the four distance measures and are shown in Fig. 9, 10, 11 and 12. In these figures, FPR at various neighborhood sizes are portrayed. From this, it is observed that the least FPR is obtained with Gridtop topology. For each topology, the TPR is computed with all the four distance measures and are shown in Fig. 13, 14, 15 and 16. In these figures, TPR at various neighborhood sizes are portrayed. From this, it is observed that the highest TPR is obtained with Randtop topology. For each topology, the TNR is computed with all the four distance measures and are shown in Fig. 17, 18, 19 and 20. In these figures, TNR at various neighborhood sizes are portrayed. From this, it is observed that the highest TNR is obtained with Gridtop topology.
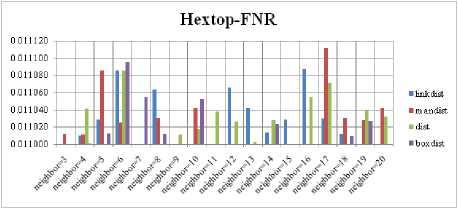
Fig.5. FNR Comparison Result of SOM-Hextop with various distance measures.
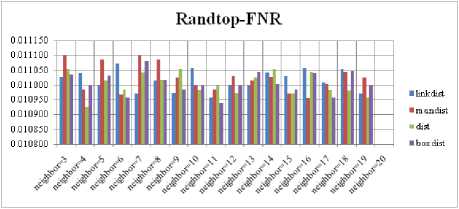
Fig.6. FNR Comparison Result of SOM-Randtop with various distance measures.
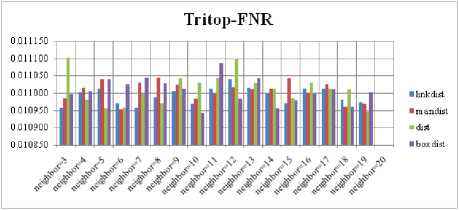
Fig.7. FNR Comparison Result of SOM-Tritop with various distance measures.
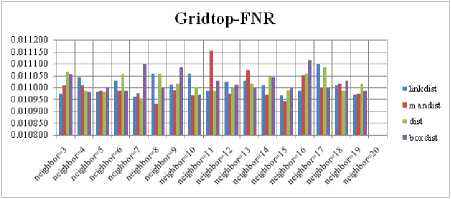
Fig.8. FNR Comparison Result of SOM-Gridtop with various distance measures.
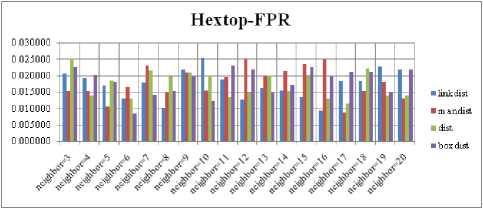
Fig.9. FPR Comparison Result of SOM-Hextop with various distance measures.
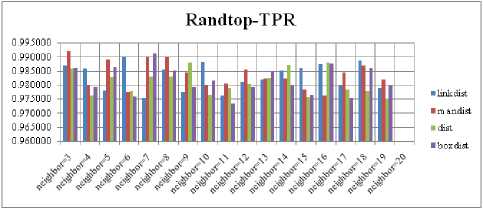
Fig.14. TPR Comparison Result of SOM-Randtop with various distance measures.
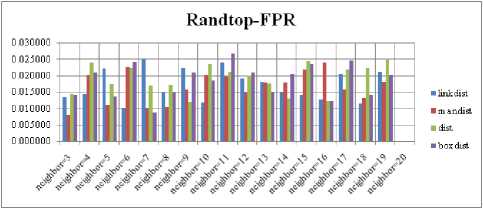
Fig.10. FPR Comparison Result of SOM-Randtop with various distance measures.
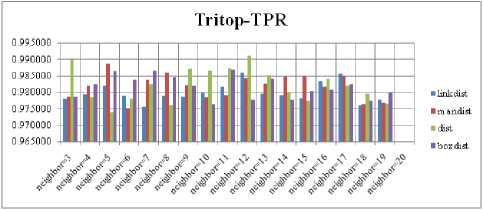
Fig.15. TPR Comparison Result of SOM-Tritop with various distance measures.
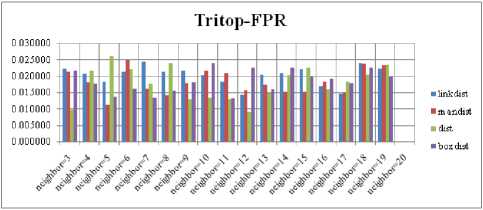
Fig.11. FPR Comparison Result of SOM-Tritop with various distance measures.
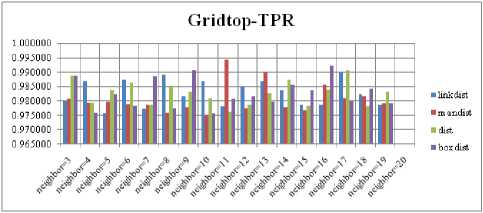
Fig.16. TPR Comparison Result of SOM-Gridtop with various distance measures.
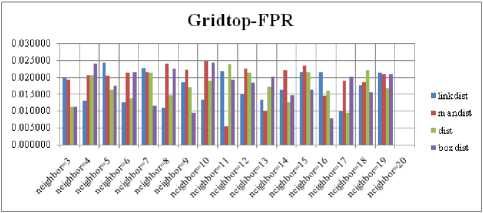
Fig.12. FPR Comparison Result of SOM-Gridtop with various distance measures.
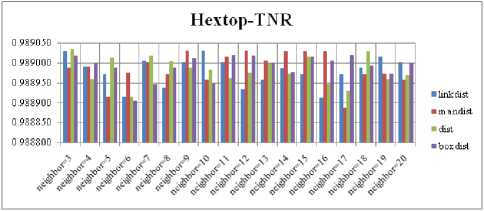
Fig.17. TNR Comparison Result of SOM-Hextop with various distance measures.
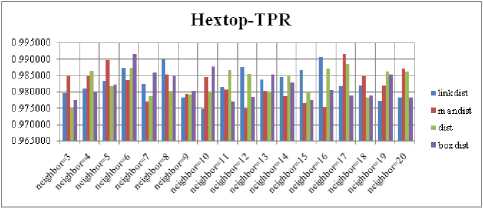
Fig.13. TPR Comparison Result of SOM-Hextop with various distance measures.
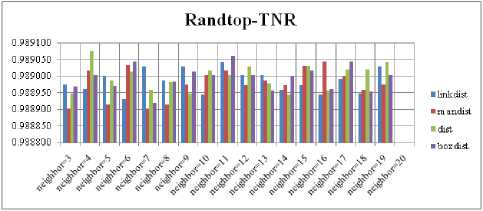
Fig.18. TNR Comparison Result of SOM-Randtop with various distance measures.
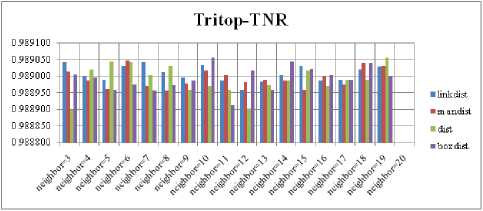
Fig.19. TNR Comparison Result of SOM-Tritop with various distance measures.
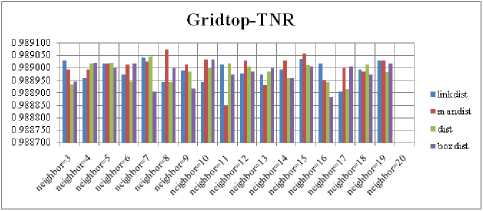
Fig.20. TNR Comparison Result of SOM-Gridtop with various distance measures.
The FNR measure with Boxdist distance function is shown in Fig. 21. The least FNR value is obtained at neighborhood (NH) =12 with Randtop. The FNR measure with Linkdist distance function is shown in Fig. 22. The least FNR value is obtained at NH=4 with Tritop and NH=8 with Tritop. The FNR measure with Mandist distance function is shown in Fig. 23. The least FNR value is obtained at NH=9 with Gridtop. The FNR measure with dist distance function is shown in Fig. 24. The least FNR value is obtained at NH=5 with Randtop. The FPR measure with Boxdist distance function is shown in Fig. 25. The least FPR value is obtained at NH=17 with Hextop, Randtop and Gridtop. The FPR measure with Linkdist distance function is shown in Fig. 26. The least FPR value is obtained at NH=17 with Hextop. The FPR measure with Mandist distance function is shown in Fig. 27. The least FPR value is obtained at NH=12 with Gridtop. The FPR measure with dist distance function is shown in Fig. 28. The least FPR value is obtained at NH=13 with Gridtop. The TPR measure with Boxdist distance function is shown in Fig. 29. The highest TPR value is obtained at NH=17 with Gridtop. The TPR measure with Linkdist distance function is shown in Fig. 30. The highest TPR value is obtained at NH=17 with Hextop. The TPR measure with Mandist distance function is shown in Fig. 31. The highest TPR value is obtained at NH=12 with Gridtop. The TPR measure with dist distance function is shown in Fig. 32.
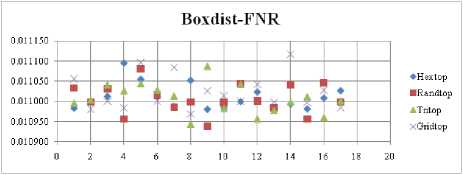
Fig.21. FNR Comparison Result of SOM-Box distance measure with various topology functions.
The highest TPR value is obtained at NH=13 with Tritop. The TNR measure with Boxdist distance function is shown in Fig. 33. The highest TNR value is obtained at NH=12 with Randtop. The TNR measure with Linkdist distance function is shown in Fig. 34. The highest TNR value is obtained at NH=12 with Randtop. The TNR measure with Mandist distance function is shown in Fig. 35. The highest TNR value is obtained at NH=9 with Gridtop. The TNR measure with dist distance function is shown in Fig. 36. The highest TNR value is obtained at NH=5 with Randtop.
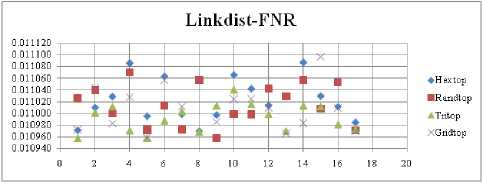
Fig.22. FNR Comparison Result of SOM-Link distance measure with various topology functions.
Mandist-FNR
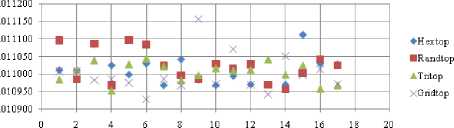
Fig.23. FNR Comparison Result of SOM-Man distance measure with various topology functions.
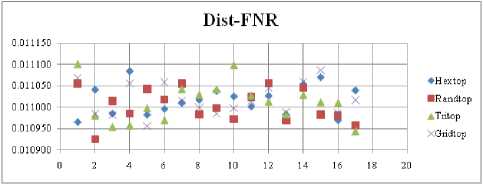
Fig.24. FNR Comparison Result of SOM-dist distance measure with various topology functions.
Boxdist-FPR
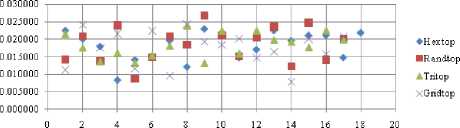
Fig.25. FPR Comparison Result of SOM-Box distance measure with various topology functions.
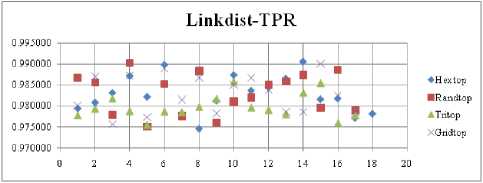
Fig.30. TPR Comparison Result of SOM-Link dist distance measure with various topology functions.
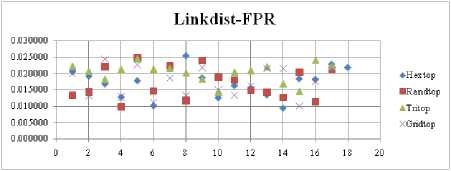
Fig.26. FPR Comparison Result of SOM-Link distance measure with various topology functions.
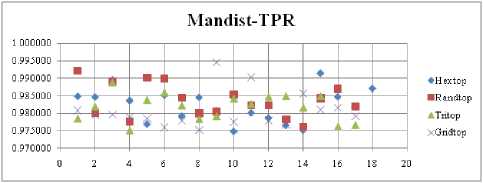
Fig.31. TPR Comparison Result of SOM-Man dist distance measure with various topology functions.
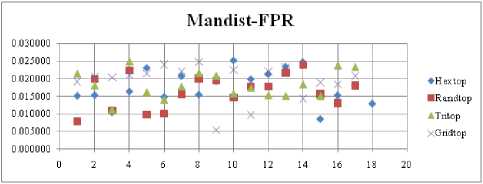
Fig.27. FPR Comparison Result of SOM-Man distance measure with various topology functions.
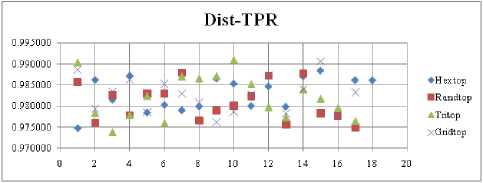
Fig.32. TPR Comparison Result of SOM-dist distance measure with various topology functions.
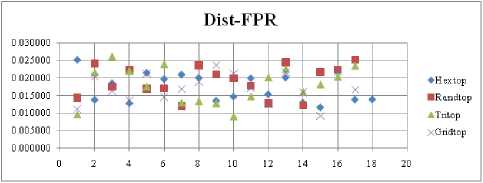
Fig.28. FPR Comparison Result of SOM-dist distance measure with various topology functions.
Boxdist-TNR
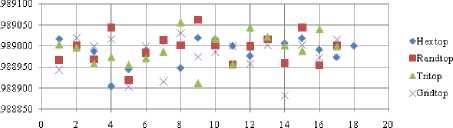
Fig.33. TNR Comparison Result of SOM-Box dist distance measure with various topology functions.
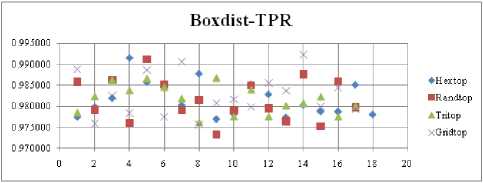
Fig.29. TPR Comparison Result of SOM-Box dist distance measure with various topology functions.
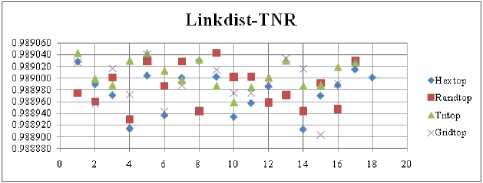
Fig.34. TNR Comparison Result of SOM-Link dist distance measure with various topology functions.
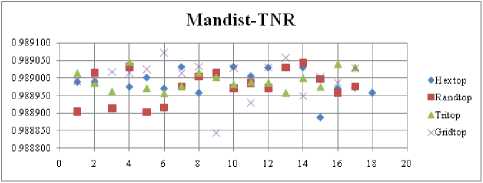
Fig.35. TNR Comparison Result of SOM-Man dist distance measure with various topology functions.
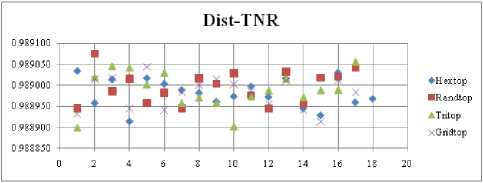
Fig.36. TNR Comparison Result of SOM-dist distance measure with various topology functions.
The present paper extended the present approach with the normalization (norm) process. This will normalizes the derived feature vector to a length of 1 and the normalized result is given to the SOM with various topology structures, distance functions. The proposed approach is extended with various probability distribution functions (PDFs). For this, the present paper uses the following PDFs.
-
• Poisson PDF (poisPDF)
-
• Exponential PDF (expPDF)
-
• Extreme Value PDF (evpPDF)
-
• Weibel PDF (wblPDF)
-
• Chi Square PDF (chi2PDF)
These results are evaluated with SOM neighborhood size=3.
The SOM with Hextop structure is used for the evaluation and the performance measures with various distance measures are shown in Tables 2, 3, 4 and 5. From these results, it is observed that for SOM with Hextop structure, efficient results are obtained by wblPDF for linkdist distance measure, norm for man dist distance measure, wblPDF for dist distance measure and norm for box dist distance measure. The SOM with Randtop structure is used for the evaluation and the performance measures with various distance measures are shown in Tables 6, 7, 8 and 9. From these results, it is observed that for SOM with Randtop structure, efficient results are obtained by original (org) for linkdist distance measure, wblPDF for man dist distance measure, norm for dist distance measure and norm for box dist distance measure. The SOM with Tritop structure is used for the evaluation and the performance measures with various distance measures are shown in Tables 10, 11, 12 and 13.
From these results, it is observed that for SOM with Tritop structure, efficient results are obtained by expPDF for linkdist distance measure, expPDF for man dist distance measure, expPDF for dist distance measure and norm for box dist distance measure. The SOM with Gridtop structure is used for the evaluation and the performance measures with various distance measures are shown in Tables 14, 15, 16 and 17. From these results, it is observed that for SOM with Gridtop structure, efficient results are obtained by norm for linkdist distance measure, norm for man dist distance measure, norm for dist distance measure and wblPDF for box dist distance measure.
Table 2. Hextop-linkdist with neighborhood=3.
|
FNR |
FPR |
TPR |
TNR |
|
|
org |
0.010972 |
0.020556 |
0.979444 |
0.989028 |
|
norm |
0.011103 |
0.008396 |
0.991604 |
0.988897 |
|
poisPDF |
0.011023 |
0.000107 |
0.622116 |
0.988977 |
|
expPDF |
0.011165 |
0.005793 |
0.983096 |
0.988835 |
|
evpPDF |
0.011031 |
0.000086 |
0.255469 |
0.988969 |
|
wblPDF |
0.011138 |
0.007722 |
0.981167 |
0.988862 |
|
chi2PDF |
0.011098 |
0.006451 |
0.826882 |
0.988902 |
Table 3. Hextop-man dist with neighborhood=3.
|
FNR |
FPR |
TPR |
TNR |
|
|
org |
0.011012 |
0.015141 |
0.984859 |
0.988988 |
|
norm |
0.011124 |
0.006532 |
0.982357 |
0.988876 |
|
poisPDF |
0.011052 |
0.022268 |
0.522177 |
0.988948 |
|
expPDF |
0.011146 |
0.005628 |
0.994372 |
0.988854 |
|
evpPDF |
0.011018 |
0.000101 |
0.299899 |
0.988982 |
|
wblPDF |
0.011056 |
0.015151 |
0.984849 |
0.988944 |
|
chi2PDF |
0.011061 |
0.008657 |
0.935787 |
0.988939 |
Table 4. Hextop- dist with neighborhood=3.
|
FNR |
FPR |
TPR |
TNR |
|
|
org |
0.010966 |
0.025160 |
0.974840 |
0.989034 |
|
norm |
0.011025 |
0.016593 |
0.983407 |
0.988975 |
|
poisPDF |
0.011078 |
0.000046 |
0.533288 |
0.988922 |
|
expPDF |
0.011148 |
0.007289 |
0.981599 |
0.988852 |
|
evpPDF |
0.010890 |
0.011326 |
0.233118 |
0.989110 |
|
wblPDF |
0.011160 |
0.005793 |
0.983096 |
0.988840 |
|
chi2PDF |
0.011187 |
0.001701 |
0.887188 |
0.988813 |
Table 5. Hextop-box dist with neighborhood=3.
|
FNR |
FPR |
TPR |
TNR |
|
|
org |
0.010984 |
0.022465 |
0.977535 |
0.989016 |
|
norm |
0.011150 |
0.007009 |
0.992991 |
0.988850 |
|
poisPDF |
0.011009 |
0.011218 |
0.555449 |
0.988991 |
|
expPDF |
0.011169 |
0.005561 |
0.994439 |
0.988831 |
|
evpPDF |
0.010975 |
0.011240 |
0.244315 |
0.989025 |
|
wblPDF |
0.011164 |
0.005988 |
0.982901 |
0.988836 |
|
chi2PDF |
0.011020 |
0.023828 |
0.887283 |
0.988980 |
Table 6. Randtop-linkdist with neighborhood=3.
|
FNR |
FPR |
TPR |
TNR |
|
|
org |
0.011100 |
0.009139 |
0.990861 |
0.988900 |
|
norm |
0.011164 |
0.004996 |
0.983892 |
0.988836 |
|
poisPDF |
0.011014 |
0.000289 |
0.610822 |
0.988986 |
|
expPDF |
0.011153 |
0.006147 |
0.993853 |
0.988847 |
|
evpPDF |
0.010974 |
0.000143 |
0.222079 |
0.989026 |
|
wblPDF |
0.010978 |
0.020719 |
0.979281 |
0.989022 |
|
chi2PDF |
0.011079 |
0.007909 |
0.858757 |
0.988921 |
Table 11. Tritop-man dist with neighborhood=3.
|
FNR |
FPR |
TPR |
TNR |
|
|
org |
0.010998 |
0.021907 |
0.978093 |
0.989002 |
|
norm |
0.011101 |
0.009483 |
0.990517 |
0.988899 |
|
poisPDF |
0.011023 |
0.000106 |
0.522117 |
0.988977 |
|
expPDF |
0.011035 |
0.015608 |
0.984392 |
0.988965 |
|
evpPDF |
0.011087 |
0.000029 |
0.255527 |
0.988913 |
|
wblPDF |
0.011181 |
0.005093 |
0.994907 |
0.988819 |
|
chi2PDF |
0.011105 |
0.005752 |
0.938692 |
0.988895 |
Table12. Tritop- dist with neighborhood=3.
|
FNR |
FPR |
TPR |
TNR |
|
|
org |
0.011040 |
0.012571 |
0.987429 |
0.988960 |
|
norm |
0.011135 |
0.006686 |
0.982203 |
0.988865 |
|
poisPDF |
0.011024 |
0.000107 |
0.588782 |
0.988976 |
|
expPDF |
0.011149 |
0.006559 |
0.993441 |
0.988851 |
|
evpPDF |
0.011031 |
0.000086 |
0.277691 |
0.988969 |
|
wblPDF |
0.011164 |
0.004450 |
0.984439 |
0.988836 |
|
chi2PDF |
0.011116 |
0.006914 |
0.848641 |
0.988884 |
Table 8. Randtop- dist with neighborhood=3.
|
FNR |
FPR |
TPR |
TNR |
|
|
org |
0.010985 |
0.019896 |
0.980104 |
0.989015 |
|
norm |
0.011041 |
0.015602 |
0.984398 |
0.988959 |
|
poisPDF |
0.011023 |
0.000106 |
0.566561 |
0.988977 |
|
expPDF |
0.011096 |
0.011279 |
0.988721 |
0.988904 |
|
evpPDF |
0.011058 |
0.011154 |
0.199957 |
0.988942 |
|
wblPDF |
0.011080 |
0.017357 |
0.982643 |
0.988920 |
|
chi2PDF |
0.011141 |
0.012584 |
0.954082 |
0.988859 |
Table 13. Tritop-box dist with neighborhood=3.
|
FNR |
FPR |
TPR |
TNR |
|
|
org |
0.011056 |
0.012899 |
0.987101 |
0.988944 |
|
norm |
0.011149 |
0.005376 |
0.983513 |
0.988851 |
|
poisPDF |
0.011067 |
0.005601 |
0.583288 |
0.988933 |
|
expPDF |
0.011164 |
0.006274 |
0.982615 |
0.988836 |
|
evpPDF |
0.011031 |
0.000087 |
0.299913 |
0.988969 |
|
wblPDF |
0.011112 |
0.010351 |
0.989649 |
0.988888 |
|
chi2PDF |
0.011053 |
0.020927 |
0.879073 |
0.988947 |
Table 9. Randtop-box dist with neighborhood=3.
|
FNR |
FPR |
TPR |
TNR |
|
|
org |
0.011013 |
0.018870 |
0.981130 |
0.988987 |
|
norm |
0.011213 |
0.003086 |
0.996914 |
0.988787 |
|
poisPDF |
0.011078 |
0.000046 |
0.588843 |
0.988922 |
|
expPDF |
0.011038 |
0.014454 |
0.985546 |
0.988962 |
|
evpPDF |
0.011480 |
0.000129 |
0.255426 |
0.988520 |
|
wblPDF |
0.011077 |
0.014224 |
0.985776 |
0.988923 |
|
chi2PDF |
0.011098 |
0.021496 |
0.945171 |
0.988902 |
Table 14. Gridtop-linkdist with neighborhood=3.
|
FNR |
FPR |
TPR |
TNR |
|
|
org |
0.011053 |
0.013807 |
0.986193 |
0.988947 |
|
norm |
0.011149 |
0.005376 |
0.983513 |
0.988851 |
|
poisPDF |
0.011077 |
0.000046 |
0.566621 |
0.988923 |
|
expPDF |
0.011097 |
0.011118 |
0.988882 |
0.988903 |
|
evpPDF |
0.010850 |
0.000273 |
0.266393 |
0.989150 |
|
wblPDF |
0.011101 |
0.010027 |
0.989973 |
0.988899 |
|
chi2PDF |
0.011147 |
0.011739 |
0.866039 |
0.988853 |
Table 10. Tritop-linkdist with neighborhood=3.
|
FNR |
FPR |
TPR |
TNR |
|
|
org |
0.010969 |
0.024538 |
0.975462 |
0.989031 |
|
norm |
0.011133 |
0.006872 |
0.982017 |
0.988867 |
|
poisPDF |
0.011039 |
0.027824 |
0.527732 |
0.988961 |
|
expPDF |
0.011168 |
0.005448 |
0.994552 |
0.988832 |
|
evpPDF |
0.010989 |
0.000129 |
0.244315 |
0.989011 |
|
wblPDF |
0.011122 |
0.009520 |
0.990480 |
0.988878 |
|
chi2PDF |
0.011129 |
0.008195 |
0.858472 |
0.988871 |
Table 15. Gridtop-man dist with neighborhood=3.
|
FNR |
FPR |
TPR |
TNR |
|
|
org |
0.011009 |
0.023181 |
0.976819 |
0.988991 |
|
norm |
0.011176 |
0.003042 |
0.985847 |
0.988824 |
|
poisPDF |
0.011080 |
0.000046 |
0.611065 |
0.988920 |
|
expPDF |
0.011073 |
0.013731 |
0.986269 |
0.988927 |
|
evpPDF |
0.010989 |
0.011226 |
0.244329 |
0.989011 |
|
wblPDF |
0.011026 |
0.019457 |
0.980543 |
0.988974 |
|
chi2PDF |
0.011022 |
0.011254 |
0.888746 |
0.988978 |
Table 16. Gridtop- dist with neighborhood=3.
|
FNR |
FPR |
TPR |
TNR |
|
|
org |
0.010954 |
0.026605 |
0.973395 |
0.989046 |
|
norm |
0.011166 |
0.005503 |
0.994497 |
0.988834 |
|
poisPDF |
0.011079 |
0.000046 |
0.588843 |
0.988921 |
|
expPDF |
0.011055 |
0.016562 |
0.983438 |
0.988945 |
|
evpPDF |
0.011182 |
0.011345 |
0.377544 |
0.988818 |
|
wblPDF |
0.011128 |
0.010899 |
0.989101 |
0.988872 |
|
chi2PDF |
0.010997 |
0.023497 |
0.887614 |
0.989003 |
Table 17. Gridtop-box dist with neighborhood=3.
|
FNR |
FPR |
TPR |
TNR |
|
|
org |
0.010984 |
0.024217 |
0.975783 |
0.989016 |
|
norm |
0.011096 |
0.009703 |
0.979186 |
0.988904 |
|
poisPDF |
0.011023 |
0.000106 |
0.555449 |
0.988977 |
|
expPDF |
0.011093 |
0.015909 |
0.984091 |
0.988907 |
|
evpPDF |
0.010891 |
0.011327 |
0.255340 |
0.989109 |
|
wblPDF |
0.011093 |
0.011301 |
0.988699 |
0.988907 |
|
chi2PDF |
0.011041 |
0.017461 |
0.782539 |
0.988959 |
-
V. Conclusions
Enhancement filter based edge detection is used for representing the edges of the input image. The cooccurrence based features are estimated for describing the input image. Additional feature vectors are generated with various Probability Distribution Functions (PDFs). The artificial neural network is used for clustering process. The experimental results on the input leaf data set indicate the efficacy of the proposed method with various structures and functions.
References An edge based clustering technique with self-organizing maps
- Hichem Frigui, “Clustering: Algorithms and Applications,” Image Processing Theory, Tools & Applications,1-11, 2008.
- S.F.d. Silvam B. Brandoli, D.M. Eler, “Silhouette-based feature selection for classification of medical images,” IEEE 23rd International Symposium on Computer-Based Medical , 315-320, 2010.
- T.J. Zhang, D. Chen, “Study on Efficient Image Indexing Method Based on Adaptive Fuzzy Clustering,” 2nd International Conference on Industrial and Information Systems, 200-201, 2010.
- L. Chen, S. Chen, “New Shadowed Fuzzy C-Means Algorithm for Image Segmentation,” 3rd International Conference on Informative and Cybernatics for computational social, 43-46, 2016.
- G. Li, J. Zhuang, H. Hou, D. Yu, “An Improved Clonal Selection Classifier Incorporating Fuzzy Clustering,” International Conference on Measuring Technology and Mechatronics Automation, 179-182, 2009.
- G.R. Reddy, P. Yugander, J.S. Babu, R.R. Rao, “Possibilistic Fuzzy C-Means Algorithm for Fingerprint Image,” International Conference on Devices, Circuits and Systems (ICDCS), 249-253, 2012.
- H. Wang, G. Liu, H. Ke, L. Song, “A Vehicle License Plate Detection Method based on Clustering Analysis,” International Conference on Computer Science and Service System, 1413-1416, 2012.
- J. Cui, F. Liu, Z. Li, J. Li, “Image Retrieval Based on Manifold Learning and Incorporate Clustering,” Global Congress on Intelligent Systems, 544-548, 2009.
- D. Onder, B. Karacali, “Automated Clustering of Histology Slide Texture using Co-occurrence based Grayscale image features and Manifold learning,” 14th National Biomedical Engineering Meeting, 1-4, 2009.
- A. Talwalkar, S. Kumar, H. Rowley, “Large Scale Manifold Learning,” IEEE Conference on Computer Vision and Pattern Recognition, 1-8, 2008.
- M.H. Everts, H. Bekker, J.B.T.M. Roerdink, “Visualizing White Matter Structure of the Brain using Dijkstra’s Algorithm,” 6th International Symposium on Image and Signal Processing and Analysis, 569-574, 2009.
- J. Fan, J. Wang, “Polarimetric SAR Image Segmentation based on Spatially Constrianed Kernel Fuzzy C-Means Clustering,” OCEANS 2015 - Genova, 1-4, 2015.
- F. Folino, C. Pizzuti, “A Comorbidity-based Recommendation Engine for Disease Prediction,” IEEE 23rd International Symposium on Computer-Based Medical Systems (CBMS) , 6-12, 2010.
- D. C. Hernandez, D. Seo, K.H. Jo, “Robust Lane Marking Detection based on Multi feature fusion,” 9th International Conference on Human System Interactions (HSI) , 423- 428, 2016.
- A.H.Idrobo, Y. Schwartz, G. Varoquax, B. Thirion, “Improving sparse recovery on structured images with bagged clustering,” International workshop on Pattern Recognition in neuroImaging, 73-76, 2015.
- Z. Kang, C. Peng, Q. Cheng, “Robust Subspace Clustering via Smoothed Rank Approximation,” IEEE Signal Processing Letters, vol. 22, No. 11, 2088-2092, 2015.
- Y. Liu, J. Liu, Z. Li, J. Tang, H. Lu, “Weakly-Supervised Dual Clustering for Image Semantic Segmentation,” IEEE conference on Computer Vision and Pattern Recognition, 2075-2082, 2013.
- L. Xiaoqi, Z. Baohua, G.U.Yong, “Medical Image Fusion Algorithm based on clustering neural network,” 1st International Conference on Bioinformatics and Biomedical Engineering , 637-640, 2007.
- M. Markou, S. Sameer, “A Neural Network based novelty detector for image sequence analysis,” IEEE transactions on pattern analysis and machine intelligence, vol. 28, no. 10, 1664-1677, 2006.
- S. Sinha, S. Deb, “Image Segmentation by Intelligent Clustering Technique,” IEEE Recent Advances in Intelligent Computational Systems (RAICS), 272-276, 2013.
- Ajay Kumar, Shishir Kumar, “Density based Initialization Method for K-means Clustering Algorithm,” International Journal of Intelligent Systems and Application, 10, 40-48, 2017.
- S. K. Ali, Z.N. Azeez, A.A.H.Ouda, “A New Clustering Algorithm for Face Classification,” International Journal of Information Technology and Computer Science, 6, 1-8, 2016.
- M.E. Agza, W.M.Ashour, “Efficient and Fast Initialization Algorithm for K-means Clustering,” International Journal of Intelligent Systems and Applications, 1, 21-31, 2012.
