An Efficient Algorithm for Density Based Subspace Clustering with Dynamic Parameter Setting

Author: B.Jaya Lakshmi, K.B.Madhuri, M.Shashi
Journal: International Journal of Information Technology and Computer Science(IJITCS) @ijitcs
Article in issue: 6 Vol. 9, 2017.
Free access
Density based Subspace Clustering algorithms have gained their importance owing to their ability to identify arbitrary shaped subspace clusters. Density-connected SUBspace CLUstering(SUBCLU) uses two input parameters namely epsilon and minpts whose values are same in all subspaces which leads to a significant loss to cluster quality. There are two important issues to be handled. Firstly, cluster densities vary in subspaces which refers to the phenomenon of density divergence. Secondly, the density of clusters within a subspace may vary due to the data characteristics which refers to the phenomenon of multi-density behavior. To handle these two issues of density divergence and multi-density behavior, the authors propose an efficient algorithm for generating subspace clusters by appropriately fixing the input parameter epsilon. The version1 of the proposed algorithm computes epsilon dynamically for each subspace based on the maximum spread of the data. To handle data that exhibits multi-density behavior, the algorithm is further refined and presented in version2. The initial value of epsilon is set to half of the value resulted in the version1 for a subspace and a small step value 'delta' is used for finalizing the epsilon separately for each cluster through step-wise refinement to form multiple higher dimensional subspace clusters. The proposed algorithm is implemented and tested on various bench-mark and synthetic datasets. It outperforms SUBCLU in terms of cluster quality and execution time.
Density divergence, multi-density behavior, data spread, dynamic epsilon, subspace clusters, density based subspace clustering
Short address: https://sciup.org/15012653
IDR: 15012653
Text of the scientific article An Efficient Algorithm for Density Based Subspace Clustering with Dynamic Parameter Setting
Published Online June 2017 in MECS
Subspace clustering is the process of identifying clusters with objects similar in various subsets of attributes defining subspaces[1]. Nowadays subspace clustering is an emerging research area because of its varied applications like face recognition, speech processing, social media mining, habitat identification etc. [2-4]. However problems related to scalability, complexity and accuracy restrict its usage.
Most of the subspace clustering techniques adopt density based clustering methods. The natural clusters are identified using density based clustering algorithms as they do not ask for number of clusters as input parameter. These algorithms are also insensitive to outliers. DBSCAN is one of the density based clustering algorithms which uses two input parameters namely minpts and epsilon in order to find density connectivity among the objects and form dense clusters[5]. As shown in Fig. 1 when the data objects are uniformly spread among different clusters in a subspace, DBSCAN produces good results with appropriate input parameters. DBSCAN is adopted in SUBCLU which is a successful subspace clustering algorithm. SUBCLU applies DBSCAN to find clusters in (k+1)-dimensional subspace by further partitioning the objects of clusters found in k-dimensional subspaces[6].
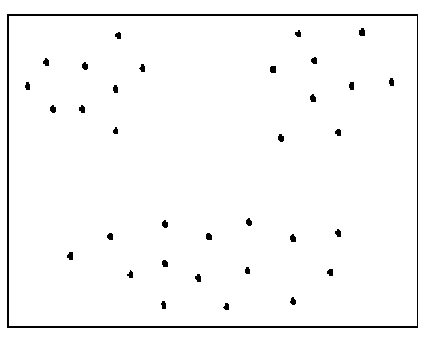
Fig.1. A subspace with uniform spread of data objects
Due to the concept of density divergence, the objects in subspaces of higher dimensions are expected to be spread farther away which calls for subspace specific parameter setting[7-8]. Density based subspace clustering algorithms like SUBCLU are also challenged by the phenomenon called multi-density behavior of datasets[9] wherein a subspace may contain clusters with varied densities as shown in Fig.2. In this paper, the authors propose an algorithm to handle density divergence and multi-density behavior of datasets by selecting the appropriate values of epsilon dynamically in accordance with the spread of the data objects in respective subspaces.
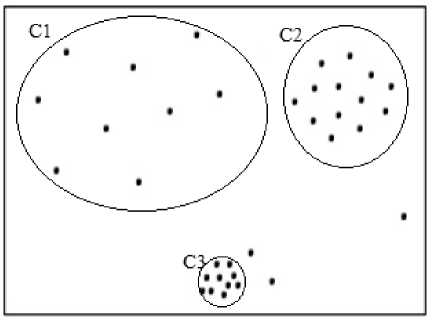
Fig.2. A subspace with non-uniform spread of data objects
In the first phase of the algorithm, the authors propose to dynamically compute epsilon for each subspace depending on the spread of the data in the subspace and uses it for identifying the density connected subspace clusters. This is further refined in the second phase which is specific to deal with subspaces containing clusters with varied densities.
Section II describes recent developments on Grid based and Density based subspace clustering algorithms. The proposed algorithm that handles density divergence and multi-density behavior using dynamic parameter setting is described in section III. The experimental results and analysis are provided in section IV. Section V concludes the paper suggesting possible extensions.
-
II. R elated W ork
CLIQUE(CLustering In QUEst) is the one of the basic grid based subspace clustering algorithm. It partitions the data space into equal sized grids and discovers the one whose density exceeds a fixed density threshold as dense regions in the subspaces. The higher dimensional dense grids are identified based on apriori style of pruning. It is not sensitive to the order in which the input records are provided. The size of the grid and density threshold are the two input parameters. The resulted cluster descriptions are presented in a comprehend manner using DNF expressions[10]. With the increase of density in grids entropy decreases. ENCLUS(ENtropy based subspace CLUStering) makes use of the concept of entropy in finding dense regions. It is an extension for CLIQUE that mines maximum correlated subspaces which has high clustering behavior of the data objects. Using downward and upward closure properties given by entropy and dimensional correlation respectively, the algorithm was able to mine the non-minimal correlated subspaces[11].
MAFIA(Merging of Adaptive Finite Intervals) uses the technique of adaptive grids based on the data distribution. The generation of higher dimensional subspace clusters is same as that of CLIQUE[12]. These algorithms suffer from the problem of density divergence. DENCOS(DENsity COnscious Subspace clustering) is a grid based subspace clustering algorithm which determines adaptive density thresholds according to the dimensionality of the subspace. The dense grids are identified using a novel data structure called Density FP-tree. Since variable density thresholds are used to discover dense regions in subspaces of varied dimensional sizes, the property of monotonicity no more holds. So, all the subspaces have to be examined in exploring dense regions[6]. The Grid based subspace clustering algorithms result in poor quality clusters if there is no proper positioning of the grids[13]. So most of the research is going on to mitigate this problem through Density based subspace clustering algorithms.
SUBCLU(density connected SUBspace CLUstering) is the basic density based subspace clustering algorithm that discards the usage of grids and overwhelms the limitations of grid based subspace clustering algorithms. Moreover it makes use of density connectivity in finding arbitrary shaped dense clusters in subspaces and uses apriori style of pruning in exploring higher dimensional subspace clusters[6]. It uses DBSCAN that uses same value for the input parameters namely epsilon and minpts in all the subspaces, thus degrading its performance. FIRES (Filter Refinement Subspace Clustering) is a generic framework that uses approximate techniques in a filter-refinement scheme that scales with the size of the data dimensionality. The clustering process is carried based on local density threshold. By suitable merging of the base clusters derived from one dimensional clusters the approximations of maximal-dimensional subspace clusters are determined[14]. DUSC (Dimensionality Unbiased Subspace Clustering) uses statistical function called Epanechnikov kernel for computing local density measure adaptive to the dimensionality of the subspace cluster. The density threshold varies with the size of the dimensionality. Due to this, pruning the subspaces using anti-monotonicity is not possible. It handles the problem of density divergence to some extent, but all the subspaces have to be examined for finding dense subspace clusters[15].
Scalable density-based subspace clustering method steers mining few selected subspace clusters. The steering technique identifies promising subspaces and their combinations directly for clustering. i.e. the most interesting subspace clusters. The steering process includes efficient information gathering for the densitybased paradigm and the processing scheme requires access to databases only in very few subspace regions. It unifies intermediate results to ultimately identify new regions for subspace clustering in a best-first manner. This means that database scans for density computations are avoided[16]. In DB-CSC (Density-based Combined
Subspace Cluster), density-based cluster definition is introduced by taking the similarity of attributes in the subspaces and the graph density into consideration. The algorithm focuses on the applicability of subspace clustering in social networks. This novel clustering model helps to detect clusters of arbitrary shape and size using the concept of density connectedness. The redundancy in the final result is eliminated by selecting only the most interesting non-redundant subspace clusters. Interestingness of the subspace cluster is found based on the number of vertices and dimensionality[17].
-
III. Proposed Methodology
The spread of the data in the subspaces of different dimensionalities may vary. The Euclidean distance b etween a pair of objects (X,Y) is estimated as
√∑/=1( Х[ - Y[ )2 which is additive in nature for increase in dimensions. This results in increased distance between the same pair of objects when considered in higher dimensional subspaces, leading to reduced density in higher dimensional subspaces referred to as density divergence. In other words, the average density of objects decreases with increase in the dimensionality of the subspaces. For example, Consider a dataset with A1, A2, A3 as attributes. A1A2 subspace may contain denser clusters compared to A1A2A3 subspace. The authors propose to capture the variation in density with appropriate variation in the value of epsilon while keeping the minpts as constant.
In this paper, k-d subspace refers to the set of k-dimensional subspaces denoted by SK while sk is one among them. maximum_distancesk corresponds to the distance between the farthest pair of data objects in a given subspace, sk. epsilonSk is proportional to the maximum_distanceSk which increases with the number _ of dimensions of the subspace. minpts is one of the user defined input value provided to the algorithm with which core point identification is made. A core point is the data object which has at least minpts number of data objects within epsilonSk - neighborhood of it. | D | is the total number of data objects in the data set D. The clustering process proceeds with the dynamically computed epsilon value for each subspace using the following formula(1).
-
■i sv _ minpts ∗ maximum _ distanced Z1.
epsilon = ∗ 5 ⃓ _ (1)
The algorithm begins to form one dimensional subspace clusters. Each cluster in subspace s k is further partitioned into one or more clusters in higher dimensional subspaces, s k+1 . Thus the higher dimensional subspace clusters are explored in the divisive hierarchical manner.
Partitioning of a cluster into higher dimensional subspace clusters is implemented as a function 'GenerateClusters' which has two versions; Generateclusters_DD to deal with density divergence and Generateclusters_MDC to deal with multi-density bahavior along with density divergence. While Generateclusters_DD uses fixed value of epsilonSk to form all clusters in subspace sk, the second version Generateclusters_MDC estimates the value of epsilon separately for each cluster through step wise refinement.
The proposed algorithm invokes appropriate version of the procedure Generateclusters. When data is uniformly spread in clusters in a subspace as shown in Fig.1. Generateclusters_DD is appropriate to form dense clusters. However, it may not handle data which non-uniformly spread in the subspace as shown in Fig. 2. If the same epsilon value for all the clusters within a subspace is used for cluster formation, there is a chance of outliers included as cluster members and it is also possible that different clusters of varied densities may merge into a single cluster. For example, consider data shown in Fig. 2 in a particular subspace sK. epsilon sk computed using formula(1) would merge both the clusters C1 and C2 as a single cluster and the closely packed cluster C3 as another cluster which also includes the nearby noise data points as its cluster members.
The procedure Generateclusters_MDC handles this problem and extends the applicability of the algorithm to the data sets that contain subspaces with multi- density behavior. The algorithm invokes the procedure Generateclusters_MDC to handle multi density clusters in subspaces. Based on the spread of data, the proposed algorithm either invokes GenerateClusters_DD or GenerateClusters_MDC when GenerateClusters is invoked.
GenerateCandidateSubspaces(S k-1 ) function generates the k-d candidate subspaces by joining two (k-1)-d subspaces through prefix matching as in SUBCLU.
Proposed Algorithm:
Input: Data set D, minimum points minpts , delta
Output: Dense subspace clusters of varied dimensionalities.
Step1: S 1 ← set of attributes of D;
For each attribute defining 1-d subspace, s 1 ∈ S 1 GenerateClusters(D, s 1 );
Step2: Repeat until no clusters are formed in k-d subspace or maximum k is reached
S k ← GenerateCandidateSubspaces(S k-1 );
For each k-d candidate subspace, s k
-
a) for each constituent subspace sk-1 , find the coverage of objects in clusters.
-
b) bestSk = s k-1 with minimum coverage.
-
c) Each cluster formed in the subspace bestSk is taken as input data D', for further partitioning into clusters in the projected k-d candidate subspace.
GenerateClusters(D', s k );
End for k=k+1;
End
GenerateClusters_DD(D', sk)
-
1. The epsilon in the projected subspace s k , is calculated using the formula (1).
-
2. Label data points as core, border and noise points.
-
3. Core data points are connected using the concept of density connectivity to form the clusters.
-
4. Density reachable border points are assigned to the appropriate clusters.
-
5. Noise points are ignored.
GenerateClusters_MDC(D', sk)
-
1. epsilonsk is initialized to half of the epsilon value computed by the formula(1).
-
2. Select an unclustered data point, p in s k as a seed point to create a new cluster, C P .
-
3. While (p is not a core point)
-
a) Increment epsilonSk by delta .
-
4. Include all core points in the epsilonSk -neighborhood in the cluster CP.
-
5. Extend the epsilonSk - neighborhood by cascade to include maximal points in C P .
-
6. Calculate average distance of the cluster members excluding the seed point.
-
7. If this average distance is lower than the epsilon value using which the cluster is formed, then label the seed point with which the cluster is generated as an outlier, and select an alternative member of the cluster as a seed and repeat steps3-7 after unlabelling the cluster members .
-
8. Repeat steps2-7 to cluster the remaining data objects.
The second version of GenerateClusters,
GenerateClusters_MDC, partitions the dataset D' into multiple higher dimensional subspace clusters after finding appropriate value of epsilon separately for each cluster. While Step1 initializes epsilon to a common value based on the subspace s k , Step3 refines it to an appropriate value for each cluster based on the spead of data objects around the seed point selected in step2. Steps 4&5 generate the cluster whose validity is checked in steps 6&7. If the seed point happens to be an outlier, a new cluster is formed around an alternative seed selected from the denser region.
-
IV. R esult A nalysis
The proposed algorithm is tested on synthetic data sets and bench mark data sets from UCI repository[18]. The following are the bench mark datasets that are considered as input for evaluating the performance of the proposed algorithm: column_2C_weka, column_3C_weka, Seeds, User Knowledge Modeling, Wholesale customers, Steel plates, Yeast, Banknote authentication, Image segmentation, Wine quality. In this paper, the most widely used metrics for cluster quality estimation namely, purity and Silhouette Coefficient(SC) are used.
Purity of a cluster Ci is the ratio of maximum number of its cluster members belonging to a single class referred to as majority class , ty to cardinality of the cluster. The Purity of the complete cluster solution containing k clusters is the weighted sum of purities of constituent clusters simplified as an expression given below.
Purity = ∑^=1 maxj | Ct ∩ tj | (2)
All experiments were run on a workstation with a 2.40GHz processor and 3GB RAM. The results are plotted in the following graphs and are analyzed. The SUBCLU and the proposed algorithm with both the versions of GenerateClusters are run by fixing minpts to 2 and to 3. When experimented over different benchmark datasets, the purity of the resulting subspace clusters are depicted in Fig.3 and Fig.4. The corresponding purity values are tabulated in Table1 and Table.2. The highest values of purity are shown in bold.
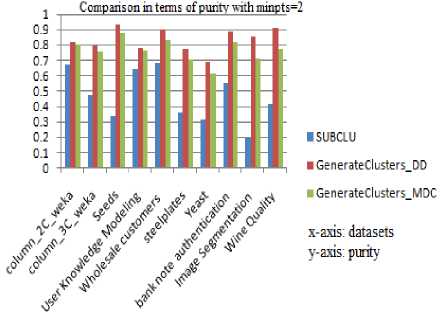
Fig.3. Comparison in terms of Purity with minpts =2
Table 1. Purity values with minpts =2 for various data sets
|
Comparison in terms of Purity with minpts =2 |
|||
|
Data sets |
Algorithm |
||
|
SUBCLU |
GenerateC lusters_DD |
Generate Clusters_ MDC |
|
|
column_2C_weka |
0.674248474 |
0.8213372 |
0.8003196 |
|
column_3C_weka |
0.47951849 |
0.7940609 |
0.7545039 |
|
Seeds |
0.341500302 |
0.9352973 |
0.8818567 |
|
User Knowledge Modeling |
0.641625166 |
0.7786944 |
0.7676558 |
|
Wholesale customers |
0.681412576 |
0.9042073 |
0.836976 |
|
steelplates |
0.365128424 |
0.7744555 |
0.7019784 |
|
Yeast |
0.316641319 |
0.6899376 |
0.6168232 |
|
bank note authentication |
0.555371966 |
0.8860431 |
0.821926 |
|
Image Segmentation |
0.197577078 |
0.8585674 |
0.7090108 |
|
Wine Quality |
0.417290896 |
0.9078469 |
0.7721775 |
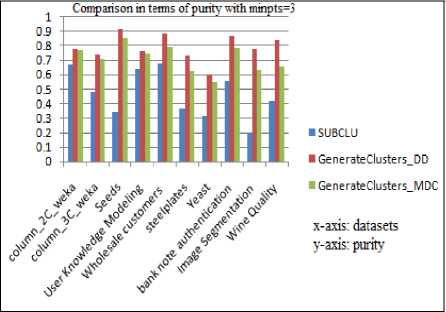
Fig.4. Comparison in terms of Purity with minpts =3
Table 2. Purity values with minpts =3 for various data sets
|
Comparison in terms of Purity with minpts=3 |
|||
|
Data sets |
Algorithm |
||
|
SUBCLU |
GenerateClu sters_DD |
GenerateClus ters_MDC |
|
|
column_2C_weka |
0.6742485 |
0.78216113 |
0.771274706 |
|
column_3C_weka |
0.4795185 |
0.74422227 |
0.709969901 |
|
Seeds |
0.3415003 |
0.91837329 |
0.852464349 |
|
User Knowledge Modeling |
0.6416252 |
0.76056816 |
0.745172943 |
|
Wholesale customers |
0.6814126 |
0.8838098 |
0.791803466 |
|
steelplates |
0.3651284 |
0.73553074 |
0.628717516 |
|
Yeast |
0.3166413 |
0.60488874 |
0.546837382 |
|
bank note authentication |
0.555372 |
0.8726722 |
0.782838269 |
|
Image Segmentation |
0.1975771 |
0.77536369 |
0.633278062 |
|
Wine Quality |
0.4172909 |
0.83692003 |
0.65396138 |
It can be observed that both the versions of the proposed algorithm produce better quality subspace clusters than SUBCLU in terms of purity. Estimation of Purity requires class label information and hence is applicable to supervised datasets only.
The quality of subspace clusters is also analyzed in terms of Silhouette Coefficient(SC) which is applicable to unsupervised datasets also. Silhouette Coefficient estimates the quality of a cluster in terms of the cohesion among the members of the cluster and separation of the cluster to its closest cluster. The value of SC varies between -1 to +1 and higher values of SC implies better quality clusters.
For object i, let 'a' be the average distance of object i to all other members of its own cluster. Calculate the average distance of the object, i to all the members of other clusters separately to identify the minimum of such average distances which is denoted by b.
For each data object i, calculate Silhouette Coefficient(SC) using formula(3)[19].
SC(i) = b a
4 7 Max(a,b)
Once the SC value of all the data objects are obtained, the average SC value for each cluster is calculated. For the given subspace, S the weighted average SC value is computed using Formula(4).
0.32 is the weighted average SC value for a subspace S. The average of weighted average SC values for all the subspaces is the overall SC value of the solution resulted by the algorithm.
The Silhouette Coefficient of resulting subspace clusters when SUBCLU and the proposed algorithms are executed with minpts =2 is depicted in Fig.5 and the same with minpts =3 in Fig.6. Their corresponding values are tabulated in Table.3 and Table.4.
Table 3. Silhouette Coefficient values with minpts =2 for various data sets
|
Comparison in terms of Silhouette Coefficient(SC) with minpts=2 |
|||
|
Data sets |
Algorithm |
||
|
SUBCLU |
GenerateClu sters_DD |
GenerateClus ters_MDC |
|
|
column_2C_weka |
-0.028408 |
0.15049693 |
0.543261075 |
|
column_3C_weka |
0.1504969 |
0.15049693 |
0.543261075 |
|
Seeds |
-0.566977 |
0.15404456 |
0.522370563 |
|
User Knowledge Modeling |
-0.520106 |
0.12128427 |
0.172027148 |
|
Wholesale customers |
0.0902658 |
0.11427645 |
0.586456344 |
|
steelplates |
-0.100137 |
0.08304824 |
0.541868884 |
|
Yeast |
0.4809631 |
0.26788616 |
0.456503886 |
|
bank note authentication |
-0.999951 |
0.42483534 |
0.429296317 |
|
Image Segmentation |
0.1660879 |
0.0988563 |
0.470939441 |
|
Wine Quality |
-0.028408 |
0.36419685 |
0.560109853 |
Comparison in terms of Silhouette Coefficient aith minpts=-
0.8
SC(S) = {^ 1[=В*2=а>]..=2.} (4)
V i e Cj; i ,j e N p is number of clusters in a given subspace S.
m is the number of data objects in a cluster j.
Consider a data set D, |D| =50. For suppose if a subspace S has 3 clusters with 5, 15, 30 as their cardinalities respectively and average SC value of each cluster is 0.2, 0.4, 0.3 respectively. The weighted
Silhouette Coefficient (SC) is calculated for each subspace S as given below:
SC(S) =0.2*(5/50)+0.4*(15/50)+0.3*(30/50) =0.32
0.6
0.4
0.2
-0.2
■ SUBCLU
■ ji-
-9^zt
-0.8 c
-1.2
3*
■ GenerateClusters_DD
GenerateClusters_MDC
x-axis: Datasets у-axis: SC
Fig.6. Comparison in terms of Silhouette Coefficient(SC) with minpts =3

Fig.5. Comparison in terms of Silhouette Coefficient(SC) with minpts =2
Table 4. Silhouette Coefficient values with minpts =3 for various data sets
|
Comparison in terms of Silhouette Coefficient(SC) with minpts=3 |
|||
|
Data sets |
Algorithm |
||
|
SUBCLU |
GenerateClu sters_DD |
GenerateClus ters_MDC |
|
|
column_2C_weka |
-0.802653 |
0.23257767 |
0.633794896 |
|
column_3C_weka |
-0.802653 |
0.23257767 |
0.633794896 |
|
Seeds |
-0.566977 |
0.25030355 |
0.611294538 |
|
User Knowledge Modeling |
-0.525717 |
0.18078921 |
0.291255313 |
|
Wholesale customers |
0.0902658 |
0.18695768 |
0.649004368 |
|
steelplates |
-0.094614 |
0.17309808 |
0.497379303 |
|
Yeast |
0.4806237 |
0.36558912 |
0.484117375 |
|
bank note authentication |
-0.999951 |
0.48707566 |
0.39622691 |
|
Image Segmentation |
0.1654079 |
0.24751883 |
0.543704922 |
|
Wine Quality |
-0.0309 |
0.40063565 |
0.448299551 |
It can be observed that both versions of the proposed algorithm produce better quality subspace clusters than SUBCLU as they result in cluster solutions with higher Silhouette Coefficients(SC).
The performance of the algorithms is estimated in terms of execution time taken by it and recorded in Table 5 and Table 6 with minpts set to 2 and 3 respectively. It may be observed that the proposed algorithm performs orders of magnitude faster than SUBCLU algorithm as it eliminates exploration and formation of redundant subspace clusters.
Table 5. Comparison in terms of Execution time in milliseconds with minpts =2
|
Comparison in terms Execution time (in milliseconds) with minpts=2 |
|||
|
Data sets |
Algorithm |
||
|
SUBCLU |
GenerateClust ers_DD |
GenerateClust ers_MDC |
|
|
column_2C_weka |
17749 |
663 |
1236 |
|
column_3C_weka |
17602 |
668 |
1181 |
|
Seeds |
6686 |
425 |
1414 |
|
User Knowledge Modeling |
2704 |
316 |
479 |
|
Wholesale customers |
180406 |
7154 |
20380 |
|
steelplates |
11687400 |
117640 |
329366 |
|
Yeast |
9173689 |
388719 |
431694 |
|
bank note authentication |
249287 |
3592 |
5305 |
|
Image Segmentation |
25700782 |
291016 |
331127 |
|
Wine Quality |
103613062 |
244437 |
429281 |
When comparison is between the two versions of the proposed algorithm, version1 is better and optimal method of forming subspace clusters with maximum purity, minimum execution time and good Silhouette Coefficient for most of the bench mark datasets as they have subspaces containing clusters with almost equal density. Version2 is found to be promising on synthetic datasets generated to contain multi-density clusters in the same subspace.
-
V. C onclusion and F uture S cope
The main objective of subspace clustering is to mine true clusters hidden in subspaces. Density based subspace clustering algorithms focus on identifying dense clusters of arbitrary shape and size. Most of these algorithms in the literature are less effective and sensitive to the input parameters. Estimating the values for input parameters needs data analysis before hand, which may not be practical when dealing with high dimensional data. The proposed algorithm addresses the problem of density divergence and multi-density behavior of datasets through dynamic approach to parameter setting. The algorithm captures the variation in density with appropriate variation in the value of epsilon while keeping the minpts as constant.
The proposed algorithm deals with density divergence by fixing the input parameter namely epsilon dynamically based on the spread of the data specific to the subspaces. Version2 of the algorithm handles multidensity clusters in subspaces by setting the epsilon to the true neighborhood of the data points in a cluster being partitioned. Based on the spread of the data, either version1 or version2 of GenerateClusters procedure is called. This helps to identify true clusters and hence proved to be efficient in terms of cluster quality.
The proposed algorithm for subspace clustering follows hierarchical way of exploration of clusters as it partitions clusters at lower dimensional subspaces into clusters at higher dimensions. So the proposed algorithm suffers from some of the limitations of hierarchical clustering algorithms which could be handled as future extension.
Table 6. Comparison in terms of Execution time in milliseconds with minpts =3
|
Comparison in terms Execution time (in milliseconds) with minpts=3 |
|||
|
Data sets |
Algorithm |
||
|
SUBCLU |
GenerateClust ers_DD |
GenerateClust ers_MDC |
|
|
column_2C_weka |
19500 |
1123 |
1966 |
|
column_3C_weka |
19032 |
1077 |
1809 |
|
Seeds |
6536 |
811 |
2606 |
|
User Knowledge Modeling |
2605 |
421 |
655 |
|
Wholesale customers |
171257 |
9064 |
33259 |
|
steelplates |
18647365 |
223629 |
384912 |
|
Yeast |
12544122 |
874204 |
1007731 |
|
bank note authentication |
252065 |
4368 |
7675 |
|
Image Segmentation |
31862626 |
852014 |
1660267 |
|
Wine Quality |
189004483 |
823721 |
1566268 |
References An Efficient Algorithm for Density Based Subspace Clustering with Dynamic Parameter Setting
- Vishal M. Patel, Hien Van Nguyen, René Vidal, "Latent Space Sparse and Low-Rank Subspace Clustering," IEEE Journal of Selected Topics in Signal Processing, vol. 9, No. 4, pp. 691 - 701, 2015.
- Shaker K. Ali, Zainab Naser Azeez, Ahmed Abdul-Hussein Ouda, "A New Clustering Algorithm for Face Classification", International Journal of Information Technology and Computer Science (IJITCS), Vol.8, No.6, pp.1- 8, 2016. DOI: 10.5815/ijitcs.2016.06.01.
- Preeti Jain, Bala Buksh, "Accelerated K-means Clustering Algorithm", International Journal of Information Technology and Computer Science (IJITCS), Vol.8, No.10, pp.39-46, 2016. DOI: 10.5815/ijitcs.2016.10.05.
- Sirisha GNVG, Shashi M, “Mining Closed Interesting Subspaces to Discover Conducive Living Environment of Migratory Animals,” Proceedings of 4th International Conference on Frontiers in Intelligent Computing: Theory and Applications, AISC, Springer, Vol.404 pp.153-166, 2015.
- Ester M, Kriegel H, Sander J, and Xu X, "A Density-Based Algorithm for Discovering Clusters in Large Spatial Databases with Noise," Proc. 2ndInternational Conference on Knowledge Discovery and Data Mining, Portland, pp. 169-194, 1996.
- Kailing K, Kriegel H, and Kroger P, "Density Connected Subspace Clustering for High - Dimensional Data," Proc.4th SIAM International Conference on Data Mining, Lake Buena Vista, FL, pp.246-257, 2004.
- Chu Y, Huang J, Chuang K, Yang D, Chen M, "Density conscious Subspace clustering for high-dimensional data," IEEE Transactions on Knowledge Data Engineering, vol. 22, no.1, pp. 16–30, 2010.
- Zhang Huirong, Tang Yan, He Ying, Mou Chunqian, Xu Pingan, Shi Jiaokai,"A novel subspace clustering method based on data cohesion," in ModelOptik - International Journal for Light and Electron Optic, vol. 127, issue 20, pp. 8513-8519, 2016.
- Ghanbarpour and Minaei B,"EXDBSCAN: An Extension of DBSCAN to Detect Clusters in Multi-Density Datasets," In Iranian Conference on Intelligent Systems (ICIS), pp. 1-5, 2014.
- Agrawal R, Gehrke J, Gunopulos D, and Raghavan P, "Automatic subspace clustering of high dimensional data for data mining applications," Proc.1st international conference on Management of data, New York, U.S.A, pp. 94-105, 1998.
- Cheng C H, Fu A W, and Zhang Y," Entropy-based subspace clustering for mining numerical data," Proc. 5th ACM SIGKDD International conference on Knowledge discovery and data mining, New York, U.S.A, pp. 84-93, 1999.
- Goil S, Nagesh H, and Choudhary A, "Mafia: Efficient and scalable subspace clustering for very large data sets," Technical Report, Northwestern University, Evanston, 1999.
- Kelvin Sim, Vivekanand Gopalkrishnan, Arthur Zimek, Gao Cong," A survey on enhanced subspace clusterin," Data Mining and Knowledge Discovery, vol. 26, no.2 pp. 332-397, 2013.
- Kriegel H P, Kroger P, Renz M, and Wurst S,"A generic framework for efficient subspace clustering of high dimensional data," In proceedings International Conference on Data Mining, pp. 250–257, 2005.
- Assent I, Krieger R, M¨uller E, and Seidl T,"DUSC: Dimensionality unbiased subspace clusterin," In proceedings International Conference on Data Mining, pp. 409–414, 2007.
- Müller E, Assent I, Günnemann S, Seidl T, "Scalable density-based subspace clustering," In: Proceedings of the ACM conference on information and knowledge management (CIKM), pp. 1077–1086, 2011.
- Stephan Günnemann , Brigitte Boden , Thomas Seidl, "DB-CSC: a density-based approach for subspace clustering in graphs with feature vectors," Proceedings of the 2011 European conference on Machine learning and knowledge discovery in databases, September 05-09, Athens, Greece, 2011.
- Datasets from UCI Machine Learning Repository, [online]. available at: http://archive.ics.uci.edu/ml
- Pang-Ning Tan, Michael Steinbach, Vipin Kumar, "Introduction to Data Mining," Addison-Wesley Longman Publishing Co., Inc., Boston, MA, 2005.
