An efficient data analysis based flood forecasting system (EDAFFS)
")
Author: Joel Tanzouak, Blaise Omer Yenke, Ndiouma Bame, Rene Ndoundam
Journal: International Journal of Information Technology and Computer Science @ijitcs
Article in issue: 2 Vol. 11, 2019.
Free access
Among natural disasters observed each year, flood represents 40% and remains one of the most important problems that many governments want to solve. Each year flood is responsible for many damages that cost a lot of money and even lot of people’s life. To reduce these damages caused, flood forecasting and warning systems which are able to alert people when a flood occurs have been built. However, most of these flood forecasting systems(FFS) are usually designed for specific regions and mostly for developed countries and are not suitable for developing countries because of climatological and environmental parameters difference. The problem of flood forecasting in developing countries could be explained in one part by the lack of meteorological stations and hydraulic stations necessary for flood forecasting systems to make predictions. Moreover, existing flood forecasting systems, have forecast accuracy problem because of constant changes of the environment and climate usually caused by anthropic factors. To face these problems, this work proposes an auto-adaptive flood forecasting system based on hydraulic models and data analysis techniques on meteorological and wireless sensors networks data to realize reliable forecast. The large number of experiments conducted show that the solutions proposed in this work performed well.
Flood forecast systems, Wireless sensors network, Data analysis
Short address: https://sciup.org/15016337
IDR: 15016337 | DOI: 10.5815/ijitcs.2019.02.05
Text of the scientific article An efficient data analysis based flood forecasting system (EDAFFS)
Published Online February 2019 in MECS DOI: 10.5815/ijitcs.2019.02.05
Among natural disasters, floods are recorded as the most frequent with 40% of occurrence of the total number of disasters which occurs each year [1]. The floods are indeed, the most present disasters in the four corners of the globe, the most recurring events with over 1822 events from 2001 to 2010, and the disasters which cause the most important quantity of damages. According to data collected in the database of [1], over the last eight years the developing countries were the most affected countries especially those of African and Asian continents with a cost estimated to 229 071 815 000 US dollars and 37 117 deaths. In these statistics, Africa alone has experienced 270 occurrences of floods, so an average of 33 occurrences per year. These flood affected 23,269,078 people and among these people, they were 5577 dead, 6569 injured, 726506 homeless and a financial cost of approximately 3,120,615,000 US dollars. These very alarming statistics give a particular characteristic to floods, which motivated researchers to address the issue of developing flood forecasting systems with a view of reducing as much as possible these damages. A flood forecasting system (FFS) can be assimilated as an information system that uses a dataset of meteorological, hydrological and geographical origins to predict the occurrence of floods and alert the authorities to take necessary actions. Indeed, there is a strong correlation between the damage caused by the floods and the time between the forecast and the onset of flooding [2]. It is therefore important to note that the longer the forecast time is; the more damages can be limited. However, the availability of the data enumerated above is a fundamental factor in the forecast process. Obtaining these data requires significant number of infrastructures like meteorological stations, radars, satellites, hydrological stations and geographic information systems (GIS). Unlike the industrialized countries, in most developing countries the availability of these infrastructures remain a big problem. For example, France alone has more than the double of the total number of meteorological stations in the following developing countries: Benin, Cameroon, Mali and Senegal. This situation of lack infrastructures makes very difficult the design of medium and long-term flood forecasting system. It is obvious that the designing of a flood forecasting system in developing countries context (where keys infrastructures like meteorological and hydrological stations are usually absent) remains a big challenge. So it would be therefore wise to find new ways of dealing with the problem of infrastructures to have reliable flood forecasting systems in developing countries.
Many solutions for effective FFS have been proposed but they are usually built for specific regions and most of them consider environmental parameters as static. However, these FFS are not well suited for all developing countries because of climatological differences and the lack of good meteorological infrastructures. Moreover, these systems are not able to adapt themselves to the environmental changes over the time or to new environments. The usage of FFS in a region relies on the ability to own good meteorological forecast data on the region and suitable hydraulic models. Therefore, some interesting questions could be asked: how can we improve the flood forecasting accuracy despite the poor quality of meteorological stations (MS) data?, how can we obtain flood forecast data in regions that misses meteorological stations or other tools needed to forecast atmosphere behavior? With anthropic factors the environment is continuously changing so it will be interesting to find how we can also make the FFS to adapt themselves progressively to these environmental changes. This work aims to propose a flood forecasting system that is able to collect, clean, integrate and analyze data for flood prediction using data analysis techniques and hydraulics models. The main contributions of this work can be summarized as the implementation of the architecture of a flood forecast system:
-
1. Able to improve the accuracy of the used Meteorological Stations (MS) forecast data,
-
2. Provide flood forecasting in some regions where there is no MS,
-
3. Adapt itself to new environment parameters, environment evolution and climates changes.
The rest of the paper is organized as follow: Section II details FFS problems in developing countries, Section III presents the state of the art, section IV shows the overview of the proposed FFS and presents its architecture. Section V presents the validation of the propose system. Conclusions and future directions ended this work.
-
II. Flood Forecasting Systems in Developing Countries
A significant number of flood forecasting systems have been implemented in the world [3], [5], [7–11] and most of them are based on sensors networks only and the others on MS forecast data combine with Hydraulic models. The sensors technology remain the very easiest and cheapest technology used in developing countries for flood forecasting. However, despite its efficacy in term of real time warning, the technology presents some limits and the main one is the forecasting delay which is usually too small (some few hours). In the other side there is FFS based on hydraulic models technology mostly used by developed countries which are more expensive than sensors based technology but which are able to provide an important forecasting delay, ie up to 10 days. Developing countries are facing many problems that constitute a drawback for them to build reliable flood forecasting systems based in hydraulic models combined with MS forecast data. Among all these problems, there are two problems which are important to address:
-
• MS forecast data availability and accuracy
problem
-
• FFS auto adaptiveness problem to progressive
environmental changes
-
A. MS forecast data availability and accuracy problem
-
a. Data accuracy problem
The data accuracy problem could be explained by many factors, such as the quality of meteorological tools used to make forecast, the climate change and the meteorological model used.
-
• The quality of used tools : MS needs good quality tools like drone or sophisticated radars to produce good forecast. This is the reason why most developed countries have opted for satellites, sophisticated radars, drones, etc. These elements play an important role in the accuracy of meteorological forecast. However, this kind of tools are usually beyond the budget for most of developing countries so they need to find other issues to improve the accuracy of their MS forecast data.
-
• Climate change: Climate change is responsible of many surprises in the field of meteorology. This phenomenon is continuously growing and it repercussion are observed every year. So, to make accurate forecast with this phenomenon we need to find more efficient issue mainly in case of developing countries.
-
b. Data availability problem
There are numerous tools used to solve the problem of meteorological forecast data availability an accuracy in developing countries. Solutions have been proposed from weather observing networks [12] to observing technologies built around cell towers [13–16] and also smart phone and sensor as weather observing systems [17]. According to [2], developing countries deploy wide variety of these technologies to observe the weather at a range of spatial and temporal scales. However, these elements are available for just a few developing countries. Moreover, the data harvested from existing solutions are mostly observed data while forecast data are very useful for long term flood forecasting. The main problems of meteorological forecast data availability and accuracy in developing countries are based on:
-
• Financial aspect : The cost of meteorological tools is high. For instance, deploying satellites, drone or some sophisticated radar used to observe the atmosphere behavior is beyond the budget of several countries.
-
• Qualified human resources: Developing
countries usually received gift from developed countries to build meteorological stations. However, such gift is not coupled with the training of the human resources and may jeopardize the maintenance or the follow-up. The work presented in [2] points out the fact that MS center in developed countries often have experienced administrative, engineering, and technical staff to oversee the acquisition, the installation, maintenance, calibration of their weather observing networks. This is not usually the case for developing countries.
Based on these observed problems, it is important to find out effective solutions to make flood forecasting available in most regions of developing countries as much as possible despite the less number of Meteorological infrastructures. For flood forecasting, precipitations and temperatures data are mostly used. So, if in a given town there is only one meteorological station, it would be interesting to exploit this station to make some prediction in nearest areas which are not covered by the meteorological station in other to facilitate the flood forecasting.
-
B. FFS auto-adaptiveness problem
As points out in the introduction, the climate and environment changes caused by anthropic factors have an important impact in the quality of forecast data provided by FFS, based on hydraulics models. In fact, hydraulics model need to be calibrated when they are deployed in a given zone, to simulate the hydraulic cycle of the zone. In that case if after calibration, there are some changes due to any kind of environmental factors, the hydraulic model need to be re-calibrated and re-evaluated to ensure that the new models configuration is suitable regarding the new configuration of the zone. However, if some changes are happening frequently, the recalibration process will be a very difficult task. So the process of recalibration will need to be automatized. Moreover, if the system is taking from a region to another region the forecast capacity will change because the used hydraulic model was not calibrated for the new region. Let us take for example such FFS built in Europe and which is brought in sub-sahara Africa. According to the climatological context in Europe, the hydraulic model need to take in consideration snow, but in sub-sahara Africa, there isn’t snow. So the system has to be re-calibrated because if not, the produced forecast values will be not accurate and could be even false.
-
III. Related Works
Many solutions have been proposed to make flood forecasting. Among these solutions the most recent and interesting solution found are presented in this section.
The authors of [18], have presented a system based on WSN. The system mainly uses four types of sensors to perform flood prediction in an area crossed by a river that often gets out of its bed and causes several damages. Among these sensors, one is responsible for measuring the level of the river, another for measuring the flow of the river, the third for the transmission of data and the last for the computing. This system has a relatively low cost because it requires only a few number of sensors and does not require MS data. Thanks to its super node, the system can analyze the levels of the river and is able to predict this level for next hours. However, this system does not take into consideration other important parameters involved in the occurrence of floods such as rainfall intensity forecast for example; This situation gives to this system, a relatively short forecast period of a few hours making the system inefficient in a heavily populated area.
Ref [3] the authors used multi-variable linear regression to make the prediction using polynomial approximation, based on the data sent by a sensors network, this solution is very simple and cost effective the sensors network of the system have some super node in charge of the computation, another instance of the algorithm is running in a central office and each time that the computation node in the sensors network send an alert, the alert is verify on the local algorithm before alerting the authorities. This model has the advantage to integrate a non-fixed number of parameters and has a reliable time. Nevertheless, the fact that it can integrate a lot of parameters does not guaranty that the system knows how to fix the impact degree of the added parameters in the estimation of the flood risk, also the main problem remains the time that is not enough in case of a very big number of persons that could be affected.
The authors in [4] present a web system that transmits real-time information on the state of a risk area, including the water level thanks to a sensor that measures and relays information to the system. This situation allows the citizens to follow the state of the risk area and in case of critical water level, preventive measures are taken. The system works well, however it is a monitoring system and not a prediction system because it is not able to predict a future level of water. This system has not a delay it only provides real time information and these it is not suitable for place where there is an important number of people because they will not have enough time to evacuation in case of emergency.
Ref [7] the authors present real time flood monitoring and warning system for a selected area of Thailand. The objectives of the system were to serve as an information channel for flooding between authorities and expert and as a web based information source for the population. The developed system is composed of three major components: sensors network, processing/transmission unit, and database/application server. The real-time data of water condition can be monitored remotely by utilizing wireless sensors network that transmit measured data to an application server. The application server allows users to view real-time water condition as well as the forecasting of the water condition directly from the web via web browser or via WAP. The application server is also able to send warnings to the responsible authorities in case of emergency. The system is very interesting but designed for a limited time delay.
Ref [11], the authors used three different types of sensors: a precipitation sensor, a temperature sensor and another for the water level in the risk zone. The main purpose of this technique is to establish a strong correlation between these three variables. By having information on rainfall and temperature with an initial level of water in the risk area (river) at a given time, they will be able to estimate the level of the river at the next moment. In this case if the estimated level of water is critical, an alert will be sent. This system is not expensive, since it uses only sensors. Indeed, the alerts it gives are mostly real. Nevertheless, the system considers only precipitation and temperature as the only parameters that can influence the rise of the water level and cause risks of flooding. However, other parameters such as evapotranspiration, water infiltration rate and runoff quality also contribute to the risk of flooding. It also provides a low forecast delay.
Ref [5] the authors proposed a medium-term flood forecasting system. The system is based on numerical weather prediction data (NWP) provided by meteorological stations and a hydraulic model called Listflood used by the European flood warning system. NWPs are used as input for the hydraulic model and the data collected in real time are used as initial conditions of the forecasting process. The hydraulic model then simulates the hydraulic processes of the region and produces forecast of the river level according to the given inputs and other parameters. This system works well, but it uses a specific hydraulic model for a given region and therefore it is difficult to the model to be deported in another region with different climatological and geomorphological characteristics. In that case, it will require a full reconfiguration. Moreover, the accuracy of the systems forecasts depends heavily on the NWP data.
If ever this data turns out to be inaccurate, the quality of the forecasts could be altered. Unfortunately, this system does not provide verification step of the accuracy of the input data. The system also considers some parameters such as soil topography, soil permeability and even soil vegetation as static. But these parameters can become dynamic because of anthropic factors which can cause several changes in soil and vegetation topography (soil compaction, deforestation, etc.). This phenomenon can considerably modify the hydraulic regime of the area and affect the quality of the forecast.
The simulations of the hydraulic model will be no longer conformed to the reality.
The authors of [19] introduced the European Flood Alert System (EFAS). The aim of this system is to fight against the floods that occur in many rivers in Europe. The system uses NWP with a hydraulic model. The system also uses data from geographic information systems (GIS) with some meteorological data from the past to make predictions. Despite the fact that The system is working well and has delivered good results with satisfactory deadlines, some data in the system are considered static:
-
1. Land use,
-
2. Geometry of the channel,
-
3. River Topography,
-
4. Vegetation.
Indeed, they may change over time with the increase of human activities that can change at least one of them at any time. This a self-adaptation problem to environmental changes.
-
IV. Edaffs Overview
Efficient Data Analysis Flood Forecast System (EDAFFS) is a customized flood forecast system which uses observed and forecast data and associate them with data analysis techniques and hydraulic models to make flood predictions. The data needed include MS past forecast data combined with sensors network observed data. According to the type of information, specific tools are needed. So for real time information we need radar, satellites, drones, and/or sensors networks. For meteorological data, we need forecast from meteorological stations. But since we are in developing countries context, the suitable solution for real time data collection will be sensors network because they can cover a large area and are not expensive like satellite and drones or radars. In the following subsections, the role of sensors networks and meteorological stations in EDAFFS will be presented.
-
A . EDAFFS main components
EDAFFS uses sensors network for real time data collection, meteorological station for precipitation and temperature forecast and hydraulic models for hydraulic cycle simulation.
-
1. Sensors network : A WSN (Wireless Sensors Network) is an adhoc network especially consisting of a number of wireless sensors that are deployed on a given area, to ensure an accurate task, either for monitoring or for tracking or for both [20]. Sensors are measuring and sending in real time the measured data to a remote base station and these data are then processed by EDAFFS.
-
2. Meteorological DATA : MS provide Numeric weather prediction (NWP) data on a certain delay. This delay of forecast is exploited by EDAFFS to provide flood forecast daily forecasts.
-
3. Hydraulic model : Hydraulic model is used by EDAFFS to simulate the hydraulic cycle in a given zone. Once EDAFFS has received MS forecast data (precipitation and temperature), it uses them as input with other types of data as input in the hydraulic model to predict the level of the water in the monitoring zone for a specific time
-
B. EDDAFS ARCHITECTURE
Fig. 1 presents the global architecture of EDAFFS. There is two main Modules in the EDAFFS architecture:
-
• The Data integration module
-
• The Analysis module
These modules work together to achieve the EDAFFS targets. Data integration is in charge of data collection, transformation, cleaning and storage. The data analysis module uses these collected data to analyze in order to produce forecast. In this module, all the application module needed are found. There are: correction module for to improve the MS forecast data accuracy, the extension module for MS forecast extension capacity and the Adjustment module for auto-adaptiveness. The adjustment module will be described in this work. The correction module description can be found in [21] and the extension module in [22].
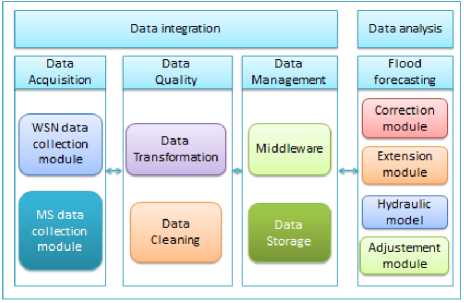
Fig.1. EDAFFS architecture
-
C. EDAFFS’s Module Interaction
Fig. 2 presents the sequence of process that the system follows to produce flood forecast data.
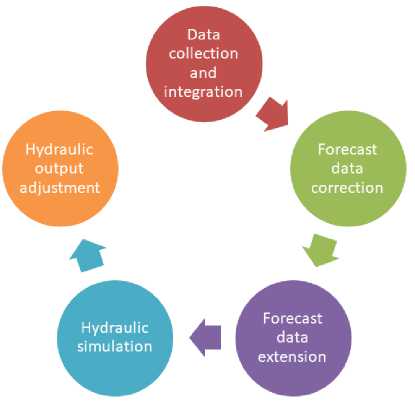
Fig.2. EDAFFS Process
These steps are described as follows:
-
1. The data are collected, treated and stored by the data integration layer,
-
2. The correction module [21] proceeds to the correction of forecast MS data to improve their accuracy based on the passed forecast and observed data stored before,
-
3. The extension module [22] evaluates the forecast data in region which has no MS, based on the forecast data received from the correction module of all region with MS,
-
4. The hydraulic model makes the simulation of the behavior of each monitored zone based on the input MS forecast data received from the extension module,
-
5. The adjustment module adjusts the output of the hydraulic models according to the past output and real observations stored in system database.
-
D. Data integration Module: DIM
Today, the number of applications that use sensors network has increased and even the number of sensors used by environment monitoring applications continue to increase and generate a huge quantity of data at an important speed which are usually called data flow [23].
Most of data which need to be used by EDAFFS are coming from WSN and MS. Some key problems have been identified based on general data integration challenges, and problems presented in [23].
-
a. Integration problems of MS and WSN data
We have a set of problems when we want to integrate data coming from different sources and with an important speed. These problems are:
-
1. Data acquisition : The problem here is to define an online system for massive data which is able to collect the data from their different sources with high speed.
-
2. Data cleaning : Error linked to sensor failure are usually observed in WSN. The failure can be
-
3. Scalability : The main problem here is that the
-
4. Heterogeneity : Since data provided by sensors network could have different format, some algorithms could have problem when processing those data because of data structure heterogeneity.
-
5. Timeless : The generated speed of wireless sensor
caused by energy problem or because of the hostility of the environment. A good integration system should discard redundant, outliers, missing data without losing important information.
WSN can increase the number of sensors and the number of generated data will also increase so in the integration process it is important to consider this point.
network is very high according to the needs, so the online algorithms have to be very fast in processing data to avoid the loosing of a significant quantity of data.
The set of problems presented above show the necessity to build an integration module for the MS forecast and WSN data. The integration module should take in consideration all the mentioned problem for a better functioning of the flood forecast system.
-
b. Data integration Module architecture
This module is the one that will ensure the collection processing and storage of data needed by the analysis module to make prediction. As shown in Fig. 1, the module has three layers and each layer has two components. These layers are presented as follow:
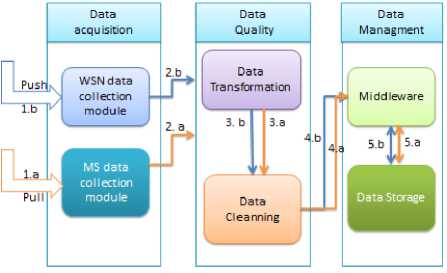
Fig.3. How does Data integration layer works
-
• Data acquisition layer : The data acquisition layer has two main components or sub-modules: the WSN data collection component and the MS data collection component.
-
1. WSN data collection component : The role of this module is to received data send via PUSH action by the sensors networks. The sensors data generate continuously flow data. To avoid the loss of these data since they are coming from many sources (zones), the module will use a customized sliding windows algorithm to manage incoming data.
-
2. MS data collection component : The role of this module is to collect data via PULL request to the
different MS databases. The module will use web service to access the data and collect it.
-
• Data quality layer: The data quality management layer has two main components: the data transformation component and the Data cleaning component.
-
1. Data transformation component: The role of this module is to harmonize data format of the collected data. For example, precipitation data format coming from zone A could be different from precipitation data format coming from zone B. The situation could also exist between different MS.
-
2. Data cleaning component: The role of this module is to ensure that data have good quality, which means that the module should detect and correct missing values, detect and remove outliers.
-
• Data management layer : The data management layer has two main modules: the middle-ware and data storage
-
1. Middle-ware: The role of this module is to make request to data storage for reading or storing data. If the request is coming from the data integration layer, then it will be a storing request. But if the request is coming from analysis module, it could be a reading or a storing request.
-
• The distributed database : The distributed database has the role of storing or sending data based on middle-ware request.
As shown in Fig. 3 the WSN module receives the set of data sent by the sensors network, after it has received a certain length of data it sends the data to the data transformation module which organize the data and harmonize their format. When the data transformation has finished, it sends data to data cleaning module which treat the data and ensure the data quality. After that, the data are sent to the data management layer mainly to the middle-ware which store each data to its right place in the database using storing requests. In parallel, MS data collection module sends pull request to remote MS databases to collect the current MS forecast and MS observation. Once the data are received, they follow the same process until the storage to databases.
-
E. Data Adjustment Module: DAM
The DAM, targets to adjust the produce hydraulic models forecast data regarding what is really observed by the sensors network in the monitored zone. Basically, observed data are collected from sensors network and they are used with forecast data produced by the hydraulic model in the system to realize the adjustment task. These forecast and observed data are used as input in a program in charge of deviation prediction. A deviation is the difference between a prediction p(t) at a time t and the observation obs(t) at the same time as shown in (1).
e ( t ) = P ( t ) - obs ( t ) (1)
The program uses a set of past deviations, to make the future deviation prediction. After, the learning program sends the predicted deviation to the adjustment program, which applies the required update
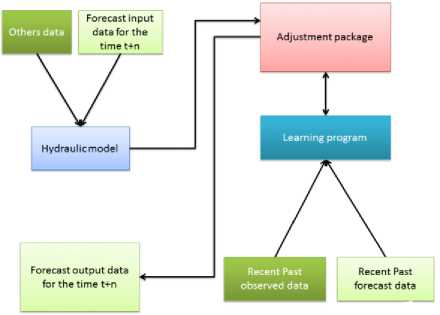
Fig.4. EDAFFS ’s DAM work principle
-
a. Adjustment formalization
The adjustment program uses the function:
ε ( t ) = α e ( t ) - (1 - α ) ε ( t - 1) (2)
where
-
• e(t) represents the deviation measured between a prediction and an observation at the time (t)
-
• ε ( t ) represents the prediction of the error at the
time (t)
-
• α represents the exponential smoothing parameter of the time series formed with the set of e(t). α ϵ [0; 1].
to make prediction of the future deviation using past errors. Regarding (1), if ε ( t - 1) > 0 it will means that the prediction P(t) made by the hydraulic model will be greater than the waiting observation Obs(t), so to adjust the predicted value P(t), we need to apply
A ( t ) = P ( t ) - ε ( t - 1) (3)
and consider A(t) instead of P(t).
But if in other hand, ε(t - 1) < 0 it will mean that the prediction P(t) made by the hydraulic model will be lesser than the waiting observation Obs(t), so to adjust the predicted value P(t), we need to apply
A ( t ) = P ( t ) + ε ( t - 1) (4)
Based on the two formulations above we can define (5) as a general expression of the adjustment equation.
A ( t + 1) = P ( t + 1) + - α e ( t ) - (1 - α ) ε ( t - 1) (5)
where:
-
• P(t+1) is the prediction received from the
hydraulic model at a time (t+1)
-
• ε(t-1) represents the prediction of the deviation at
a time (t-1)
-
• A(t+1) represents the adjusted prediction value at
the time (t+1)
The role of algorithm 3 is to evaluate the deviation after each prediction regarding to the observations. Algorithm 4 aims to adjust the prediction received from hydraulic model according to a predicted deviation.
Data : New observation data Obs(t)
Result : evaluated deviation e(t) between P(t) and Obs(t) while New observation Obs(t) is received do
-
• deviation(t)=P(t)-Obs(t)
-
• Save (t, deviation(t))
end
Algorithm 1 : deviation evaluation
Data : New prediction data P(t)
Result : Adjusted value A(t) of the prediction initialization (α);
while New prediction P(t) is received do
Predict the potential deviation on the prediction received using (2)
if (ε (t - 1) >0) then
-
• A(t)=P(t)-"(t - 1);
-
• Save (t, P(t), A(t)), use A(t) instead of P(t) for the flood alert evaluation;
else
-
• A(t)=P(t)+|ε (t - 1) |) ;
-
• Save (t, P(t), A(t)), use A(t) instead of P(t) for the flood alert evaluation;
end end
Algorithm 2 : Data adjustment
-
V. EDAFFS’S Validation
To validate the EDAFFS system, we need to make validation of different components of the analysis which responsible of the flood forecast. The validation of the correction module and the extension module can be found in [21], [22].
-
A. EDAFFS’s DAM validation
-
a. Data description
To evaluate our adjustment module, we used measured groundwater level data collected daily during 1 hydraulic year in small region in Senegal and we also used groundwater forecast data made by a hydraulic model for the region during the same time. The scope of this test is to show how EDAFFSs DAM uses past errors made between the forecast data and observation data, to adjust the future forecast data in the aim of reducing the deviation between hydraulic prediction and real observation. We want to remind that we use a model which is not suitable for the region, because we want to materialize the fact that the environment can change or the model could be taken to another region instead of the region where it was designed. So if the model is in another region or if the environment of the model has changed, the model will be not suitable for the new condition and will need recalibration. We want to show by this simulation how the EDAFFSs DAM can reduce the deviation of the model despite these changes. In others words, this test shows how, if a hydraulic model designed and calibrated for a given region is taking to another region, the forecast deviation done by the hydraulic model in the new region will be adjusted gradually until the system reach to a stable mode where the deviation between prevision of the hydraulic model and the observation realized on the groundwater will be minimized. To characterize the efficiency of the module, we use δ defined in (6) as our accuracy indicator,
N - 1
δ = 1
N i = 0, Y i ≠ 0
where
-
• Y represents observed value
-
• X represents forecast or adjusted values
-
• N is the size of data observed
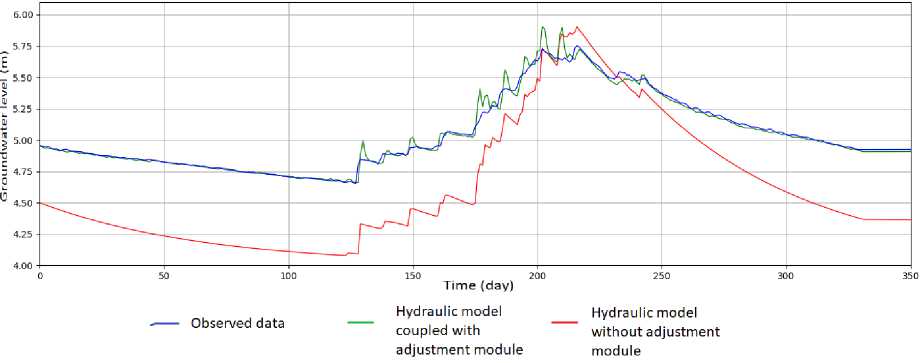
Fig.5. EDAFFS’s forecast vs Basic hydraulic forecast
-
b. Results and discussion
According to Fig.5, it can be observed that the difference between forecast of the hydraulic model and the observation is significant, as the accuracy indicator for forecast data is δ=0.08. This difference between the hydraulic model and the observation could be explained by the fact that the hydraulics model is not suitable for the zone and need to be re-calibrated to work well. This situation could illustrate the potential behavior of a hydraulic model when the initial environment conditions have changed. In the same time, it can be observed that the difference between forecast of EDAFFSs DAM and the observation is very low, as the accuracy indicator for EDAFFSs DAM is δ=0.003 which is largely smaller than the accuracy indicator of the hydraulic model alone (0.003 over 0.08). This low difference between EDAFFSs DAM and the observation could be explained by the auto-adaptiveness behavior that the adjustment module gives to EDAFFS. At each time the adjustment module tries to anticipate the deviation on the future forecast and use it to adjust the prediction produce by the hydraulic model. This figure portrays in a very simple way the efficacy of the adjustment module in the improvement of the forecast capacity of the hydraulic Model. The difference between these curves materialized by the different values of δ shows that the adjustment module has a great impact on the forecast
-
c. Comparison with other flood system
To compare the EDAFFS system to others systems, we defined some evaluation parameters. These parameters are described as follow:
-
1. Capacity to correct input Data : when the input data used for forecast are not accurate, is the system able to improve this accuracy?
-
2. Capacity to provide forecast in zones where there is no MS : if we don’t have MS data in a region, how does the system react? Is it able to provide forecast?
-
3. Capacity to adapt itself to environmental changes : When the environment has changes because of anthropic factors, is the system able to adapt itself without recalibration process?
-
4. Time delay (the using of forecast data and MS data), does the system have a time delay greater or equal to 1 day?
Table 1. EDAFFS vs Others flood forecast systems
|
Examples |
Correct its input Data |
Capacity to provide forecast in zone where there is no MS |
Capacity to adapt itself to environmental changes |
Time delay |
|
|
EDAFFS |
yes depending proximity |
Medium, can be high according to the hydraulic model used |
|||
|
Systems based on Sensors network |
[3],[4],|7], [И] |
weak |
|||
|
Systems based on hydraulics models Meteorological Stations |
[5],[19] |
The Table 1 shows that the different modules of EDAFFS system, give to this system a particularity characteristic in the field of flood forecasting system. As we can see in this table, EDAFFS can be auto-adaptive thank to its adjustment module, improve its input data accuracy thank to its correction module, and even provide forecast in zones where there is no MS thank to its extension module.
-
VI. Conclusion
This work focuses on the construction of a flood forecasting system based on data analysis to make flood prediction in the context of developing countries. To achieve this goal, a flood forecasting system architecture is proposed, based on two main modules: the data integration module (DIM) and the data analysis module. The role of the data integration module is the collection, the transformation, the cleaning and the storage of the data needed for the flood forecasting. The DIM’s architecture proposed in this work consists of six components that realize these enumerated tasks. The role of the data analysis module is to process data in order to make flood forecasting. Three main components or submodules are proposed: the correction module that improves the MS forecast data accuracy, the extension module that gives forecast of precipitation and temperature in regions which does not have MS, and finally a data adjustment module that gives to the system an auto-adaptive behavior which is very necessary for environmental changes. The large number of experiments conducted on the proposed solutions show that these different modules performs well and lead to accurate flood prediction. The good performance obtained allows to argue that these modules are ready to be used in a real environment.
Acknowledgment
We thank the Computer Science Laboratory of the Doctoral school of Mathematics and Computer Science of the University Cheikh Anta Diop, for it materials and intellectual support during this work. We also thank the Pr Serigne FAYE and his laboratory members for their support to this work.
References An efficient data analysis based flood forecasting system (EDAFFS)
- http://www.emdat.be/database, “Emergency database,” 2017.
- J. T. Snow, “Non-traditional approaches to weather observations in developing countries,” report on International Finance Cooperation Group, 1-48, 2013
- V. Seal and A. Raha, “A simple flood forecasting scheme using wireless sensor networks,” International Journal of Ad hoc, Sensor and Ubiquitous Computing, vol. 3, no. 1, p. 16, 2012.
- K. K. Khedo, “Real-time flood monitoring using wireless sensor networks,” The Journal of the Institution of Engineers Mauritius, p. 11, 2014.
- V. Thiemig1 and B. Bisselink1, “A pan-african medium-range ensemble flood forecast system,” Hydrology and heart system science, vol. 19, p. 21, 2015.
- F. Pappenberger, K. Beven, and al, “Cascading model uncertainty from medium range weather forecast (10 days) through a rainfall-runoff model to flood inundation predictions within the european flood forecasting system (effs),” Hydrology and heart system Science, vol. 4, no. 9, 2005.
- S. J. and Ootamakorn, “Real-time monitoring and warning system,” Songklanakarin Journal of Science and Technology, vol. 2, no. 33, p. 8, 2011.
- B. Boulton and T. van Kalken, “Hydraulic models needed for flood forecasting,” Water Engeneering Australia, June 2011.
- H. Cloke and F. P. b, “Ensemble flood forecasting: A review,” Journal of Hydrology, June 2009.
- A. A. Pasi and U. Bhave, “Flood detection system using wireless sensor network,” International Journal of Advanced Research in Computer Science and Software Engineering, vol. 5, no. 2, 2015.
- E. Basha and D. Rus, “Design of early warning flood detection systems for developing countries,” in the proceeding of IEEE, bangalore, India, 2007.
- D. J. e. a. Parker, “The amma rawinsonde programs and its implications for the future of atmospheric monitoring over africa,” Bulletin of the American Meteorological Society, 815827, 2008.
- D. Atlas and C. W. Ulbrich, “Use of rain fade in wireless telephone signals to locate and estimate intensity of precipitation,” Journal of Applied Meteorology, 16, 13221331., 1977.
- A. Berne and R. Uijlenhoet, “Path-average rainfall estimation using microwave links: uncertainty due to spatial rainfall variability,” Geophysical Research Letters, 34, L07403, 2007.
- F. Fenicia, L. Pfister, D. Kavetski, P. Matgen, J. Iffly, L. Hoffman, and R. Uijlenhoet, “Microwave links for rainfall estimation in urban environment: Insights from an experimental setup in luxembourg-city,” Journal of Hydrology, 464465, 6978, 2012.
- H. Leijnse, R. Uijlenhoet, and J. N. M. Stricker, “Rainfall measurement using radio links from cellular communication networks.” Water Resources Research, 43, W03201. Messer, H., A. Zinevich, and P. Alpert, 2006: Environmental Monitoring by Wireless Communication Networks. Science, 312, 713, 2012.
- J. Brotzge, K. Hondl, B. Philips, L. Lemon, E. Bass, D. Rude, and D. Andra, “evaluation of distributed collaborative adaptive sensing for detection of low-level circulations and implications for severe weather warning operations,” Journal of Forecasting, 17318, 2010.
- K. S. Indira Priyadarshinee and C. Mallick, “Flood prediction and prevention through wireless sensor networking (wsn): A survey,” International Journal of Computer Applications, vol. 113, no. 9, p. 7, march 2015.
- J. Thielen, J. Bartholmes, and al, “The european flood alert system part 1: Concept and development,” Hydrology and Heart System Science, vol. 13, 2009.
- A. Ari, A. Gueroui, N. Labraoui, and B. O. Yenke, “Concepts and evolution of research in the field of wireless sensor networks,” International Journal of Computer Networks and Communications (IJCNC), vol. 7, no. 1, January 2015.
- J. Tanzouak, N. Bame, B. Yenke, and I. Sarr., “Sytem to improve numeric wheather predictions for flood forecasting systems,” in theproceeding of IEEE-SITIS conference, Jaipur, India, 2017.
- J. Tanzouak, B. Yenke, N. Bame, and I. Sarr, “System to extend forecast capacity of meteorological stations,” in the proceeding of ACM-ICGDA conference, Prague, Czech Republic, 2018.
- R. Cortes, X. Bonnaire, O. Marina, and P. Sensa, “Stream processing of healthcare sensor data: studying user traces to identify challenges from a big data perspective,” Elsevier Journal: Procedia computer science, vol. 52, 2015.
