An empirical comparison of missing value imputation techniques on APS failure prediction

Author: Siam Rafsunjani, Rifat Sultana Safa, Abdullah Al Imran, Shamsur Rahim, Dip Nandi
Journal: International Journal of Information Technology and Computer Science @ijitcs
Article in issue: 2 Vol. 11, 2019.
Free access
The Air Pressure System (APS) is a type of function used in heavy vehicles to assist braking and gear changing. The APS failure dataset consists of the daily operational sensor data from failed Scania trucks. The dataset is crucial to the manufacturer as it allows to isolate components which caused the failure. However, missing values and imbalanced class problems are the two most challenging limitations of this dataset to predict the cause of the failure. The prediction results can be affected by the way of handling these missing values and imbalanced class problem. In this paper, we have examined and presented the impact of five different missing value imputation techniques namely: Expectation Maximization, Mean Imputation, Soft Impute, MICE, and Iterative SVD in producing significantly better results. We have also performed an empirical comparison of their performance by applying five different classifiers namely: Naive Bayes, KNN, SVM, Random Forest, and Gradient Boosted Tree on this highly imbalanced dataset. The primary aim of this study is to observe the impact of the mentioned missing value imputation techniques in the enhancement of the prediction results, performing an empirical comparison to figure out the best classification model and imputation technique. We found that the MICE imputation and the random under-sampling techniques are the highest influential techniques for improving the prediction performance and false negative rate.
Air Pressure System Failure, Missing value imputation techniques, Classification
Short address: https://sciup.org/15016335
IDR: 15016335 | DOI: 10.5815/ijitcs.2019.02.03
Text of the scientific article An empirical comparison of missing value imputation techniques on APS failure prediction
Published Online February 2019 in MECS DOI: 10.5815/ijitcs.2019.02.03
The Air Pressure System (APS) is an essential part used in heavy vehicles where compressed air is used to press a piston that applies pressure to the brake pad to stop the vehicle. Air brakes or more formally known as pressurized air brake system uses the air pressure system (APS). This system is particularly useful in heavy vehicles that have multiple trailers. Advantages of having an APS other than a hydraulic system is that air can be found in abundance from nature and also for its suitability for multiple trailers.
The dataset we have used in this study is a public dataset collected from the UCI machine learning repository [22] that is composed of 60000 instances from Scania trucks. It consists of sensor data of Scania trucks after a system failure. The dataset consists of two classes. Positive class means failure occurred due to components related to APS. And negative class means the failure is not related to components of APS. The aim of this dataset is to correctly predict whether the causation of failure is due to APS or not. The prediction result is highly beneficial to the manufacturer as it will isolate the failed component in the shortest possible time. As the APS is linked to multiple other components, it is more difficult to identify whether the APS system is directly related to the failure or not. It is challenging to correctly predict failures which occurred due to APS as the dataset is highly imbalanced. Only 1000 occurrences out of the 60000 occurrences stated in the dataset are caused by an APS failure. Furthermore, missing value is another major concern the dataset as only 2% of the instances consists of data for all the attributes. In extreme cases, some instances have 80% of the values missing.
The dataset was first introduced in the Industrial Challenge 2016 at The 15th International Symposium on Intelligent Data Analysis [5] (IDA). The objective of this challenge was to predict failures occurred due to Air pressure system in Scania trucks from previously collected sensor data. The competition evaluated all the contestants by penalizing more for each error classifying the Negative class. 500 points were penalized for each false negative where only 10 were penalized for false positives. So the objectives of the teams were to minimize false positives. The dataset also has missing values. The problem this dataset poses is a classification problem in a high imbalanced dataset with a lot of missing values. Previously many researchers had tested different classifiers and performed feature engineering on this dataset. For instance, Christopher Gondek et al. [3] focused on feature selection and random forest for classification. They also handled missing values by replacing with the median. Ozan E.C et al. [4] discussed an optimized k-NN to predict the outcome and used KNN imputation to impute missing values. Cerquiera V. et al. [2] applied a meta feature engineering technique and dealt with missing values by removing with a high amount of missing values and also used SMOTE [24] for handling the imbalanced class problem.
Although researchers worked on handling missing values in this dataset they did not explore the impact of other modern missing value imputation techniques in this dataset which could significantly enhance the prediction performance the traditional techniques. To overcome the research gap, we have applied five popular missing value imputation techniques named Expectation Maximization, Mean Imputation, Soft Impute, MICE, and Iterative SVD to handle the missing values and evaluated their impact by applying five different classifiers: i) Naive Bayes ii) KNN iii) Random forest iv) Support vector machine and v) Gradient boosted tree on each imputed dataset. Finally, an empirical comparative analysis has been performed to find out the best imputation technique as well as the best classifier. We have handled the imbalanced class problem using an under-sampling technique. We have found that the Naive Bayes classifier performed better for all the imputed datasets before handling imbalance class problem but Random Forest classifier performed better on all the balanced datasets. Furthermore, we have identified the Mean imputation technique as the best missing value imputation technique for this dataset. However, if the false negative rate is only concern rather than accuracy, then Soft Impute outperforms other imputation techniques and Naive Bayes dominates over the other classifiers.
The rest of this paper is structured as follows - Section II briefly describes previous works done on the dataset. Section III contains the data description. After that Section IV includes the preprocessing of the dataset. Section V and VI contains the methodology and result analysis.
-
II. Related Works
Previous researchers worked on different techniques to build prediction models that were able to predict whether a vehicle faces imminent failure because of a specific component of the APS or not.
Cerquiera V. et al. [2] described a data mining workflow for predictive maintenance of heavy trucks. To deal with high quantity of missing values and high imbalance in class distribution of the dataset they followed four approaches - A filter that excludes a subset of features examples, a meta feature engineering method to create a meta-level feature set, a sampling method for imbalance class, and a boosted tree to learn the target concept. After following the approaches, the results showed that the meta feature engineering and boosted tree methods were critical for improving the performance of the classifiers.
Christopher Gondek et al. [3] used an approach to minimize overall costs for the air pressure system of Scania trucks. They used feature creation on a histogram. In their study, a combination of feature selection and feature engineering techniques had been applied while constantly evaluating results using the Random Forest classifier. The results they found were better than naive approaches of checking every truck for failure or reactive approaches of not checking any truck until failure.
Biteus, J et al [23] proposed a maintenance plan for Scania trucks using machine learning, constraint programming, and route optimization, Using the APS failure dataset they trained a predictive random forest model which given a new vehicle sensor data as input would compute a maintenance plan.
Different researchers had used different techniques while deciding the best imputation strategy for their dataset. There are mainly three strategies while dealing with missing values.
-
1) Deletion methods: If missing instances are low in number we can safely delete the instances with missing values. But deleting more than a few cases can have effect on the sample size. As sample size is directly linked to the performance of a model. Deleting large number of instances is not advised.
-
2) Mean/Mode Substitution: Replace missing values with sample Mean/Mode. It is a simple yet powerful technique to handle missing values. For example Muhammad U. Fahri et al [31] used mean imputation to predict student achievement based on motivation, learning and emotional intelligence. We discussed more about mean imputation later in the paper.
-
3) Model based methods: Using mathematical models to predict the missing values. For example Zhengbing Hu et al [32] tried to recover missing values using methods based on Computaional intelligence.
All of the researchers addressed the issue of the dataset having missing values but did not explore other state of the art imputation techniques. This paper aims to overcome this research gap by comparing five different imputation techniques whether it has any impact on predicting the failure or not.
-
III. Data Description
The dataset has been collected from the UCI Machine Learning Repository [22]. It consists of sensor data which was collected from everyday usage of heavy Scania trucks. The training set contains in total 60000 instances in which only 1000 are positive classes and the rest 59000 instances belong to the negative class. The test set contains 16000 instances in which 375 instances are of positive class and 15625 instances are of negative class. There is only 2% positive class and 98% negative class. So even if we classify all as a negative class, still we would get 98% accuracy. The total number of attributes is 171. The names of the attributes are anonymized due to proprietary reason. All instances are numeric. There is a huge number of missing values in the dataset. 8 attributes contain missing value more than 50%. There is only 2% instance that has no missing values. Some instances have up to 80% of their values missing. This dataset is classified as Missing Completely at Random (MCAR), as there is no relationship whether a data point is missing and any value in the dataset is missing or observed.
-
IV. Data Preprocessing
Data collection systems are not perfect and it is very common that the collected data may contain some missing, incorrect and noisy values because of the sensor malfunction. APS failure dataset contains all sensor data with a huge number of missing values. Thus the outcome of data mining algorithms can be significantly affected by such values. That is why data preprocessing plays an essential role in this case [25-27].
In the preprocessing phase, firstly we have replaced the class values “neg” with 0 and “pos” with 1. Then we have identified features that have more than 50% instances missing. We have found that, 8 features had half or more of their instances missing. We have omitted those features from the dataset. We have also found that the features which had more than 50% instances missing in the training set also had a similar percentage of data missing in the test dataset. This leaves us with 163 features. Thirdly, we have performed 5 different missing value imputation techniques on the dataset namely i) Multiple imputation by chained equation ii) Soft impute iii) Expectation maximization and iv) Mean imputation v) Singular Value Decomposition based Method (SVD Method). We have used two open source libraries named fancy impute [8] and impyute [9] for the data imputation. While imputing the missing values, we have used a random seed value of 3 for all the imputation techniques. To save time and maintain the efficiency, we have performed all our experiments in Google Colaboratory platform [11]. Details regarding the imputation techniques are given below.
-
A. Multiple Imputation by chained equation (MICE)
Multiple Imputation by chained equation has emerged as a principled method for dealing with missing data in large imputation procedure [7]. An important advantage of MICE for our dataset is that MICE can handle different types of variables (continuous, binary, categorical etc.) because each variable is imputed using its own imputation model [10]. In MICE a series of regression models are run on each variable where other features act as independent variables. To figure axis labels, use words rather than symbols. Do not label axes only with units. Do not label axes with a ratio of quantities and units. Figure labels should be legible, about 9-point type.
-
B. Soft Impute
Soft impute iteratively computes the soft thresholder SVD of a filled in matrix [12]. It works well and fast for datasets with high dimensionality. We have used the implementation proposed by Mazumder et al. [12] in our imputation. Authors fitted the technique on Netflix dataset with 480,189 x 17,770 dimension and 99% data missing. As our dataset also has high dimension, we have chosen to use it in this dataset. Soft impute can be defined by the following equation
Suppose the matrix W has rank r. The solution to the optimization problem is:
1 minimize -|| W - Z | £ +, || Z || * (1)
where
Z = S , (W )
S , ( W ) = UDV,
D^ = diag [( d - , ) + ,..., + ( dr -, )]
UDV = the SVD of W
D = diag [ d ,...., d ]
t = max( t , 0)
-
C. Expectation maximization
The Expectation Maximization algorithm [15] is an imputation method that predicts missing values. It is a two-step iterative procedure which is Expectation (E-step) and Maximization (M-step). E-step finds the distribution of missing value. And M-step substitutes the missing value. [14]. Tahani Aljuaid et al [24] found that Expectation maximization imputation works better on numeric dataset. As our dataset is all numeric, we have chosen this to test its impact on our dataset. It calculates the following equation for each case of i.
E ( yimiss | yiobj ; ^ , ^ )
And (2)
cov( yimiss | yiob/-
The values obtained from the E-step are used` to obtain new values of μ and ∑ . The M-step finds the parameter estimates to maximize the complete log-likelihood from the E-step. We chose EM imputation because it preserves the relation between attributes and also produces good results compared to other methods such as mean, Resemblance-based hot-deck imputation, iterated stochastic regression imputation [13, 14].
-
D. Imputation using Mean value
Mean imputation is a straightforward yet powerful method for handling dataset missing values. This method replaces all the missing values of an attribute with the mean value of that attribute. This technique works on the assumption that the missing values are missing completely at random (MCAR) which satisfies our dataset.
-
E. Singular value decomposition
SVD imputation is based on Eigen values. This method uses the singular value decomposition method to obtain a set of mutually orthogonal expression patterns that can be linearly combined to approximate the missing values in a dataset [16]. This pattern can be expressed as follows:
A ( m * n ) = U ( m * m ) ∑ ( m * n ) V ( n * n ) (3)
Matrix VT now contains the dataset whose contribution to the expression in the Eigen space is quantified by corresponding Eigen values on the diagonal of matrix ∑ .
-
V. Methodology
This dataset poses a classification problem which is to classify if the failure causes due to APS or not. As our dataset is highly imbalanced, accuracy is not the metric to consider. We compared performances of the classifiers based on reducing the number of false negatives. After preprocessing, we had 5 datasets imputed with the above stated imputation techniques. The main activities we performed in these study are - imputing the missing values using five different imputation techniques, classification on the imbalanced dataset, balancing the dataset, classification on the balanced dataset and finally evaluating and comparing the performances of the classifiers. All the experimental activities have been implemented in the Python programming environment. We have used the Python machine learning library named Scikit-learn [17] for all our implementation of the classification algorithms.
-
A. Classification
For classification purpose, we chose five different classifiers from different categories.
-
a. Naïve bayes:
Naive Bayes is a simple probabilistic classifier based on Bayes theorem. The reason behind choosing Naive
Bayes is that it works better when the dimension of input is high in a dataset. Naïve Bayes algorithm can be described by the following equation:
Ρ ( c | x ) = P ( x | c ) P ( c ) P ( x ) (4)
where
P(c|x) is the following probability of class.
P(c) is the prior probability of class.
P(x|c) is the likelihood which is the probability of predictor given class.
P(x) is the prior probability of predictor.
-
b. K-Nearest Neighbor (KNN):
KNN [18] is an instance based lazy learning algorithm which predicts by measuring the distance function between for pairs of observation. KNN algorithm is defined by:
Y ( x ) = 1 ∑ yi (5)
k xi ∈ Nk ( x )
Where N ( x )is the neighborhood of x defined by the K closest points x in the training sample. We tuned the K value to be 10 for the prediction.
-
c. Random Forest:
Random Forest [19] is a popular tree-based algorithm that randomly builds multiple decision trees and merges them together to create a more accurate tree.
-
d. Support vector machine:
SVM [20] is a discriminative classifier that works by separating data points by a hyperplane. In other words, it is a supervised classification algorithm that given a training data will produce an optimal hyperplane upon which test data will be categorized. The hyperplane function can be written as:
∫ ( x ) = h ( x ) Tβ + β 0 (6)
where α , β can be determined by solving ∫ ( x ) .
-
e. Gradient boosting tree (GBM):
The GBM [21] is an ensemble learning method, which constructs a predictive model by an additive expansion of sequentially fitted weak learners to minimize the loss function.
-
B. Balancing the dataset and further classification
We have used random under-sampling on all the imputed datasets to balance them. After balancing each dataset consisted of 2000 instances where each class had 1000 instances. After that, we used the previous classification again on the new datasets.
-
C. Description of the overall description
Here, Fig. 1 represents the methodology of our APS failure prediction. First, we processed our data using some imputation technique. It gave us a balanced data.
Then we applied different classifiers. Lastly, we evaluate the results based on accuracy, True Positive, True Negative, False Positive and False Negative.
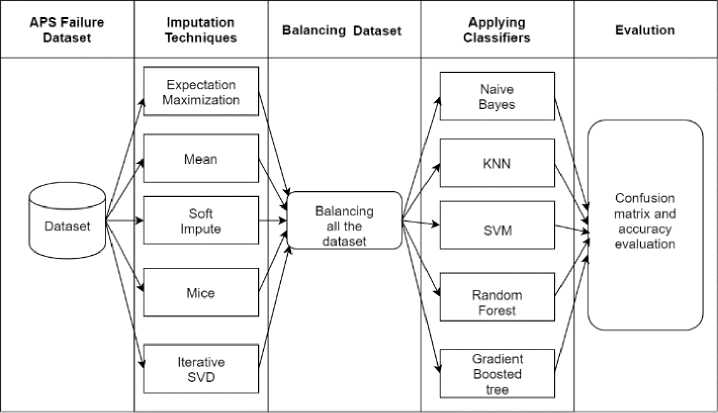
Fig.1. Overall workflow
D. Evaluation
We have used two evaluation metrics for evaluating the classification results namely the confusion matrix and the accuracy score. But we prioritized the confusion matrix, as we tried to reduce false negative (FN). Here the false negative means data that supposed to be classified as a failure caused by the APS system but identified for other reasons. The least false negative we get in Mean missing value imputation technique. Fig. 2 describes the mechanism of the confusion matrix.
-
1) True Positives (TP)- Model correctly predicts the positive class.
-
2) False Positives (FP) – Model incorrectly predicts the positive class.
-
3) True negatives (TN) – Model correctly predicts negative class.
-
4) False negatives (FN) – Model incorrectly predicts negative class.
Actual Dataset
Positives


TP
Positives
FN
Negatives
Negatives
FP False Positives
TN
Negatives
Fig.2. Confusion Matrix
-
VI. Result Analysis
The primary objective of this paper is to compare the impact of five different imputation techniques over five different classification algorithms. In the preprocessing and methodology section, we briefly discussed the five imputation techniques and classification algorithms.
Table 1 shows the result of 5 imputation techniques on the actual dataset before handling the imbalanced class problem. Results show that the Naive Bayes algorithm produced the least false negative values consistently for all the imputation techniques. For iterative SVD imputation, Naive Bayes algorithm correctly predicted 336 of the 375 APS failures in the test set with 96.3875% accuracy. KNN classifier performed worst across all the imputation techniques producing the most FN and least accuracy. For all the imputation techniques KNN classifier performed the worst.
Fig. 3 shows a comparative visualization between the false negative values of all classifiers for the actual dataset. It shows that except the Soft Impute technique, all other imputation techniques yield better results for the Naive Bayes classifier.
Table 2 shows the result after applying random undersampling. Results show that for all the imputation techniques random forest performed significantly better than other classifiers. For MICE imputation technique random forest algorithm correctly predicted 367 of the test sets with 94.79% accuracy. Although for soft impute, Naive Bayes classifier predicted 372 of the 375 negative classes correctly, it has only 33.375% accuracy. So it was not considered as a good model.
Table 1. Performance of Classifiers on Actual Dataset
|
Imputation Technique |
Classifier |
True Negative |
False Positive |
False Negative |
True Positive |
Accuracy |
|
Expectation Maximization |
Naive Bayes |
14962 |
663 |
40 |
335 |
95.61 |
|
KNN |
15596 |
29 |
247 |
128 |
98.275 |
|
|
SVM |
15612 |
13 |
297 |
78 |
98.06 |
|
|
Random Forest |
15609 |
16 |
143 |
232 |
99.006 |
|
|
Gradient Boosted Tree |
15542 |
83 |
109 |
266 |
98.8 |
|
|
Mean Imputation |
Naive Bayes |
15032 |
593 |
41 |
334 |
96.04 |
|
KNN |
15600 |
25 |
305 |
70 |
97.94 |
|
|
SVM |
15562 |
63 |
188 |
187 |
98.43 |
|
|
Random Forest |
15602 |
23 |
133 |
242 |
99.025 |
|
|
Gradient Boosted Tree |
15540 |
85 |
123 |
252 |
98.7 |
|
|
Soft Impute |
Naive Bayes |
15575 |
50 |
352 |
23 |
97.49 |
|
KNN |
15614 |
11 |
284 |
91 |
98.15 |
|
|
SVM |
15620 |
5 |
272 |
103 |
98.26 |
|
|
Random Forest |
15458 |
167 |
198 |
177 |
97.71 |
|
|
Gradient Boosted Tree |
15313 |
312 |
224 |
151 |
96.65 |
|
|
MICE |
Naive Bayes |
15169 |
456 |
41 |
334 |
96.89 |
|
KNN |
15597 |
28 |
272 |
103 |
98.13 |
|
|
SVM |
15585 |
40 |
129 |
246 |
98.94 |
|
|
Random Forest |
15609 |
16 |
144 |
231 |
99 |
|
|
Gradient Boosted Tree |
15513 |
112 |
127 |
248 |
98.51 |
|
|
Iterative SVD |
Naive Bayes |
15086 |
539 |
39 |
336 |
96.3875 |
|
KNN |
15567 |
58 |
270 |
105 |
97.95 |
|
|
SVM |
14404 |
1221 |
173 |
202 |
91.2875 |
|
|
Random Forest |
15597 |
28 |
139 |
236 |
98.95 |
|
|
Gradient Boosted Tree |
15499 |
126 |
130 |
245 |
98.4 |
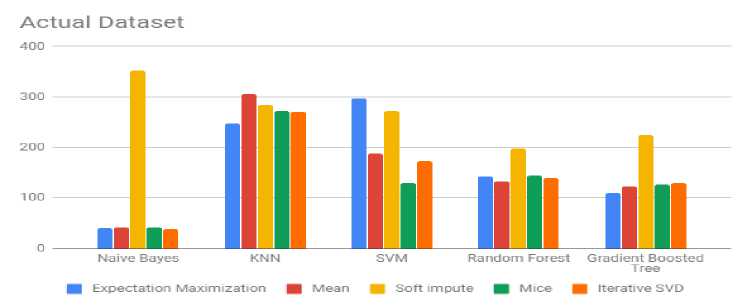
Fig.3. Comparison of False Negatives between the Classifiers for The Actual Dataset
Under Sampling Dataset
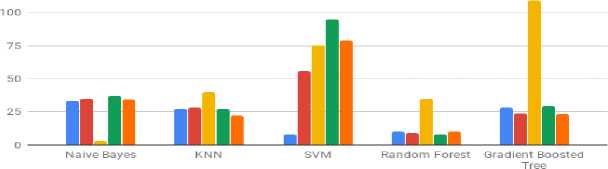
■ Expectation Maximization ■ Mean ■ Soft impute ■ Mice ■ Iterative SVD
Fig.4. Comparison of False Negatives between the Classifiers for Under-Sampled Dataset.
Table 2. Performance of Classifiers after Under-Sampling
|
Imputation Technique |
Classifier |
True Negative |
False Positive |
False Negative |
True Positive |
Accuracy |
|
Expectation Maximization |
Naive Bayes |
14600 |
1025 |
33 |
342 |
93.39 |
|
KNN |
14496 |
1129 |
27 |
348 |
92.77 |
|
|
SVM |
11810 |
3815 |
8 |
367 |
76.1 |
|
|
Random Forest |
14758 |
867 |
10 |
365 |
94.51 |
|
|
Gradient Boosted Tree |
14460 |
1165 |
28 |
347 |
92.54 |
|
|
Mean Imputation |
Naive Bayes |
15128 |
497 |
35 |
340 |
96.675 |
|
KNN |
14888 |
737 |
28 |
347 |
95.21 |
|
|
SVM |
12082 |
3543 |
56 |
319 |
77.5 |
|
|
Random Forest |
14854 |
771 |
9 |
366 |
95.125 |
|
|
Gradient Boosted Tree |
14555 |
1070 |
24 |
351 |
93.1625 |
|
|
Soft Impute |
Naive Bayes |
4968 |
10657 |
3 |
372 |
33.375 |
|
KNN |
15186 |
439 |
40 |
335 |
97 |
|
|
SVM |
15495 |
130 |
75 |
300 |
98.71 |
|
|
Random Forest |
15037 |
588 |
35 |
340 |
96.1 |
|
|
Gradient Boosted Tree |
13504 |
2121 |
109 |
266 |
86.06 |
|
|
MICE |
Naive Bayes |
15126 |
499 |
37 |
338 |
96.65 |
|
KNN |
14796 |
829 |
27 |
348 |
94.65 |
|
|
SVM |
10863 |
4762 |
95 |
280 |
69.64 |
|
|
Random Forest |
14799 |
826 |
8 |
367 |
94.79 |
|
|
Gradient Boosted Tree |
14769 |
856 |
29 |
352 |
94.5 |
|
|
Iterative SVD |
Naive Bayes |
14866 |
759 |
34 |
341 |
95.04375 |
|
KNN |
14796 |
829 |
22 |
353 |
94.68125 |
|
|
SVM |
13952 |
1673 |
79 |
296 |
89.05 |
|
|
Random Forest |
14874 |
751 |
10 |
365 |
95.24375 |
|
|
Gradient Boosted Tree |
14159 |
1466 |
23 |
352 |
90.69375 |
Fig. 4 shows a comparative visualization between the false negative values of all classifiers for the balanced (under-sampled) dataset. It shows that balancing the dataset resulted in a significant performance increase on the classifiers. All the imputation techniques with the Random Forest classifier yield consistently better results for the balanced dataset.
Finally, for both the actual dataset and balanced dataset the Soft impute gave the worst results consistently, whereas the MICE imputation technique shows the highest impact for producing the best results.
-
VII. Conclusion
Proper classification of failure in Scania trucks is very important for the vehicle industry as those heavy trucks are used on a daily basis. So they need to be well maintained and if we can properly predict whether the reason of failure is for the APS system, it can reduce the maintenance cost by isolating failed components.
However, accomplishing this task was challenging as the dataset contained a huge number of missing values and was highly imbalanced with only 2% positive class and 98% negative class. We analyzed the impact of different imputation techniques on this dataset and performed an empirical comparative analysis to find the best technique. Five modern imputation techniques namely: Random Imputation, Expectation Maximization, MEAN, Soft Impute and MICE imputation were applied to impute the missing values. We analyzed the classification performance of five classification algorithms namely: Naive Bayes, KNN, SVM, Random Forest, and Gradient Boosted Tree on the imputed dataset. We found that MEAN impute technique worked best for handling missing values. We also found that for the actual dataset Naive Bayes produced the least false negative (=39) and Random Forest produced highest 99.025% accuracy. After balancing the dataset Random Forest produced the least number of false negatives (=3) and the Soft impute with SVM produced the highest accuracy of 98%. These findings imply that imputing and balancing the dataset resulted in a significant performance increase on the classifiers. However, overall the least impactful imputation technique was soft impute. In the IDA 2016 competition, the winner scored 9920 points with 542 false positives and 9 false negatives [1]. The runner-up scored 10900 points with 490 false positives and 12 false negatives. And the second runner-up scored 11480 points with 398 false positives and 15 false negatives. Our best score was 12210 with 826 false positives and 8 false negatives using the MICE imputation along with Random Forest Classifier. Our false negative score is better than the top contender from the competition. In our future work, we will focus on different feature selection techniques and also apply deep learning techniques to classify the APS failure for more accurate results.
References An empirical comparison of missing value imputation techniques on APS failure prediction
- Costa, Camila Ferreira, and Mario A. Nascimento. "Ida 2016 industrial challenge: Using machine learning for predicting failures." International Symposium on Intelligent Data Analysis. Springer, Cham, 2016.
- Cerqueira, Vítor, et al. "Combining Boosted Trees with Metafeature Engineering for Predictive Maintenance." International Symposium on Intelligent Data Analysis. Springer, Cham, 2016.
- Gondek, Christopher, Daniel Hafner, and Oliver R. Sampson. "Prediction of failures in the air pressure system of scania trucks using a random forest and feature engineering." International Symposium on Intelligent Data Analysis. Springer, Cham, 2016.
- Ozan, Ezgi Can, et al. "An Optimized k-NN Approach for Classification on Imbalanced Datasets with Missing Data." International Symposium on Intelligent Data Analysis. Springer, Cham, 2016.
- IDA 16: http://ida2016.blogs.dsv.su.se/, Last visit: 5/11/18
- Air Brakes: https://www.britannica.com/technology/air-brake, Last visit: 5/12/18
- Azur, Melissa J., et al. "Multiple imputation by chained equations: what is it and how does it work?." International journal of methods in psychiatric research 20.1 (2011): 40-49.
- Open source Fancy impute library for scikit learn by ishkndar: https://github.com/iskandr/fancyimpute, Last Visit: 6/23/18
- Open source Impyute library for scikit learn by eltonlow- https://github.com/eltonlaw/impyute, Last Visit: 6/24/18
- White, Ian R., Patrick Royston, and Angela M. Wood. "Multiple imputation using chained equations: issues and guidance for practice." Statistics in medicine 30.4 (2011): 377-399.
- GoogleColaboratory: https://colab.research.google.com/, Last Visit: 8/25/18
- Mazumder, Rahul, Trevor Hastie, and Robert Tibshirani. "Spectral regularization algorithms for learning large incomplete matrices." Journal of machine learning research 11.Aug (2010): 2287-2322.
- Gold, Michael Steven, and Peter M. Bentler. "Treatments of missing data: A Monte Carlo comparison of RBHDI, iterative stochastic regression imputation, and expectation-maximization." Structural Equation Modeling 7.3 (2000): 319-355.
- Grace-Martin, K. "EM imputation and missing data: Is men imputation really so terrible?[Web log post]." (2009).
- Do, Chuong B., and Serafim Batzoglou. "What is the expectation maximization algorithm?." Nature biotechnology 26.8 (2008): 897.
- Troyanskaya, Olga, et al. "Missing value estimation methods for DNA microarrays." Bioinformatics 17.6 (2001): 520-525.
- Pedregosa, Fabian, et al. "Scikit-learn: Machine learning in Python." Journal of machine learning research 12.Oct (2011): 2825-2830.
- Hastie, Tibshirani, and R. Tibshirani. "& Friedman, J.(2008). The Elements of Statistical Learning; Data Mining, Inference and Prediction."
- Breiman, Leo. "Random forests." Machine learning 45.1 (2001): 5-32.
- Zhang, Tong. "An introduction to support vector machines and other kernel-based learning methods." AI Magazine 22.2 (2001): 103.
- Chen, Yifei, et al. "A gradient boosting algorithm for survival analysis via direct optimization of concordance index." Computational and mathematical methods in medicine 2013 (2013). https://archive.ics.uci.edu/ml/datasets/APS+Failure+at+Scania+Trucks Last visit: 5/20/18
- Biteus, Jonas, and Tony Lindgren. "Planning Flexible Maintenance for Heavy Trucks using Machine Learning Models, Constraint Programming, and Route Optimization." SAE International Journal of Materials and Manufacturing 10.2017-01-0237 (2017): 306-315.
- Chawla, Nitesh V., et al. "SMOTE: synthetic minority over-sampling technique." Journal of artificial intelligence research 16 (2002): 321-357.
- Aljuaid, Tahani, and Sreela Sasi. "Proper imputation techniques for missing values in data sets." Data Science and Engineering (ICDSE), 2016 International Conference on. IEEE, 2016.
- M. G. Rahman, M. Z. Islam, Missing value imputation using decision trees and decision forests by splitting and merging records: Two novel techniques, Knowledge-Based Systems 53 (2013) 51–65.
- X. Zhu, S. Zhang, Z. Jin, Z. Zhang, Z. Xu, Missing value estimation for mixed-attribute data sets, IEEE Transactions on Knowledge and Data Engineering 23 (1) (2011) 110-121
- A. Farhangfar, L. Kurgan, J. Dy, Impact of imputation of missing values on classification error for discrete data, Pattern Recognition 41 (12) (2008) 745 3692–3705.
- A. Farhangfar, L. A. Kurgan, W. Pedrycz, A novel framework for imputation of missing values in databases, IEEE Transactions on Systems, Man, and Cybernetics-Part A: Systems and Humans 37 (5) (2007) 692–709.
- Morshedizadeh, Majid, et al. "Application of imputation techniques and Adaptive Neuro-Fuzzy Inference System to predict wind turbine power production." Energy 138 (2017): 394-404.
- Sallam, Elsayed, et al. "Handling numerical missing values via rough sets." International Journal of Mathematical Sciences and Computing (IJMSC) 3.2 (2017): 22-36.
- Fahri, Muhammad U., and Sani M. Isa. "Data Mining to Prediction Student Achievement based on Motivation, Learning and Emotional Intelligence in MAN 1 Ketapang." (2018).
- Hu, Zhengbing, et al. "Fuzzy clustering data arrays with omitted observations." International Journal of Intelligent Systems and Applications 9.6 (2017): 24.
