An Expert GIS-Based ANP-OWA Decision Making Framework for Tourism Development Site Selection

Author: Khalid A. Eldrandaly, Mohammed A. AL-Amari
Journal: International Journal of Intelligent Systems and Applications(IJISA) @ijisa
Article in issue: 7 vol.6, 2014.
Free access
The selection of a tourism development site involves a complex array of decision criteria that may have interdependence relationships within and between them. In the process of finding the optimum location that meet desired conditions, the analyst is challenged by the tedious manipulation of spatial data and the management of multiple decision-making criteria. This paper presents a novel decision making framework in which expert systems (ES), and geographic information systems–based multicriteria evaluation techniques (Analytical Network Process and fuzzy quantifiers-guided ordered weighted averaging operators (GIS-based ANP-OWA)) are integrated systematically to facilitate the selection of suitable sites for building new tourism facilities. First, ES is used for recommending the proper site selection criteria and their interdependence relationships. Then, the GIS-based ANP-OWA is used to perform the spatial data analysis necessary to generate a wide range of possible candidate sites’ scenarios taking into accounts both the interdependence relationships between sitting criteria and the level of risk the decision-makers wish to assume in their multicriteria evaluation. A typical case study is presented to demonstrate the application of the proposed decision making framework.
Tourism Development Site Selection, GIS, Expert Systems, ANP-OWA, COM
Short address: https://sciup.org/15010576
IDR: 15010576
Text of the scientific article An Expert GIS-Based ANP-OWA Decision Making Framework for Tourism Development Site Selection
Published Online June 2014 in MECS
Today, Tourism is considered one of the world's largest industries that supporting more than 258 million jobs worldwide and generating some 9.1% of global Gross Domestic Product (GDP) [1]. Evaluating and selecting a suitable tourism development site has become one of the most critical issues for the tourism industry. Location decision has drawn increasing attention from academic and business communities in the past two decades. It has been well recognized that selection of a facility location has important strategic implications because a location decision will normally involve a longterm commitment of resources [2].
Sitting problems are multi-facetted challenges. Not only they often involve numerous technical requirements, but may also contain economical, social, environmental and political dimensions that may have conflicting values.
Solutions for these problems involve highly complex spatial data analysis processes and frequently require advanced means to address physical suitability conditions while considering the multiple socio-economic variables. Geographic information systems (GIS), multicriteria evaluation (MCE) techniques, and Expert Systems (ES) are the most common tools employed to solve site selection problems. However, each suffers from serious shortcomings. GIS is a great tool for handling physical suitability analysis. However, it has limited capabilities of incorporating the decision maker’s preferences into the problem solving process. MCE is the proper tool for analyzing decision problems and evaluating alternatives based on a decision maker’s values and preferences. However, it lacks the capability of handling spatial data (e.g., buffering and overlay) that are crucial to spatial analysis. Also ES, which is capable of addressing heuristic analysis, lacks the capability of handling spatial data/knowledge. Thorough discussion of these techniques and their limitations can be found elsewhere [3]. The need for combining the strengths of these techniques has prompted researchers to seek integration of GIS, MCE and ES. Successful integration is dependent on creating a flexible and scalable framework that can provide both complex analysis tools for advanced users and disseminate information to a wide audience in a clearly understood format. The recent advances in software engineering, such as component object model (COM) technology, are now being utilized to achieve the required scalable framework and software interoperability. There is now a well-established body of literature on integrating ES, GIS and MCE techniques for solving several site selection problems (see for example: [4 – 11]). However, despite the importance of tourism development site selection decisions, there is little published research on this topic. Most of the published research on this specific topic either used the Analytical Hierarchy Process (AHP) or GIS-based AHP for choosing suitable sites for a specific tourism facility (see for example: [2, 12 – 15]). In addition, these papers did not consider the influences and interactions among the elements of the system (criteria and alternatives) as perceived by the decision maker due to the fact that AHP cannot accommodate the variety of interactions, dependencies and feedback between higher and lower level elements [16]. Also, the GIS-based AHP, an adoption of weighted linear aggregation (WLC) rule, typically employed a high tradeoff decision strategy and neglected other decision strategies [17].
This paper presents a novel decision making framework in which ES, and GIS-based ANP-OWA, a recently developed GIS-based multicriteria evaluation procedure [18], are integrated systematically to facilitate decision-making regarding site selections for tourism facilities. According to the type of the proposed tourism facility, an expert system is used to define the recommended sitting criteria (market-related, environmental, legal/political, financial etc.) and the interdependence relationships within and between them. Then, the GIS-based ANP-OWA is used to perform the spatial data analysis necessary to generate a wide range of possible candidate sites’ scenarios taking into accounts both the interdependence relationships between sitting criteria and the level of risk the decision-makers wish to assume in their multicriteria evaluation. The rest of this paper is organized as follows: Section 2 presents a comprehensive discussion of tourism site selection process, and characteristics. Section 3 describes the proposed decision making framework. Section 4 describes the proposed spatial decision support system. A typical case study is presented in Section 5 to demonstrate the application of the proposed decision making framework.
-
II. T ourism S ite S election
-
2.1. Tourism Site Selection Characteristics
-
-
2.2. Tourism Site Selection Criteria
Building a new capital improvement facility is a major, long-term investment for owners and investors. Site selection of a capital project is a critical decision made by owners/investors that significantly affects their profit and loss. Decisions regarding the locations of these facilities influence where people work, live, and determine the lifestyle of a community. As such, tourism site location analysis is big business, whether measured in terms of amounts invested, decision-makers involved, employees affected, or the economies of the area influenced. The process of selection could involve a large number of candidate sites [3].
The goal in a site selection exercise is to find the best location with desired conditions that satisfy predetermined selection criteria [19]. The selection process attempts to optimize a number of objectives in determining the suitability of a particular site for a defined facility. Such optimization often involves a multitude of factors, sometimes contradicting. Some of the important factors that add to the difficulty of the proper site selection include the existence of numerous possible sites within a sought region, multiple objectives, intangible objectives, diversity of interest groups, lack of quantitative measures of the factors’ impact, uncertainties regarding impact timing and magnitude, uncertainties regarding government influence on the selection process through legislations, uncertainties regarding possible delays of permitting and construction [20].
The process for selecting tourism sites is especially complicated because there are two distinctive characteristics of tourism that add to a decision's complexity [13]: First, tourism activities frequently involve interaction with areas that are environmentally, socially, and /or culturally sensitive such as beaches, mountains, or habitats of indigenous people. The balancing of multiple objectives, e.g., maximizing a destination's popularity/attractiveness while at the same time maintaining the quality of its environment, is a formidable challenge in tourism site selection decisions. Second, in many contexts tourism is a seasonal activity because the quality of attractions, which draws people to a specific area, often varies across the year. Consequently, the popularity of areas fluctuates from season to season. This seasonality is one of the most pervasive problems in tourism leading to a highly skewed visitor distribution pattern which has substantial effects not only on a destination's profitability but also on its environment. Therefore, an inappropriate location decision may have a destructive effect not only on the success of a tourism business, but also on the host environment and community.
The key to success in site selection is to determine which criteria are most important. Given the multifaceted nature of tourism and the complex nature of tourism demand, many different criteria have been identified that may influence tourism site selection. The importance of each of these criteria varies among situations depending on the type of tourism developed, the context and stage of development, and the perspective adopted. These criteria can be divided into four broad categories as shown in table 1. Thorough discussion of these criteria can be found elsewhere [13].
Table 1. Tourism site selection criteria (adapted from [13])
|
Categories |
Criteria |
|
Market-related Criteria |
Accessibility |
|
Cultural Attractions |
|
|
View |
|
|
Climate |
|
|
Supporting Facilities |
|
|
Recreation Opportunities |
|
|
Competition |
|
|
Distance from Sight Line |
|
|
Environmental Criteria |
Topography (Slope) |
|
Ecosystem (Wildlife/Vegetation) |
|
|
Underground Water |
|
|
Landscape (Visual Quality) |
|
|
Legal/Political Criteria |
Land Use |
|
Surrounding Land Use |
|
|
Zoning |
|
|
Residents’ Attitude |
|
|
Financial Criteria |
Land Price |
|
Existing Infrastructure |
|
|
Land Ownership |
|
|
Incentives |
-
III. P roposed D ecision M aking F ramework
-
3.1. Phase 1: Defining Sitting Criteria
-
3.2. Phase 2: Preparing Standardized Criterion Maps
-
3.3. Phase 3: Multicriteria Evaluation
After preparing the standardized criterion maps, GIS-based ANP-OWA, a recently developed GIS-based MCE procedure, is used for ranking the alternative sites according to the decision maker’s preferences. ANP and OWA are two of the most commonly used GIS-based MCE procedures [26, 27]. The ANP generalizes the problem of modeling process using a network of criteria and alternatives (all called elements), grouped into clusters. All the elements in the network can be related in any possible way, i.e. a network can incorporate feedback and interdependence relationships within and between clusters. The ANP method allows the aggregation of the experts’ judgments on each of these elements into one priority index [28]. However, ANP similar to AHP typically employed a high trade-off decision strategy, which used a weighted linear aggregation rule (WLC), and neglected other decision strategies [29]. OWA is a family of multi-criteria aggregation procedures. It has been developed in the context of fuzzy set theory. It involves two sets of weights: the weights of criterion importance and the order weights. By changing the order weights, one can generate a wide range of outcome. OWA provides an extension and generalization for the two fundamental classes of decision rules in the GIS: the Boolean overlay operations and the WLC procedures [26]. Both ANP and OWA with fuzzy quantifiers have been implemented individually in GIS environments (e.g. [26 – 33]). While each of these MCE procedures has proven to be very useful, however, they do not operate in the same level. The ANP is a global tool for analyzing the whole decision-making process, creating a network model of it and then evaluating each alternative with respect to this network. The evaluation process in the ANP uses a simple WLC to calculate the local scores of each alternative as a cell (raster format) or a polygon (vector format). The OWA operators, on the other hand, provide a very general framework for making the kinds of local aggregations used in the ANP. In 2013,Eldrandaly [18] introduced a new GIS-based multi-criteria evaluation procedure by extending the ANP using fuzzy quantifiers-guided ordered weighted averaging (OWA) operators, suggesting that the capabilities of ANP as a comprehensive tool for decision making can be improved by integration of the fuzzy linguistic OWA operators. This procedure allows decision-makers to define a decision strategy on a continuum between pessimistic (risk-averse) and optimistic (risk-taking) strategies. By changing the linguistic quantifiers, the GIS-based ANP– OWA can generate a wide range of decision strategies taking into accounts the level of risk the decision-makers wish to assume in their MCE. The GIS-based ANP-OWA procedure is composed of five major steps [18]: (1) Network model construction, (2) Pairwise comparison
A novel decision making framework for tourism development site selection is proposed. The proposed framework integrates the capabilities of ES, and GIS-based ANP-OWA. Recommendations regarding the design of a good sitting methodology were observed [21, 22] in the design of the proposed framework. These recommendations include: a) identification of facility’s goals, b) providing quality analysis (i.e., logically sound, defensible, and useful for decision-making) c) offering practical methodology (i.e., ability to conduct studies in the real environment with available methods and procedures provided at a reasonable cost and time), and d) documenting how local conditions are analyzed. Fig. 1 depicts the three phases of the proposed framework (i.e., defining sitting criteria, preparing standardized criterion maps, multicriteria evaluation) and their procedural steps as explained below:
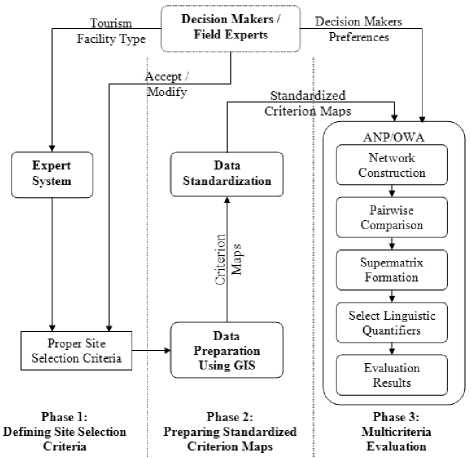
Fig. 1. Proposed Decision Making Framework
According to the type of the proposed tourism facility, an expert system is used to define the recommended sitting criteria (market-related, environmental, legal/political, and financial etc.) and their interdependence relationships. The decision maker has the option of accepting or modifying these recommended criteria.
After defining the sitting criteria, the analyst prepares the criterion maps based on the predefined sitting criteria. Central to spatial multicriteria decision making is the fact that an attribute can be represented in a GIS database as an attribute (criterion) map layer. A criterion map represents the spatial distribution of an attribute that measures the degree to which its associated objective is achieved. Given a variety of scales on which each criterion can be measured, multicriteria evaluation requires that values contained in the various criterion map layers be transformed to comparable units (standardized to a common scale). Detailed descriptions of standardization approaches are reported elsewhere [23 – 25].
and priority vectors, (3) Supermatrix formation, (4) Select linguistic quantifiers, and (5) Calculation of the overall evaluation score of alternatives. Detailed descriptions of this procedure are reported elsewhere [18].
-
IV. P roposed S patial D ecision S upport S ystem
To implement the proposed spatial decision making framework, a prototype intelligent GIS-based spatial decision support system (Tourism Site Selection Advisory System) is developed using Microsoft® Component Object Model (COM) technology. The COM is a standard that enhances software interoperability by allowing different software components, possibly written in different programming languages, to communicate directly [34]. A number of COM-compliant software packages are used to develop the proposed system.
The Visual Rule Studio® (an object-oriented expert systems development environment for windows) is used for developing the expert system component as an ActiveX DLL to achieve the required software interoperability. Visual Rule Studio solves the problem of software interoperability by allowing the developers to package rules into component reusable objects called RuleSets. By fully utilizing OLE and COM technologies, RuleSets act as COM Automation Servers, exposing RuleSet objects in a natural COM fashion to any COM compatible client. Visual Rule Studio installs as an integral part of MS Visual Basic, Professional or Enterprise Editions, and appears within the Visual Basic as an ActiveX Designer. This allows the developers to add rule objects to their existing or new Visual Basic application in much the same manner they would extend their application with a new form or ActiveX control. RuleSets can be complied within Visual Basic. EXE, .OCX, or .DLL executables and used in any of the ways the developers normally use such executables. The RuleSet of the proposed system consists of 5 Classes and 198 Rules. The knowledge base for the expert system were acquired from various information sources including published studies and texts; technical reports; municipal ordinance and documents; and human expertise from selected professionals who have considerable experience in planning practices related to tourism facility sitting decisions. The inference engine of Visual Rule Studio’s production system acts as the unseen hand or executor which causes processing to take place. In the proposed expert system forward chaining engine is used. Starting from an initial or current set of data, the forward chaining inference engine makes a chain of inferences until a goal is reached [35, 36].
The ArcGIS ® Desktop 9.3 is used to manage the spatial data and to conduct the required spatial analysis operations. ArcGIS is a scalable set of state-of-the-art software for geographic data creation, management, integration, analysis, and presentation. It is built on a technology framework known as ArcObjects. ArcObjects is a set of platform-independent software components, written in C++, which provides services to support geographic information system (GIS) applications on the desktop in the form of thick and thin clients and on the server. ArcObjects makes use of the Microsoft Component Object Model (COM). Detailed descriptions of ArcGIS are reported elsewhere [38, 38]. Visual Studio 2005 (C# Programming Language) and ArcObjects
(ArcGIS development platform) libraries are used to develop the ANP-OWA module as an extension to ArcGIS. Extensions are a collection of toolbars and commands. Detailed descriptions of ArcGIS programming can be found elsewhere [39].
-
V. C ase S tudy : T ourist H otel S ite S election
This section presents the results of implementing the proposed system on a test regional area. The test problem utilized a real regional site (the north west of Asir Region, Saudi Arabia). This site is characterized by its mountainous nature with heights reaching 2700m above sea level. Mountains chain extends in a north-south direction with very steep slope and cliffs in the west, and generally gentle slope to the east with some high mountains. Vegetation is covering many parts of the place with dense patches of forest in various locations. The goal of the test problem is to identify the most suitable sites for a tourist hotel. The required GIS data layers (criterion maps) were extracted from a QuickBird satellite image and a 30m ASTER Global Digital Elevation Model. This study focused on employing a relatively small number of well-defined principles rather than taking into account extensive cases in obtaining and organizing the decision criteria, the map layers, and the experts’ rules. However, since the system was designed as a scalable prototype, it can easily be adapted to any specific situation or needs with minor modifications and refinements.
-
5.1. Defining the sitting criteria
In order to identify the most suitable sites for a tourist hotel, the current case study involves evaluating a set of sites on the basis of four objectives: market related, environmental, legal, and financial. These objectives are measured in terms of eleven attributes: (1) Accessibility, (2) Cultural Attractions, (3) View, (4) Distance from Sight Line, (5) Slope, (6) Ecosystem, (7) Landscape, (8) Land Use, (9) Surrounding Land Use, (10) Land Price, and (11) Existing Infrastructure. There are dependencies between market related, environmental, legal, and financial objectives, and between attributes belonging to these objectives. The overall goal here is to identify the most suitable sites for building a new hotel.
To solve this sitting problem, the three procedural steps of the proposed framework will be followed. The proposed system is executed by clicking on the Tourism Site Selection Advisory System button on ArcMap. Upon execution of the System, it gives the user three options: (1) Selection Criteria Advisory System, (2) Data Standardization, and (3) Multicriteria Evaluation (ANP-OWA) as shown in Fig. 2.

Fig. 2. Tourism Site Selection Advisory System.
Upon starting the Selection Criteria Advisory System, the expert system asks the user to define the proposed tourism facility type. Then the expert system presents the recommended sitting criteria for the tourism facility under considerations (hotel). The decision maker has the option of either accepting or modifying these recommended criteria as shown in Fig. 3.
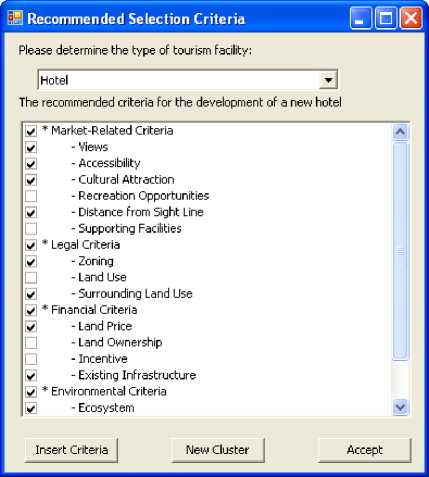
Fig. 3. Selection Criteria Advisory System
-
5.2. Data Standardization
-
5.3. Multicriteria Evaluation
-
5.3.1. Network Model Construction
-
After defining the sitting criteria, their corresponding criterion maps are created using raster format and each raster layer contains the attribute values assigned to the alternatives, and each alternative (cell) is related to the higher-level elements (i.e., attributes). Given a variety of scales on which each criterion can be measured, multicriteria evaluation requires that values contained in the various criterion map layers be standardized to a common scale. Thus before start building the ANP-OWA decision network of the current case study using the proposed system, the criterion maps must be standardized using the data standardization function available in the System as shown in Fig. 4.
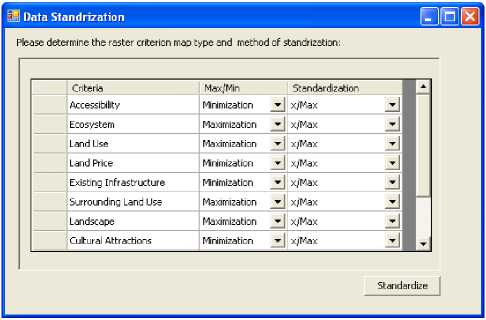
Fig. 4. Data Standardization
The first step in the ANP-OWA process is to construct a network model that captures the alternatives, the criteria and their relationships. In the context of this paper, a typical ANP network model for tourist hotel site selection is constructed as shown in Fig. 5. The developed model consists of a single control criterion (goal: hotel site selection), 4 criteria clusters (market related criteria, environmental criteria, legal criteria, and financial criteria), nodes (11subcriteria or attributes related to the 4 criteria clusters), and alternatives. There are, in the model dependencies between the four criteria clusters, and between subcriteria belonging to these criteria clusters. Outer dependencies between two clusters are represented by a two-way arrow while inner dependences among elements of a cluster are represented by looped arcs. To construct this model using the proposed system, the ANP-OWA procedure is activated by pressing the Multicriteria Evaluation (ANP-OWA) button. Then the suggested ANP Network model and the suggested dependency relationships are displayed, the decision maker has the option of either accepting or modifying them as shown in Fig. 6 and 7.
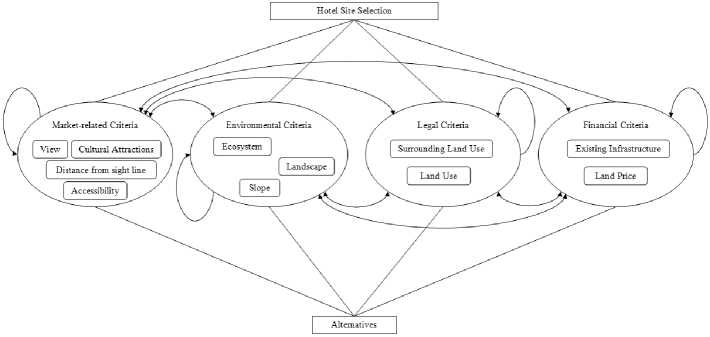
Fig. 5. Hotel Site Selection Network Decision Model
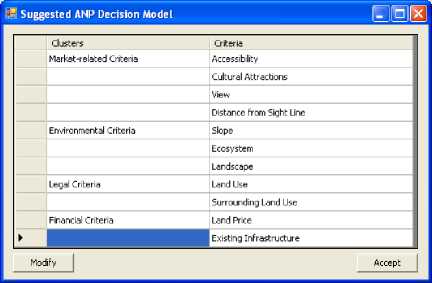
Fig. 6. Suggested ANP decision model
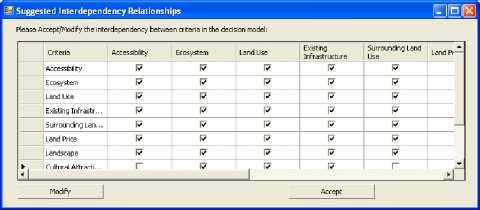
Fig. 7. Suggested dependency relationships
-
5.3.2. Pairwise comparison matrices and priority vectors In ANP, similar to the comparisons performed in AHP, attributes (nodes) are pairwise compared with respect to their relative importance toward their control attribute according to interdependency between attributes (outer/inner) relationships. The attributes within the objectives (clusters) themselves are pairwise compared according to their influence on each attribute in another objective they are connected to (outer dependence) or attributes in their own objective (inner dependence). Influence may be evaluated in terms of importance, preference or likelihood taking a control attribute in mind. The objectives themselves are also pairwise compared with respect to their contribution to the goal (control criterion). Thus, there are two sets of weights, W k ( j ) = ( W 1( j ), w 2( j ) ,-, wl ( j y) and W q = ( w 1 , w 2 ,-, w p ) ,
are assigned to the attributes and objectives, respectively. The final weights of the attributes W j = ( W 1 , w 2 ,..., w n ) are calculated using supermatrix operation as will be shown in section 5.3.3.
The relative importance values are determined with Saaty’s 1-9 scale. Similar to AHP, pairwise comparison in ANP is performed in the framework of a matrix, and a local priority vector can be derived as an estimate of the relative importance with attributes (or objectives) being compared. The pairwise comparison matrix has the following form: A = { ay } , where ay is the pairwise comparison rating for element i and element j . The matrix A is reciprocal - that is, a у = 1/ a^ - and all its diagonal elements are unity.
Local priority vector can be derived by solving (1):
A x W = A nax x W (1)
Where A is the matrix of pairwise comparisons, w is the eigenvector, and A max is the largest eigenvalue. A Consistency Index CI is used to measure the degree of inconsistency in the square matrix A
(where, CI = ( A max — n )/( n — 1) , n is the number of columns of matrix A ). Then the Consistency Ratio CR is calculated (where, CR = CI / RCI , RCI is the consistency index of a randomly generated pairwise comparison matrix). Generally, a CR of 0.10 or less is considered acceptable, otherwise the matrix A will be revised to improve the judgmental consistency [40, 41].
After constructing the decision model of the problem, the relative weights for all criteria clusters and their related subcriteria are calculated using the pairwise comparisons. First, we perform the pairwise comparison between the four criteria clusters as shown in Table 2 and Fig. 8. The system will warm the decision maker when the Consistency Ratio (CR) is not acceptable.
Table 2. Pairwise comparison matrix of the level of objective (clusters)
|
Market-related Factors |
Environmental Factors |
Legal Factors |
Financial Factors |
Weight |
CR |
|
|
Market-related Factors |
1 |
2 |
2 |
3 |
0.429 |
0.005 |
|
Environmental Factors |
0.5 |
1 |
1 |
2 |
0.222 |
|
|
Legal Factors |
0.5 |
1 |
1 |
2 |
0.222 |
|
|
Financial Factors |
0.333 |
0.5 |
0.5 |
1 |
0.127 |
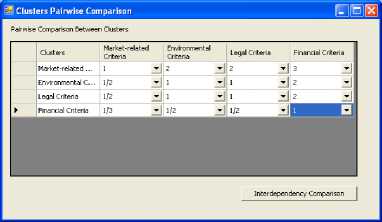
Fig. 8. Pairwise comparison between clusters
After finishing the Pairwise comparison process between the criteria clusters, we begin performing pairwise comparison between the subcriteria taking into account their interdependence relationships. For example, Fig. 9 demonstrating the connections between land price criterion and other subcriteria. Pairwise comparison procedures based on these connections are shown in table 3 and Fig. 10, 11, 12, and 13. Similarly, other subcriteria are also evaluated with 40 pairwise comparison procedures.
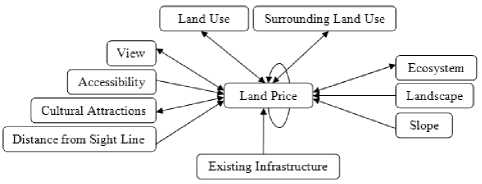
Fig. 9. Network Structure Regarding Land Price Criterion
Table 3. Pairwise Comparison Matrices Based on Land Price Factor
|
Accessibility |
Cultural Attractions |
View |
Sight Line |
Weight |
CR |
|||
|
Accessibility |
1 |
3 |
2 |
2 |
0.429 |
0.005 |
||
|
Cultural Attractions |
1/3 |
1 |
1/2 |
1/2 |
0.127 |
|||
|
View |
1/2 |
2 |
1 |
1 |
0.222 |
|||
|
Sight Line |
1/2 |
2 |
1 |
1 |
0.222 |
|||
|
Slope |
Ecosystem |
Landscape |
Weight |
CR |
||||
|
Slope |
1 |
3 |
2 |
0.545 |
0.009 |
|||
|
Ecosystem |
1/3 |
1 |
1/2 |
0.168 |
||||
|
Landscape |
1/2 |
2 |
1 |
0.287 |
||||
|
Land Use |
Surrounding Land Use |
Weight |
CR |
|||||
|
Land Use |
1 |
1/2 |
0.333 |
Two Criteria! |
||||
|
Surrounding Land Use |
2 |
1 |
0.667 |
|||||
|
Land Price |
Existing Infrastructure |
Weight |
CR |
|||||
|
Land Price |
1 |
1/2 |
0.333 |
Two Criteria! |
||||
|
Existing Infrastructure |
2 |
1 |
0.667 |
|||||
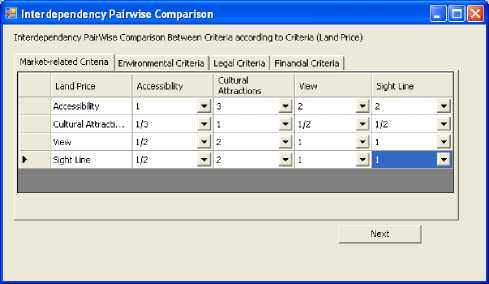
Fig. 10. Pairwise comparison between Market-related Criteria according to (Land Price)
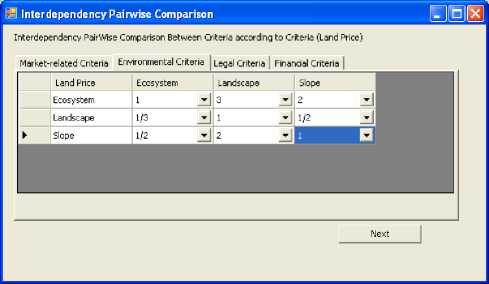
Fig. 11. Pairwise comparison between Environmental Criteria according to (Land Price)
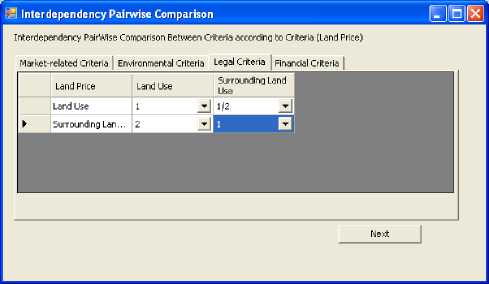
Fig. 12. Pairwise comparison between Legal Criteria according to (Land Price)
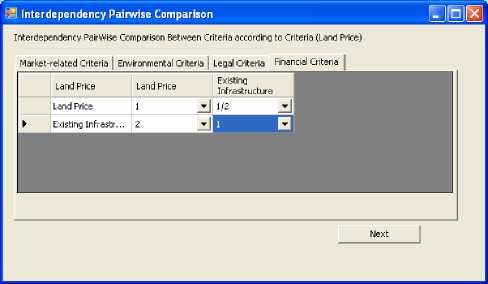
Fig. 13. Pairwise comparison between Financial Criteria according to (Land Price)
-
5.3.3. Supermatrix formation
The supermatrix concept is similar to the Markov chain process [16]. To obtain global weights in a system with interdependent influence, the attributes local priority vectors obtained in section 5.3.2 are grouped and placed in the appropriate positions in a supermatrix based on the flow of influence from one objective cluster to another, or from an objective cluster to itself, as in the loop [42].
During this phase the following three supermatrices are obtained:
-
• Initial Supermatrix contains all the eigenvectors that are derived from the pairwise comparison matrices of the model (Table 4).
-
• Weighted Supermatrix obtained by multiplying the initial supermatrix values by the cluster weight matrix (Table 5)
-
• Limit Supermatrix obtained by raising the weighted supermatrix to the power of an arbitrarily large number (Table 6).
The limit supermatrix has the same form as the weighted supermatrix, but all the columns of the limit supermatrix are the same. The final weights W j = ( W 1 , w 2 ,..., w n ) of all elements in the matrix can be obtained by normalizing each cluster of this supermatrix. Limit supermatrix exhibits the weights of criteria as shown in Table 7. Fig. 14 shows the final weights of both the clusters and their related criteria. The user has the choice to view the creation of different supermatrices by choosing show solution steps button.
Table 7. Calculated weights for the criteria
|
Criteria |
Weights |
|
Accessibility |
0.173 |
|
Cultural Attractions |
0.015 |
|
View |
0.158 |
|
Distance from Sight Line |
0.082 |
|
Slope |
0.107 |
|
Ecosystem |
0.050 |
|
Landscape |
0.065 |
|
Land Use |
0.116 |
|
Surrounding Land Use |
0.106 |
|
Land Price |
0.039 |
|
Existing Infrastructure |
0.088 |
Table 4. Initial Supermatrix
|
.S' < |
^ Я S g |
u > |
2 v 8 'ад .23 ад Q |
d О ад |
2 Щ |
5 |
ад я ^ g 8 ад |
•3 g M 1 |
|||
|
Accessibility |
0.168 |
0.000 |
0.667 |
0.667 |
0.000 |
0.667 |
0.168 |
0.429 |
0.429 |
0.429 |
0.667 |
|
Cultural Attractions |
0.000 |
0.168 |
0.000 |
0.000 |
0.000 |
0.000 |
0.000 |
0.127 |
0.127 |
0.127 |
0.000 |
|
View |
0.545 |
0.287 |
0.333 |
0.000 |
1.000 |
0.333 |
0.545 |
0.222 |
0.222 |
0.222 |
0.000 |
|
Distance from Sight Line |
0.287 |
0.545 |
0.000 |
0.333 |
0.000 |
0.000 |
0.287 |
0.222 |
0.222 |
0.222 |
0.333 |
|
Slope |
0.545 |
0.000 |
0.287 |
0.667 |
0.333 |
0.545 |
0.545 |
0.545 |
0.545 |
0.545 |
0.545 |
|
Ecosystem |
0.287 |
0.000 |
0.168 |
0.333 |
0.000 |
0.168 |
0.287 |
0.287 |
0.287 |
0.168 |
0.287 |
|
Landscape |
0.168 |
1.000 |
0.545 |
0.000 |
0.667 |
0.287 |
0.168 |
0.168 |
0.168 |
0.287 |
0.168 |
|
Land Use |
0.333 |
0.333 |
0.667 |
1.000 |
0.333 |
0.667 |
0.333 |
0.333 |
0.667 |
0.333 |
0.667 |
|
Surrounding Land Use |
0.667 |
0.667 |
0.333 |
0.000 |
0.667 |
0.333 |
0.667 |
0.667 |
0.333 |
0.667 |
0.333 |
|
Land Price |
0.000 |
1.000 |
1.000 |
0.000 |
0.000 |
1.000 |
0.000 |
0.333 |
0.333 |
0.333 |
0.000 |
|
Existing Infrastructure |
1.000 |
0.000 |
0.000 |
1.000 |
1.000 |
0.000 |
1.000 |
0.667 |
0.667 |
0.667 |
1.000 |
Table 5. Weighted Supermatrix
|
.S' |
"5 § s s |
u > |
2 v .23 ад Q |
D О ад |
щ |
5 |
ад я -о 1 5 ад |
•3 g |
|||
|
Accessibility |
0.072 |
0.000 |
0.286 |
0.286 |
0.000 |
0.286 |
0.072 |
0.184 |
0.184 |
0.184 |
0.286 |
|
Cultural Attractions |
0.000 |
0.072 |
0.000 |
0.000 |
0.000 |
0.000 |
0.000 |
0.054 |
0.054 |
0.054 |
0.000 |
|
View |
0.234 |
0.123 |
0.143 |
0.000 |
0.429 |
0.143 |
0.234 |
0.095 |
0.095 |
0.095 |
0.000 |
|
Distance from Sight Line |
0.123 |
0.234 |
0.000 |
0.143 |
0.000 |
0.000 |
0.123 |
0.095 |
0.095 |
0.095 |
0.143 |
|
Slope |
0.121 |
0.000 |
0.064 |
0.148 |
0.074 |
0.121 |
0.121 |
0.121 |
0.121 |
0.121 |
0.121 |
|
Ecosystem |
0.064 |
0.000 |
0.037 |
0.074 |
0.000 |
0.037 |
0.064 |
0.064 |
0.064 |
0.037 |
0.064 |
|
Landscape |
0.037 |
0.222 |
0.121 |
0.000 |
0.148 |
0.064 |
0.037 |
0.037 |
0.037 |
0.064 |
0.037 |
|
Land Use |
0.074 |
0.074 |
0.148 |
0.222 |
0.074 |
0.148 |
0.074 |
0.074 |
0.148 |
0.074 |
0.148 |
|
Surrounding Land Use |
0.148 |
0.148 |
0.074 |
0.000 |
0.148 |
0.074 |
0.148 |
0.148 |
0.074 |
0.148 |
0.074 |
|
Land Price |
0.000 |
0.127 |
0.127 |
0.000 |
0.000 |
0.127 |
0.000 |
0.042 |
0.042 |
0.042 |
0.000 |
|
Existing Infrastructure |
0.127 |
0.000 |
0.000 |
0.127 |
0.127 |
0.000 |
0.127 |
0.085 |
0.085 |
0.085 |
0.127 |
Table 6. Limit Supermatrix
|
"S 1 3 о я S |
U > |
2 у 8 "Ы) .23 ад Q |
о о ад |
§ щ |
5 |
ад я V 1 5 2 ^ ад |
f 1 о |
||||
|
Accessibility |
0.173 |
0.173 |
0.173 |
0.173 |
0.173 |
0.173 |
0.173 |
0.173 |
0.173 |
0.173 |
0.173 |
|
Cultural Attractions |
0.015 |
0.015 |
0.015 |
0.015 |
0.015 |
0.015 |
0.015 |
0.015 |
0.015 |
0.015 |
0.015 |
|
View |
0.158 |
0.158 |
0.158 |
0.158 |
0.158 |
0.158 |
0.158 |
0.158 |
0.158 |
0.158 |
0.158 |
|
Distance from Sight Line |
0.082 |
0.082 |
0.082 |
0.082 |
0.082 |
0.082 |
0.082 |
0.082 |
0.082 |
0.082 |
0.082 |
|
Slope |
0.107 |
0.107 |
0.107 |
0.107 |
0.107 |
0.107 |
0.107 |
0.107 |
0.107 |
0.107 |
0.107 |
|
Ecosystem |
0.050 |
0.050 |
0.050 |
0.050 |
0.050 |
0.050 |
0.050 |
0.050 |
0.050 |
0.050 |
0.050 |
|
Landscape |
0.065 |
0.065 |
0.065 |
0.065 |
0.065 |
0.065 |
0.065 |
0.065 |
0.065 |
0.065 |
0.065 |
|
Land Use |
0.116 |
0.116 |
0.116 |
0.116 |
0.116 |
0.116 |
0.116 |
0.116 |
0.116 |
0.116 |
0.116 |
|
Surrounding Land Use |
0.106 |
0.106 |
0.106 |
0.106 |
0.106 |
0.106 |
0.106 |
0.106 |
0.106 |
0.106 |
0.106 |
|
Land Price |
0.039 |
0.039 |
0.039 |
0.039 |
0.039 |
0.039 |
0.039 |
0.039 |
0.039 |
0.039 |
0.039 |
|
Existing Infrastructure |
0.088 |
0.088 |
0.088 |
0.088 |
0.088 |
0.088 |
0.088 |
0.088 |
0.088 |
0.088 |
0.088 |
-
5.3.4. Select linguistic quantifiers
-
5.3.5. Calculation of the overall evaluation score of alternatives
Zadeh [43] proposed the concept of fuzzy linguistic quantifiers. These objects are exemplified by terms such as most, many, some, “at least one”, or “all” and are represented by fuzzy sets [44]. Although there are several classes of quantifiers; Yager [45] suggested that the regular increasing monotone (RIM) relative quantifiers are the most adequate for multicriteria decision making as one wants to represent the fact that the larger the number of satisfied criteria the more satisfied we are with the solution. In this setting, if Q is a linguistic quantifier, then it can be represented as a fuzzy subset over the unit interval [0, 1], where for each p in the unit interval, the membership grade Q(p) indicates the compatibility of p with the concept denoted by Q [24]. To identify the quantifier, Yager [45] employed one of the most often used methods for defining a parameterized subset on the unit interval:
Q ( p ) = p a , a > 0 (2)
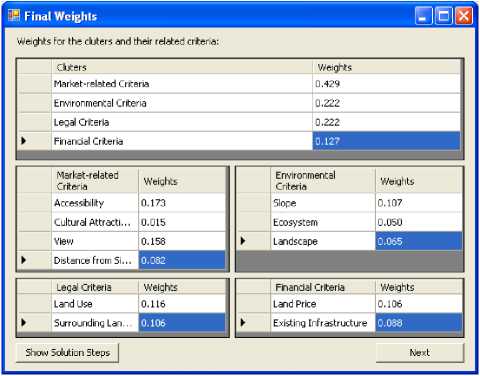
Fig. 14. The Final Weights of Decision Model
It can be applied for generating a whole family of the RIM quantifiers. Table 8 shows a selection of the RIM quantifiers and their characteristics. By changing the parameter, a , one can generate different types of linguistic quantifiers and associated order weights between two extreme cases of the "All" and "At least one" quantifiers. With different sets of order weights, one can generate a wide range of OWA operators, including the most often used decision rules in GIS: WLC, and Boolean overlay operations (AND and OR). Boolean approaches are extreme functions that result in risk-averse (pessimistic) solutions when the AND operator is used or in risk-taking (optimistic) solutions when the OR operator is used. The WLC approach is an averaging technique that softens the hard decisions of the Boolean approach, avoiding the extremes. In a continuum of risk, WLC falls exactly in the middle; it is neither risk-averse nor risk-taking as shown in Table 8 [27].
After estimating the criterion weight wj in section 5.3.3, the ordered criterion values zij , such that z1 1 > zi2 >......> zn , are obtained by sorting the standardized criterion values xij in descending order. Then the reordered criterion weight uk is obtained according to the attribute value zij .
The overall score of the ith alternative will be calculated as follows:
j = 1
v j
( j a
Z U k
I k=1 J j "
I k = 1
A a
k
J
Where a is the parameter linked to the linguistic quantifier.
Table 8. Selected linguistic quantifiers and corresponding α parameters (adapted from [17])
|
α |
Quantifier (Q) |
OWA weights (v j ) |
Combination procedure |
Trade-off |
OR-ness |
Decision strategies |
|
α→0 |
At least one |
v 1 = 1; v j = 0 for others |
Logic “OR” (MAX) |
0 |
1 |
Extremely optimistic |
|
α = 0.1 |
Few |
* |
* |
* |
* |
Very optimistic |
|
α = 0.5 |
Some |
* |
* |
* |
* |
Optimistic |
|
α = 1 |
Half |
v j = 1/n for all j |
WLC |
1 |
0.5 |
Neutral |
|
α = 2 |
Many |
* |
* |
* |
* |
Pessimistic |
|
α = 10 |
Most |
* |
* |
* |
* |
Very pessimistic |
|
α→∞ |
All |
v n = 1; v j = 0 for others |
Logic “AND” (MIN) |
0 |
0 |
Extremely pessimistic |
Note: “*” is Case dependent
The importance of the criteria has been judged and weights are calculated according to Tables 7. Given the weights and the corresponding standardized criterion maps ANP-OWA is applied using selected values of fuzzy linguistic quantifiers: at least one, few, some, half, many, most and all for the goal of the decision making as shown in Fig. 15. These linguistic quantifiers correspond to the following decision strategies: extremely optimistic, very optimistic, less optimistic, neutral, less pessimistic, very pessimistic, and extremely pessimistic as shown in Table 8. Fig. 16 shows the seven alternative land suitability scenarios for hotel site selection.
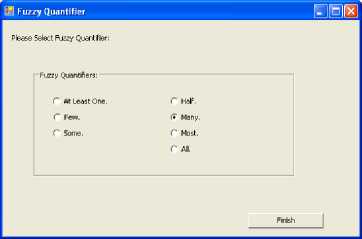
Fig. 15. Assigning linguistic quantifiers to the goal of a decision problem.
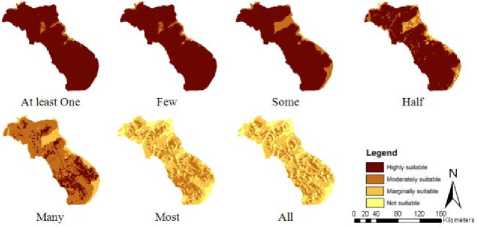
Fig. 16. Site suitability for hotel development: The results of ANP-OWA procedures for selected linguistic quantifiers.
-
VI. C oncluding R emarks
The tourism development site selection process has become increasingly complex because of the plethora of environmental laws and regulations as well as the greater public awareness and involvement in the zoning and environmental issues. Expert system, GIS and MCE are very vital efficient tools for solving sitting problem. However, each of these tools has its own limitations and drawbacks in solving such problem. The integration of these techniques eliminates these limitations and provides the decision maker with an innovative approach to sitting problem. Although many recent publications discussed the application of ES, MCE, and GIS in a variety of sitting problems, only a few of them are related to tourism development site selection problems.
This paper presents a new decision making framework in which ES, GIS, and ANP-OWA are integrated systematically to handle tourism development site selection decisions. According to the type of the proposed tourism facility, an expert system is used to define the recommended sitting criteria and the interdependence relationships within and between them . Then, the GIS-based ANP-OWA is used to perform the spatial data analysis necessary to generate a wide range of possible candidate sites’ scenarios taking into accounts both the interdependence relationships between sitting criteria and the level of risk the decision-makers wish to assume in their multicriteria evaluation. A prototype spatial decision support system (Tourism Site Selection Advisory System) is developed to implement the proposed decision making framework. A typical case study is presented to demonstrate the application of the proposed decision making framework.
References An Expert GIS-Based ANP-OWA Decision Making Framework for Tourism Development Site Selection
- O. A. Shcherbina, and E. A. Shembeleva, “Modeling Tourism Sustainable Development,” in Innovations in Computing Sciences and Software Engineering, T. Sobh, and K. Elleithy eds., Netherlands: Springer, 2010, pp. 551-556.
- T. Chou, C. Hsu, and M. Chen, “A fuzzy multi-criteria decision model for international tourist hotels location selection,” International Journal of Hospitality Management, vol. 27, pp. 293–301, 2008.
- K. Eldrandaly, Spatial Decision Making: An Intelligent GIS-Based Decision Analysis Approach, Germany: VDM Verlag, 2010.
- C. Jun, Incorporating decision preferences into an expert geographic information system for industrial site selection, PhD Dissertation, Texas A&M University, College Station, USA, 1997.
- R. Feick, and B. Hall, “The Application of a Spatial Decision Support to Tourism-Based Land Management in Small Island States,” Journal of Travel Research, vol. 39, pp. 163-171, 2000. DOI:10.1177/004728750003900206.
- K. Eldrandaly, N. Eldin, and D. Sui, “A COM-based Spatial Decision Support System for Industrial Site Selection,” JGIDA, vol. 7(2), pp. 72-92, 2003.
- N. Eldin, and K. Eldrandaly, “A Computer-Aided Decision-Making System for Siting Capital Investment Projects,” ASCAAD's first International Conference on Computer Aided Architectural Design, Saudi Arabia: KFUPM, 2005.
- M. H. Vahidnia, A. A. Alesheikh, and A. Alimohammadi, “Hospital site selection using fuzzy AHP and its derivatives,” Journal of Environmental Management, vol. 90 (10), pp. 3048–3056, 2009.
- K. A. Eldrandaly, and N. M. AbdelAziz, “Enhancing ArcGIS Decision Making Capabilities Using an Intelligent Multicriteria Decision Analysis Toolbox,” Journal of Environmental Informatics, vol. 20 (1), pp. 44-57, 2012.
- M. Rahman, B. Rusteberg, R. Gogu, J. Ferreira, and M. Sauter, “A New Spatial Multicriteria Decision Support Tool for Site Selection for Implementation of Managed Aquifer Recharge,” Journal of Environmental Management, vol. 99, pp. 61-75, 2012.
- K. Eldrandaly, “Developing a GIS-Based MCE Site Selection Tool in ArcGIS Using COM Technology,” IAJIT vol. 10(3), 2013.
- C. Chen, “Applying the Analytical Hierarchy Process (AHP) Approach to Convention Site Selection,” Journal of Travel Research, vol. 45, pp. 167-174, 2006. DOI: 10.1177/0047287506291593.
- S. Lee, A Spatial Decision Support System for Guiding the Selection of Tourism Development Sites, PhD Dissertation, Texas A&M University, USA, 2001.
- M. Ghamgosar, M. Haghyghy, F. Mehrdoust, and N. Arshad, “Multicriteria Decision Making Based on Analytical Hierarchy Process (AHP) in GIS for Tourism, Middle-East,” Journal of Scientific Research, vol. 10 (4), pp. 501-507, 2011.
- M. Abed, M. Monavari, A. Karbasi, P. Farshchi, and Z. Abedi, “Site Selection Using Analytical Hierarchy Process by Geographical Information System for Sustainable Coastal Tourism,” International Conference on Environmental and Agriculture Engineering, vol.15, pp. 120-124, 2011.
- T. L. Saaty, Decision Making with Dependence and Feedback: The Analytic Network Process, Pittsburgh: RWS Publications, 1996.
- Y. Meng, J. Malczewski, and S. Boroushaki, “A GIS-based multicriteria decision analysis approach for mapping accessibility patterns of housing development sites: a case study in Canmore, Alberta.” Journal of Geographic Information Systems, vol. 3, pp. 50–61, 2011.
- K. Eldrandaly, “Exploring multi-criteria decision strategies in GIS with linguistic quantifiers: an extension of the analytical network process using ordered weighted averaging operators,” International Journal of Geographical Information Science, vol. 27(12), pp. 2455-2482, 2013.
- B. Davis, GIS: A Visual Approach, OnWord Press, 2001.
- M. AL-Amri and K. Eldrandaly, “A Proposed GIS-Based Decision Making Framework for Tourism Development Sites Selection,” The International Arab Conference on Information Technology, 2011.
- R. L. Keeney, Siting Energy Facilities. Academic Press, New York, USA, 1980.
- E. A. Williams, and A. K. Massa, Siting of Major Facilities: A Practical Approach, New York: McGraw- Hill Inc., 1983.
- J. Malczewski, GIS and Multicriteria Decision Analysis, John Wiley and Sons, 1999.
- S. Boroushaki, and J. Malczewski, “Implementing an extension of the analytical hierarchy process using ordered weighted averaging operators with fuzzy quantifiers in ArcGIS,” Computers & Geosciences, vol. 34(4), pp. 399-410, 2008.
- T. Nyerges, and J. Jankowski, Regional and Urban GIS: A Decision Support Approach. New York: The Guilford Press, 2010.
- J. Malczewski, “Ordered weighted averaging with fuzzy quantifiers: GIS-based multicriteria evaluation for land-use suitability analysis,” International Journal of Applied Earth Observations and Geoinformation, vol. 8 (4), pp. 270–277, 2006.
- S. P. Abadi, Application of Analytic Network Process and GIS for Evaluating Integrated Coastal Land Use in Kuala Langat District, Selangor, Malaysia. Thesis (PhD). Putra University Malaysia, 2008.
- T. Gómez-Navarro, M. García-Melón, D. Díaz-Martín and S. Acuna-Dutra, “Evaluation of urban development proposals An ANP approach,” World Academy of Science, Engineering and Technology, vol. 44, 2008.
- S. Drobne, and A. Lisec, “Multi-attribute Decision Analysis in GIS: Weighted Lainear Combination and Order Weighted Averaging,” Informatica, vol. 33, pp. 459-474, 2009.
- H. Jiang, and J. R. Eastman, “Application of fuzzy measures in multi-criteria evaluation in GIS,” int. j. geographical information science, vol. 14(2), pp. 173-184, 2000.
- J.Malczewski, and C. Rinner, “Exploring multicriteria decision strategies in GIS with linguistic quantifiers: A case study of residential quality evaluation,” J Geograph Syst, vol. 7, pp. 249–268, 2005.
- O. Nekhay, M. Arriaza, and L. Boerboom, “Evaluation of soil erosion risk using Analytic Network Process and GIS: A case study from Spanish mountain olive plantations,” Journal of Environmental Management, vol. 90, pp. 3091–3104, 2009.
- K. Chen, K. Tsai, and C. Shieh, “Analytic Network Process Method Integrated with GPS/GIS Technology Used to Identify Potential Slope Failures in Central Taiwan,” Proc. of the Nineteenth (2009) International Offshore and Polar Engineering Conference. Osaka: Japan, 2009.
- Microsoft, Microsoft Developer Network online documentation, MSDN Library, 2005.
- Rulemachines, Visual Rule Studio Developer’s Guide, Canada: OnDemandManuals, 2002.
- A. H. Zaied, S. I. AbdelAal, M. M. Hassan, “Rule-based Expert Systems for Selecting Information Systems Development Methodologies,” I.J. Intelligent Systems and Applications, vol. 5(9), pp. 19-26, 2013.
- ESRI, What is ArcGIS? Redlands: ESRI Press, 2001.
- ESRI, ArcGIS 9: The complete Geographic Information System, Redlands: ESRI Press, 2006.
- ESRI, ArcGIS® Desktop Developer Guide, Redlands: ESRI Press, 2004.
- M. Mollaghasemi, and J. Pet-Edwards, Making Multi-Objective Decisions. California: IEEE Computer Society Press, 1997.
- T. L. Saaty, “Decision Making- The Analytic Hierarchy and Network Processes (AHP/ANP),” Journal of Systems Science and Systems Engineering, vol. 13(1), pp. 1-35, 2004.
- I. Yuksel, and M. Dagdeviren, “Using the analytic network process (ANP) in a SWOT analysis – A case study for a textile firm,” Information Sciences, vol. 177, pp. 3364–3382, 2007.
- L. A. Zadeh, “A computational approach to fuzzy quantifiers in natural languages,” Computers & Mathematics with Applications, vol. 9, pp. 149–184, 1983.
- J. M. David, K. Balakrishnan, “Performance Improvement of Fuzzy and Neuro Fuzzy Systems: Prediction of Learning Disabilities in School-age Children,” I.J. Intelligent Systems and Applications, vol. 5(12), pp. 34-52, 2013.
- R. Yager, “Quantifier guided aggregation using OWA operators,” International Journal of Intelligent Systems, vol. 11, pp. 49–73, 1996.
