An Innovative Leukemia Detection System using Blood Samples via a Microscopic Accessory

Author: Azza M. Bin Aof, Ethar A. Awad, Sarah R. Omer, Banazier A. Ibraheem, Zeinab A. Mustafa
Journal: International Journal of Engineering and Manufacturing @ijem
Article in issue: 1 vol.13, 2023.
Free access
Leukemic patients are in a rapid increase. Hence, the use of microscopic images of blood samples through visual inspection to identify blood disorders has increased, opening the door for computerized techniques for detecting leukemia. This project applies computer vision techniques to increase the accuracy and speed of detection from periph-eral blood. It also enhances visualization by providing an appropriate supplement to traditional microscopy. A micro-computer (Raspberry Pi) was well programmed in Python for analyzing images with the help of a Raspberry Pi camera and a touch screen as an alternative to the eyepiece. To achieve diversity and seek for more accuracy, image datasets for this project were obtained from various resources. These datasets were then analyzed through image processing techniques to detect leukemia cells. This detection process involves resizing cells to a standard size, noise removal by linear scaling filter, global-local contrast enhancement, segmentation of white blood cells (WBCs) using marker-controlled watershed algorithm, overlapping detection and separation using watershed and k-means clustering algorithms, and extraction with selection of the most relevant features from cells. These features were then imported into the Support Vector Machine (SVM) model which resulted in an accuracy of 93.2773%. A standalone desktop application with a suitable graphical user interface (GUI) was implemented. It was then uploaded into the Raspberry Pi, some code lines were rewritten for dealing with the camera, the hardware was designed and implemented, and then formal experiments were conducted resulting in the detection of leukemia in 5 samples out of 6. This implies that precise detection can be implemented with different data taken in various imaging conditions.
Blood samples, Marker-controlled watershed, overlapping, SVM, Raspberry Pi
Short address: https://sciup.org/15018606
IDR: 15018606 | DOI: 10.5815/ijem.2023.01.03
Text of the scientific article An Innovative Leukemia Detection System using Blood Samples via a Microscopic Accessory
Cancer is a group of diseases characterized by the uncontrolled growth and spread of abnormal cells. Blood cancer is one of the cancer categories; it is very dangerous as it leads to many deaths around the world. It is the most common childhood cancer [1]. The major types of blood cancer include leukemia, lymphoma, and myeloma [2]. In leukemia, the infection fighting cells, white blood cells (WBCs), are produced abnormally in the bone marrow. These cells suppress the development of normal cells, which affects the immune system and decreases the amount of RBCs and platelets by impairing the ability of the bone marrow to produce them [3]. There are four main types of leukemia according to cell type and rate of growth; Acute Myelogenous Leukemia (AML), Acute Lymphocytic Leukemia (ALL), Chronic Myelogenous Leukemia (CML), and Chronic Lymphocytic Leukemia (CLL) [1]. Leukemia can be detected accurately with the flow cytometry test, but the common detection starts with a CBC test (showing the abnormal WBCs count) followed by microscopic visualization of a needle biopsy of bone marrow. The procedure depends on the morphological analysis of the samples by hematologists. This utilized technique is convenient, but it has many drawbacks including how complex, boring, and imprecise it is in addition to the amount of time it wastes [4]. Add to that how the technician is affected by the long microscope visualization as it causes eye stress, and how the patient has to stand a painful bone marrow test. The flow cytometry test is made only after passing the bone marrow test. This test is so expensive and the available devices are limited. For these reasons, any previous misdiagnosis should be avoided. Many studies are now trying to find an alternative solution to leukemia detection from blood instead of bone marrow using computer and advanced image processing techniques which facilitates and speeds up its use by technicians. The objective of this article is to detect leukemia in peripheral blood with accurate results and fast detection. By applying computer vision techniques, we provide a supplement to traditional microscopy to enhance the process and visualization.
2. Related Work
All papers related to our topic seem to be following the same general steps but with modifications along the way. Chin et al. [4] used modified marker controlled watershed segmentation and morphological operators to segment WBC membranes. They applied SDM-based clustering algorithm to separate nucleus and cytoplasm correctly, followed by the extraction of 80 shape, texture, and color features. In their research, they tested 3 classifiers (MLP, SVM, and ensemble) and noticed that Dempster-Shafer ensemble classifier offers the highest accuracy. In addition, Desai and Shet [5] adjusted, enhanced, and filtered images to make them suitable for further processing, then converted them to HIS color model. They employed k-means clustering algorithm and extracted statistical features which were used to train the Artificial Neural Network. Then, they proposed a Graphical User Interface (GUI) implementation for step-wise execution of the code, and reported 94.7% classification accuracy. Furthermore, according to Jagadev and Virani [6], K means clustering, Marker controlled Watershed, and HSV color based segmentation algorithms were almost the same with slight differences. In their work, they used SVM classifier after extracting a large number of statistical features and presented the possibility of a detailed classification into whether the patient has ALL, AML, CML, CLL, or healthy. Moreover, Mangaiyarkarasi and Geethabai [6] conducted their experiments almost following the same methodology by pre-processing then segmenting but determined whether cells were blasts or not from nucleus separation. They detected leukemia from the good descriptive features they acquired, which were similar to those obtained by Chin et al. [4]. According to the dataset, preprocessing was done to enhance the images, reduce dimensions, improve the computational time, and remove noise. As for segmentation, K-means clustering was mostly used because it's less complicated, but it was improved every time with additional techniques. Watershed was also applied and it got higher accuracy, therefore it is recommended to be used and improved. Most papers extracted statistical features with other additional ones. The ANN and SVM classifiers were mostly used in previous studies, and it was noticed that SVM gave high accuracy even on a small dataset [4,6]. For practical examination, no paper from the mentioned above applied the processes practically.
3. Framework
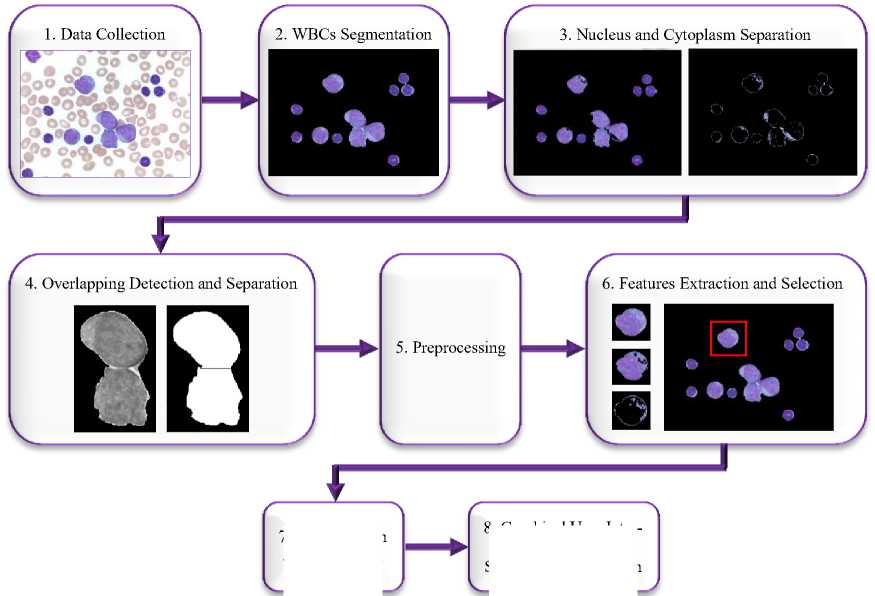
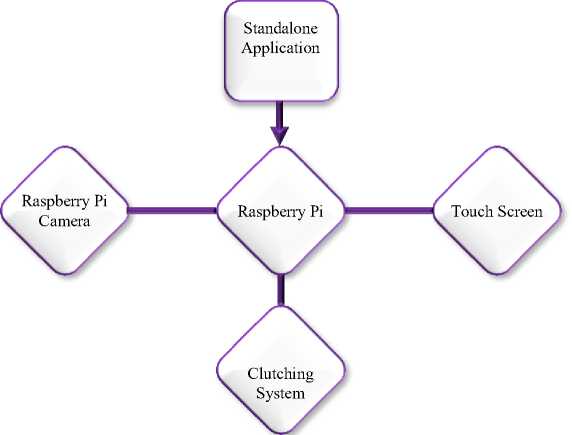
This approach explains the suggested method for leukemia detection in blood images using Raspberry Pi as an image processor. This part is divided into two sections: a software design and a hardware design. Section 1, software design, consists of eight steps as seen in Fig. 1. Section 2, hardware design, consists of a controlling system, an imaging system, and a clutching system as shown in Fig. 2.
7. Classification and Evaluation
8. Graphical User Interface (GUI) and Standalone Application
Fig. 1.The software structure.
-
3.1. Software Design
-
3.1.1. Data Collection (Original Images):
-
-
3.1.2. WBCs Segmentation:
-
3.1.3. Nucleus and Cytoplasm Separation:
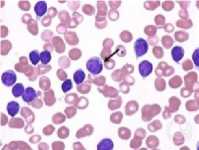
Acute Lymphoblastic Leukemia Image Database (ALL-IDB1), the American Society of Hematology (ASH), and Hematopathology are the three online databases from which images were acquired. The images are two hundred sixty blood samples from leukemic and non-leukemic patients. These images were firstly resized to a standard size due to the variations in their resolutions.
The part of image needed for further processing is only the WBCs. In order to get purely this region of interest (ROI), the marker-controlled watershed segmentation technique was implemented. The watershed transform is a tool morphological based. There are several tools morphological in image segmentation namely erosion, dilation, reconstruction etc. We are interested in this work in the morphological reconstruction based on dilatation. Morphological dilatation; Let X be a subset of E. If at any x we associate a position B(x) of the structuring element B, then the set X dilated by the structuring element B is defined as following:
5 В(Х) = { хЕЕ,В(х)пХ * р^
The structuring element B, denoted by its center is moved to occupy successively all positions of the space E. For each position. [7]
In this step, the nucleus was separated from the cytoplasm from each cell within the image to obtain more details. This was performed using K-means clustering algorithm. [8] K-means is a typical clustering algorithm in data mining and which is widely used for clustering large set of data. It was applied to solve the problem of the well-known cluster. It is a partitioning clustering algorithm, this method is to classify the given date objects into k different clusters through the iterative, converging to a local minimum. The algorithm consists of two separate phases. The first phase selects k centers randomly, where the value k is fixed in advance. The next phase is to take each data object to the nearest center. Euclidean distance is generally considered to determine the distance between each data object and the cluster centers. When all the data objects are included in some clusters, the first step is completed and an early grouping is done. Recalculating the average of the early formed clusters. This iterative process continues repeatedly until the criterion function becomes the minimum.[9]
Supposing that the target object is x, xi indicates the average of cluster Ci, criterion function is defined as follows:
E ^^’L xeci lx-xil2 (2)
E is the sum of the squared error of all objects in database. The distance of criterion function is Euclidean distance, which is used for determining the nearest distance between each data objects and cluster center. The Euclidean distance between one vector x=(x1 ,x2 ,…xn) and another vector y=(y1 ,y2 ,…yn ), The Euclidean distance d(xi, yi) can be obtained as follow:
d(xi,yi) = E”=i (xi - yi)2]1/ 2 (3)
The process of k-means algorithm as follow: Input: Number of desired clusters, k, and a database D = {d1, d2,…dn} containing n data objects. Output: A set of k clusters. [9]
-
3.1.4. Overlapping Detection and Separation:
-
3.1.5. Preprocessing:
After performing the main segmentation step, it was noticed that some cells were overlapped. This reduces the integrity of the extracted features. For this reason, additional detection and splitting step was performed using watershed algorithm. [10,11]
Preprocessing is usually made to make data easier to work with. Processing time matters too and therefore this step was not performed until ROI was finally ready. This step includes filtering and contrast enhancement to improve image quality and extract better features. [12]
-
A. Filtering
Noise is usually present in images. It shows faults in original images and therefore must be removed. Linear scall-ing filter was used. The Linear scaling and sorting filter compute the mean of pixels in a certain window, it takes k points of a pixel neighborhood, which are closest to the gray level of the image at the middle point in the moving window including It, then assigns the mean value of these points to the middle point [13].
-
B. Contrast Enhancement
-
3.1.6. Features Extraction and Selection:
Contrast enhancement improves the image’s visibility, therefore reflects on the clarity of its features. It was performed using global local contrast enhancement. It is a combination of a global and local image contrast enhancement. First, using a global contrast enhancement, and then using the local contrast enhancement. It can be implemented by applying SAGCE using equation (1) and adjust Cg fx(i,D = (1 + Cg) * [x(ij) - gmean] + 0.5 (4)
Where, x(i,j) is the pixel value at location (ij) of the original input image, Cg is the global contrast gain trol, gmean is the global mean of the pixel values of the whole image and the threshold , fx(i,j') is the enhanced value of the pixel x(i,j') [14].
Then apply one of the local contrast methods using LSD
f(i,j)= f x (i,j)+ C- .[f x (i,j)-m(i,j)] (5)
О (i,J) + s
Where, fx(i,j')is the the global enhanced output value of the original pixel value x(i,j) at location (i,j^ of the original input image using equation (1) , m(i,j) is the local mean at (i,j^ amoung the neighbourhood values of fx(i,D , °"(i,j^ is the LSD at (i,j) among the neighborhood values of f x (ij), C is the local contrast gain control, s is very small and negligible quantity greater than zero and f(i,j) is the enhanced output value produced by GLCE [14].
Quantitative features contain information important for cell distinction. One hundred three features were extracted from cell, nucleus, and cytoplasm within each image. These features were 60 statistical texture, 33 shape [10], and 10 color features [15]. To remove redundant data and increase the training accuracy, the extracted data were reduced according to their weight and importance by using the Relief Ranking Algorithm.
-
3.1.7. Classification and Evaluation:
-
3.1.8. Graphical User Interface (GUI) and Standalone Application:
In order to classify cells into whether they are leukemic or not, a Support Vector Machine (SVM) classifier was used. SVM is a marginal classifier which maximizes the margin between the data samples in the two classes. An optimal hyperplane boundary is drawn which will separate the data. In SVM, kernels are used to map the input data to a higher dimensional space where a decision boundary can be constructed. The decision function is given as:
D(x) = w0(x) + b
Where w and b are the SVM parameters and 0(x) is a kernel function that maps the input data into the new M dimension [16].
In this application, 790 cells with their features and whether they were normal or leukemic were specified. The data was split into training and testing sets in a ratio of 7:1 sequentially. A shuffling of the rows was performed multiple times until a suitable arrange was reached, then data features and targets were separated and scaled. A grid search crossvalidation method was used to select the appropriate hyperparameters (regularization parameter (C) and gamma) using 5-folds. The fitted model is then trained using 5-folds validation and used for prediction.
As for the evaluation part, the testing set was used to check the SVM model prediction validity. Precision, recall, accuracy, and F-score measurements were acquired constructing a confusion matrix to determine the performance.
The GUI was designed by Qt designer to manage interactions between the system and users. The final program was then converted into a standalone application for it to run locally on the devices without the need for any other services to be installed.
-
3.2. Hardware Design
-
3.2.1. Control System:
-
3.2.2. Imaging system:
Fig. 2. The hardware structure.
The controlling unit consists of a Raspberry Pi computer and a touch screen for monitoring and controlling (see Fig. 3). The Raspberry Pi is a tiny computer in a small package that uses low power and is programmed by Python language. It uses a Broadcom BCM2711Bo SoC with 1.5 GHz 64-bit quad-core ARM Cortex-A72 processor, making it suitable for image processing tasks. It also has USB ports allowing the exchange of data.
The touch screen is connected to the Raspberry Pi through High-Definition Multimedia Interface (HDMI) connectors. It is used to communicate with Raspberry Pi and control it. Configuring the system was done first, followed by downloading all required libraries and testing the prepared in advance Python code. This was followed by making the required modifications for the full code to work properly. Another method for accessing the Raspberry Pi is an installation of VNC Viewer app on a smartphone or a computer.
A Raspberry Pi Camera (Fig. 3 (d)) was used to capture images for analysis. The module is installed by inserting the cable into the Raspberry Pi camera port, and then enabling camera support in the Raspberry Pi configuration tool. A button has been added in the GUI to use the camera. It opens video streaming to allow the user to view the sample and capture a suitable image that is then processed.
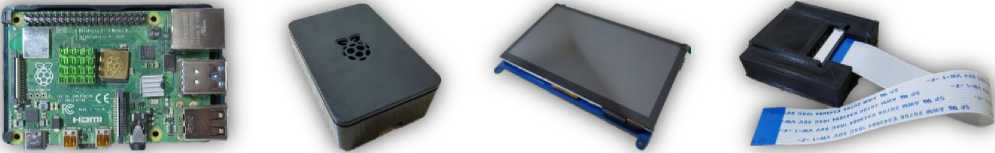
(b)
(a)
(c)
(d)
Fig. 3. (a) Raspberry Pi 4 model B. (b) Raspberry Pi case. (c) Touch Display. (d) Raspberry Pi Camera with its holder.
3.2.3. Clutching System:
4. Results and Discussion
The parts of the device must be assembled in a practical way. The Raspberry Pi and touch screen were installed in the digiscoping adapter's clamp that holds it firmly in the microscope eyepiece. The camera was then placed inside a holder for protection and slid inside the eyepiece. The digiscoping adapter and camera holder can be seen in Fig. 4.
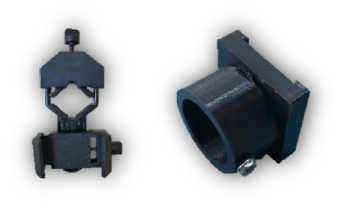
(a) (b)
Fig. 4. (a) Digiscoping adapter. (b) Camera holder.
In the resizing step, pure WBCs were obtained by the extraction of binary blue plane, removing of irregular cells, computing the cells areas' mean, and then resizing after choosing a suitable size. Because of the varying sizes of cells in different images, changing the size of the WBCs in an appropriate proportion aids in the subsequent process.
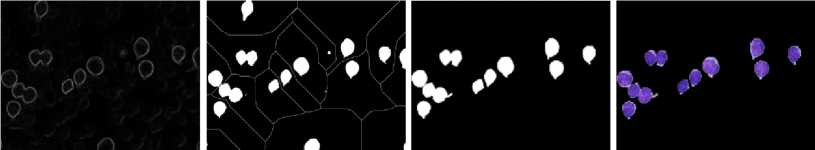
Fig. 5 shows a CLL RGB image. Steps involve calculations of gradient magnitude function, foreground markers (using modified regional maxima), background markers (by finding watershed ridge lines), and watershed transform. The result was a binary image of pure WBCs which was then masked on the original RGB image.
(b) (c) (d) (e)
Fig. 5. (a) Leukemic image. (b) Gradient magnitude. (c) Foreground and background markers. (d) Mask image. (e) Segmented image.
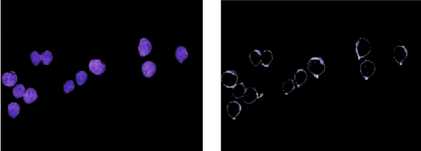
For the separation of nucleus and cytoplasm, conversion to CIELAB color space was followed by K-means clustering of the extracted color features. Morphological operations were then performed and the mask was applied on the original RGB image. See Fig. 6.
(a) (b)
Fig. 6. (a) Nucleus. (b) Cytoplasm.
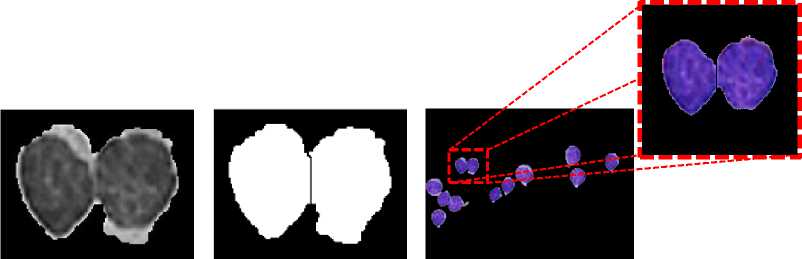
Fig. 7 shows the overlapping detection and separation step. Detection of the cells that needs to be separated was firstly conducted to reduce over-segmentation errors. It was performed manually using image features like average pixels' value, perimeter, and convex perimeter. Successfully detected cells enter the separation function which performs watershed algorithm on them and applies the produced mask on the original image.
(a) (b) (c)
Fig. 7. (a) Detected cells. (b) Separated cells. (c) Separated image.
Images at this point go over the preprocessing phase for better extraction of features in minimal time. The features were shortened to the most relevant 50 from each cell, nucleus, and cytoplasm. Then these cells were classified into normal and leukemia cells by SVM.
Focusing on Fig. 8, it can be noticed that the accuracy initialized to reach 93.2773%; 8 out of 119 samples are misclassified. '-1' refers to leukemic samples, while '1' refers to normal samples. 93.1507% of the 73 leukemia test samples; 5 samples from 73 samples are misclassified and 93.4783% of the 46 normal test samples were detected correctly; 3 samples from 46 samples are misclassified. Confusion matrix is shown as an array below performance results.
i***$***i***$*$i Report *$*$$**$***$**$***$
|
precision |
recall |
fl-score |
support |
|
|
-1 |
0.55774€ |
0.931507 |
0.944444 |
73.000000 |
|
1 |
0.895833 |
0.934783 |
0.914894 |
46.000000 |
|
accuracy |
0.932773 |
0.932773 |
0.932773 |
0.932773 |
|
macro avg |
0.926790 |
0.933145 |
0.925669 |
119.000000 |
|
weighted avg |
0.933814 |
0.932773 |
0.933021 |
119.000000 |
[[63 5]
[ 3 43]]
Fig. 8. Performance results.
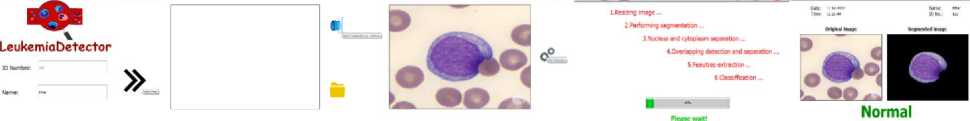
The GUI is given in Fig. 9. Patient data is entered in the first window followed by another window for user to choose whether to open the camera or scan a saved image from the database folder. The image is then scanned for leukemia existence with the results being shown on a new window. Every analyzed image and each patient history will be saved automatically.
+дэ _____ я®®^дн ______ ®®ei +aa ®®oi +ai=i ®@© +&q ®@©
(a) (b) (c) (d) (e)
Fig. 9. GUI.
Raspberry Pi Camera module was installed by inserting the cable into Raspberry Pi 4 camera port. The touch screen has been connected via a standard HDMI to HDMI cable plus a micro HDMI to HDMI adapter. A USB cable was used between the screen and Raspberry Pi USB port to provide the required voltage and current for the screen to work. The Pi camera has been inserted into its container, and then placed in its holder. Raspberry Pi and screen were held tight in their container and the digiscoping adapter, and the power bank has been connected to the Type-C power supply input port of the Raspberry.
When powering up the Raspberry, the operating system is viewed on the touch screen. The code was uploaded by simply copying it into a flash drive and inserting it into the second USB port of the Raspberry. After checking the full code, some additional lines of code were written to identify the connected camera and communicate with it. See Fig. 10.
The final step was to test the device. Thanks to the Military Hospital, the hematology laboratory allowed us to perform some experiments that turned out to be successful. The device was installed firmly on the microscope, and the program executed giving a correct prediction to the placed sample. 4 out of 5 experiments succeeded.
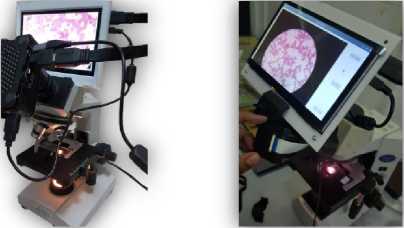
Fig. 10. The full device.
5. Conclusions
This project is intended to give attention to both patients and technicians by utilizing blood samples instead of bone marrow and providing a mean of better viewing and analysis. An abnormal count of WBCs indicates the possibility of leukemia, and this technique can confirm its presence using microscopic blood samples. “Some digital diagnosis systems were developed to analyze microscopic blood images for leukemia detection.” [4] This has been done using a CAD system that performs all required analysis with an additional microscope accessory that simplifies the operation. The Raspberry Pi, its camera, touch screen, and holding case formed the full device that fits on almost any microscopic eye lens; and this practical hardware implementation was carried out giving the research more significance than others. Along with this research, images passed through many processes especially because of their diversity. Their final features have been used to train the SVM model. This produced an accuracy of 93.2773% using Python as a start, which was then turned into a standalone application installed in the hardware system. The applicability of the proposed method was investigated through real time experiments in a hospital, and results were satisfying. By testing random samples, results were easily obtained and could be saved in memory and easily viewed when needed. The proposed project is applicable to be used in any laboratory center to avoid complexity and achieve desired outcomes with easy and userfriendly techniques. Patients, and the technician, can receive accurate diagnosis in a short period of time using this technique.
In the near future, the leukemia detection system could include: automatic detection and separation of overlapped cells instead of the manual approach, a resizable camera holder to fit all microscope eye lenses, a possibility of early leukemia detection, and a further detection of leukemia main types (acute and chronic), its most common types (ALL, AML, CLL, and CML), and its subtypes.
Conflicts of Interest
The authors declare that there are no conflicts of interest regarding the publication of this article.
Data Availability
The images used in this research were collected from 3 online databases:
-
• Acute Lymphoblastic Leukemia Image Database (ALL-IDB1).
-
• The American Society of Hematology (ASH).
-
• Hematopathology.
The standalone application is still in the development process; therefore it's not available at the moment for public use.
References An Innovative Leukemia Detection System using Blood Samples via a Microscopic Accessory
- Street, W. 2020. Cancer Facts & Figures 2020. Atlanta, GA: American Cancer Society Inc.; 1930:76. [Online] Available from: https://www.cancer.org/content/dam/cancer-org/research/cancer-facts-and-statistics/annual-cancer-facts-and-figures/2020/cancer-facts-and-figures-2020.pdf [Accessed: Sep. 25, 2020].
- American Society of Hematology. “Blood Disorders - Hematology.org”. [Online] Available from: https://www.hematology.org/education/patients/blood-disorders [Accessed: Sep. 26, 2020].
- American Society of Hematology. “Leukemia - Hematology.org”. [Online] Available from: https://www.hematology.org/education/patients/blood-cancers/leukemia [Accessed: Sep. 26, 2020].
- Chin, S., Srisukkham, W., et al. Oct, 2015. “An Intelligent Decision Support System for Leukaemia Diagnosis using Microscopic Blood Images”. Scientific Reports, vol. 5 (1). DOI: 10.1038/srep14938.
- P. G. F. Desai & G. Shet, “Detection and Classification of Leukaemia using Artificial Neural Network,” IJRASET, vol. 6, no. 6, pp. 1316–1321, Jun. 2018. DOI: 10.22214/ijraset.2018.6192.
- Mangaiyarkarasi, N., & Geethabai, P. Mar, 2018. “Detection of Leukemia in Human Blood Samples”. International Journal of Advanced Scientific Research & Development (IJASRD), vol. 5 (1): 323 – 330.
- A. El Allaoui, “Medical Image Segmentation by MarkerControlled Watershed and Mathematical Morphology,” IJMA, vol. 4, no. 3, pp. 1–9, Jun. 2012. DOI: 10.5121/ijma.2012.4301.
- Jagadev, P. & Virani, H.G. “Detection of leukemia and its types using image processing and machine learning”. IEEE Interna-tional Conference on Trends in Electronics and Informatics (ICEI), India, May, 2017: 522–526. DOI: 10.1109/ICOEI.2017.8300983.
- Shi Na,Liu Xumin, Guan Yong. “Research on K-means clustering algorithm: An improved k-means clustering algorithm,” IEEE Third International Symposium on Intelligent Information Technology and Security Informatics (IITSI), China, April, 2010.
- P.Vaghela, H., Modi, H., Pandya, M. & Potdar, M.B. Nov, 2015. “Leukemia detection using digital image processing techniques”. International Journal of Applied Information Systems (IJAIS), vol. 10 (1): 43-51. DOI: 10.5120/ijais2015451461.
- Ghane, N., Vard, A., Talebi, A. & Nematollahi, P. Jul, 2017, “Segmentation of white blood cells from microscopic images using a novel combination of K-means clustering and modified watershed algorithm”. Journal of Medical Signals & Sensors, vol. 7: 92-101. DOI: 10.4103/2228-7477.205503.
- Somorjeet, S., Tangkeshwar, Th., Gourakishwar, N. & Mamata, H. Sep, 2012. “Global-local contrast enhancement.” IJCA, vol. 54 (10): 7-8. DOI: 10.5120/8600-2365.
- S. Kumar, P. Kumar, M. Gupta, and A. K. Nagawat, “Performance Comparison of Median and Wiener Filter in Image De-noising,” IJCA, vol. 12, no. 4, pp. 27–31, Dec. 2010. DOI: 10.5120/1664-2241.
- A., “A Comprehensive Method for Image Contrast Enhancement Based on Global –Local Contrast and Local Standard Deviation,” IJRET, vol. 03, no. 08, pp. 413–416, Aug. 2014. DOI: 10.15623/ijret.2014.0308064.
- Yadav, C., Zele, S., Patil, T., Bombadi, V. & Chaudhari, T. Mar, 2018. “Automatic Blood Cancer Detection Using Image Pro-cessin1g”. International Journal of Recent Trends in Engineering & Research (IJRTER), vol. 4 (3).
- R. Berwick, “An Idiot’s guide to Support vector machines (SVMs),” p. 28.
