An Innovative System for Daily Thunderstorm Event Prediction using Deep Learning

Author: Md. Tasfirul Alam Siyam, Mahfuzul H. Chowdhury
Journal: International Journal of Intelligent Systems and Applications @ijisa
Article in issue: 6 vol.17, 2025.
Free access
Thunderstorms are weather disturbances that can cause lightning, stormy winds, dense clouds, tornadoes, and heavy rain. Thunderstorms can cause extensive damage to people's lives, property, and economies, as well as livestock and national infrastructure. Early warning of thunderstorms can save people's lives and property. Previous thunderstorm prediction research did not develop a system for daily thunderstorm prediction with high accuracy for Bangladeshi citizens by assessing a wide range of meteorological variables. To address this issue, this work develops a daily high accuracy based localized thunderstorm event prediction system that analyzes various meteorological factors, dates, and specific location information. This dataset was analyzed using a variety of machine learning models, including traditional statistical models like ARMA, ARIMA, and SARIMA, as well as XGBoost ensemble methods and some deep learning models such as ANN, LSTM, and GRU. The results show that advanced neural network models, particularly GRU and LSTM, outperform others in terms of RMSE, R2, MAE, and MAPE. The GRU model outperformed all other schemes, with an RMSE of 0.794, R2 of 0.998, MAE of 0.476, and MAPE of 3.544%. The mobile application provides users with accurate, localized thunderstorm forecasts, allowing for better safety, event planning, and environmental preparedness. User feedback-based mobile app assessment confirms that more than 55% of users are highly satisfied with the thunderstorm assistance app’s features and usefulness.
Thunderstorm Prediction, Deep Learning, GRU, LSTM, Time-Series Data, and Mobile Application
Short address: https://sciup.org/15020099
IDR: 15020099 | DOI: 10.5815/ijisa.2025.06.02
Text of the scientific article An Innovative System for Daily Thunderstorm Event Prediction using Deep Learning
Bangladesh is a land of natural disasters and catastrophes. Almost every year, this country experiences a variety of natural disasters. Bangladesh has been experiencing long-term climate change for the past 25 years, with the country's average temperature rising by 1.5°C [1]. As a result, the frequency of natural disasters has also increased. Furthermore, Bangladesh's geographical location places it in an area prone to natural disasters such as storms, droughts, floods, and others [2]. Following tornadoes, flash floods, and hurricanes, thunderstorms and lightning injuries are the leading causes of weather-related deaths worldwide. The injuries cause significant long-term morbidity and high death rates [3]. Thunderstorms (TS) are dangerous localized meteorological events characterized by hail, squall lines, lightning, and heavy rainfall. They are mainly caused by strong air convection. The term "thunderstorm" refers to high winds (60-150 km/h) that can occasionally intensify and form tornadoes. Lightning is a byproduct of every thunderstorm. Thunderstorms occur almost everywhere on Earth as a result of atmospheric instability and intense convection caused by high moisture convergence. These are some of the most amazing atmospheric phenomena that affect people's lives. There are currently between 1600 and 2400 TS occurring globally [4]. Thunderstorms and lightning can have a wide range of effects on the environment, the economy, infrastructure, and human life [5-8]. Between 2010 and 2016, 1,476 people in Bangladesh died as a result of lightning.
According to the Ministry of Health and Family Welfare data, thunderstorms and lightning killed 120 people and injured 77 others in 2018. These incidents occurred only between March and June, with May recording the most fatalities and injuries at 68. Thunderstorms can cause significant damage to infrastructure [9], livestock, utility services such as electricity [10], crops [11], and the environment [12], among other things. Bangladesh's susceptibility to extreme weather, including thunderstorms, highlights the need for precise forecasting systems to reduce human and economic losses. Traditional forecasting methods may be ineffective in capturing Bangladesh's rapidly changing thunderstorm patterns, necessitating more sophisticated data-driven techniques. Accurate machine learning models can significantly mitigate the negative effects of thunderstorms. They did not provide location wise and accurate thunderstorm prediction results.
Accurate machine learning (ML) and deep learning (DL) models can significantly reduce the negative effects of thunderstorms by providing timely warnings and improving preparedness. To save people's lives and property, it is necessary to predict the daily thunderstorm events by taking into account not only specific time period and region but also changing weather conditions [9].
Thunderstorm prediction entails analyzing various meteorological parameters over time, including temperature, humidity, wind speed, atmospheric pressure, cape, convective inhibition, and k index. Traditional weather forecasting models such as Numerical Weather Prediction (NWP) and Convective Allowing Models (CAMs) frequently fail to capture the intricate interactions and dynamic patterns associated with thunderstorms, resulting in inaccurate predictions [9]. They also do not lend themselves well to long-term forecasting. The existing thunderstorm prediction research [9, 13-19] did not develop any intelligent machine learning-based system for daily thunderstorm prediction with high accuracy and location for Bangladeshi people by assessing a wide range of meteorological variables and local historical weather data. They also did not create an interactive daily thunderstorm prediction mobile application for Bangladeshi citizens that took into account specific location and date data.
To fathom the previous limitations, this work creates a high accuracy based location-centric intelligent system for daily thunderstorm prediction in Bangladesh using ML and DL models. This paper also develops a mobile application that uses ML and DL models to predict thunderstorms in real time and with actionable results. This paper also investigates machine learning and deep learning models for capturing complex nonlinear patterns and temporal relationships in thunderstorm data, resulting in more precise and reliable forecasts. A list of significant novel contributions to this work is provided below:
• This paper collects thunderstorm-related parameter data and produces a dataset that can be used to forecast daily thunderstorm events in Bangladesh. To improve the accuracy of the predicted results, this work attempts to incorporate several features into the thunderstorm prediction dataset, including convective rain rate, convective precipitation, evaporation, surface pressure, convective inhibition, thunderstorm probability (K index), total cloud cover, cape, dew point temperature, and wind components. Following examination, this paper implements a deep learning-based GRU model that predicts thunderstorms more accurately.
• This paper investigates several machine learning and statistical models such as ARMA, ARIMA, and SARIMA, as well as XGBoost ensemble methods and some deep learning models such as ANN, LSTM, and GRU, in order to select the best thunderstorm event prediction model.
• This work supplies an Android-based mobile application that can predict whether or not a thunderstorm will occur based on the number of probable lightning events. This paper also assesses the effectiveness of the proposed thunderstorm assistance mobile application by gathering citizen feedback through a Google survey.
2. Related Works
3. Proposed Model for Thunderstorm Prediction
Section 2 shows a comprehensive review of previous work on thunderstorm prediction. Section 3 issues the proposed machine learning-based thunderstorm prediction system. Section 4 holds the mobile app features for thunderstorm event prediction assistance. Section 5 shows the efficiency evaluation results for the thunderstorm event prediction assistance app. Section 6 captures the major summary of these paper as well as future study areas.
This section holds related literature works on thunderstorm prediction. In [9], the authors proposed a novel hybrid machine-learning model that combines ensemble decomposition (EEMD) with ANN and SVM to predict thunderstorms at various yearly frequencies. They demonstrated that their hybrid models outperformed other models at predicting thunderstorm frequency. The paper's limitations include the fact that the authors did not investigate the proposed models' performance for daily or hourly thunderstorm frequency prediction because they were only designed for monthly prediction. Furthermore, using only 11 input parameters may not include all of the relevant variables influencing thunderstorm frequency, potentially affecting the model accuracy.
The authors of [14] used 34 different meteorological stations in Bangladesh to develop the SARIMA model, a time-series modeling tool for projecting the total number of monthly thunderstorm days. The authors did not investigate any ML or deep learning models that might improve prediction accuracy over the conventional model (SARIMA) used here for time series data prediction. They focused on monthly thunderstorm prediction rather than daily thunderstorm event prediction. In [15], the authors looked at ML models for weather forecasting in Bangladesh. Various regression algorithms are used, including SVR, linear regression, XGBoost, CatBoost, AdaBoost, KNN, and DTR. This paper's limitation is that the dataset only covers 2012-2018 and may not capture all weather patterns. Another limitation of this paper is that they did not investigate thunderstorms or conduct a comparative analysis with machine learning and traditional statistical models.
In [16], the authors investigated whether an artificial neural network (ANN) can improve convective initiation (CI) forecasting by combining NWP output and micro scale satellite data. In this study, they assumed that no matter how many lightning events occurred, there would be thunderstorms. The authors of the study [17] used the AWR prediction model, a statistical model, to predict thunderstorms based on rainfall data. The limitation of this paper is that they did not look into the machine learning model or other parameters that have a direct impact on thunderstorms. The authors of [18] use linear regression and LSTM models to predict summer temperatures in Seoul, Korea, between 2013 and 2017. The authors did not investigate the LSTM model's suitability for thunderstorm prediction, which is a limitation.
The authors of [19] compared the performance of GRU and XGBoost algorithms in predicting weather patterns using regression and classification methods. In regression tasks, XGBoost outperformed GRU at first, but GRU performed better later stages. In classification tasks, GRU had a higher F1 score and contextual accuracy, making it more effective at predicting rainfall. However, they did not look into any models for daily thunderstorm prediction.
As previously discussed, existing works had a number of limitations. The limitations include a limited scope of daily predictions, lower accuracy due to fewer input parameters, and no real-world implementation of the work. Furthermore, some studies have not considered deep learning and sophisticated machine learning models, which could improve prediction accuracy. To address these issues, this paper presents an intelligent thunderstorm prediction system that uses larger datasets, investigates daily prediction models, and combines advanced machine and deep learning techniques with mobile applications. This improves the accuracy and reliability of thunderstorm frequency predictions, resulting in better preparedness and mitigation of the effects of severe weather events.
Section 3 of this paper will provide an overview of how we developed the model that predicts the likelihood of thunderstorms by predicting lightning events. Detailed instructions for data collection and cleaning have also been provided. In addition to the prediction model steps, this section went over the proposed thunderstorm assistance mobile application features.
-
3.1. System Model
-
3.2. Data Collection, Dataset Preparation, and Parameters Description for Prediction Model
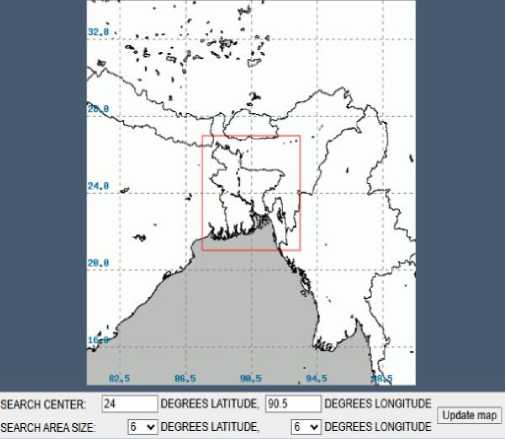
Data collection was the first and most important task for our prediction model. We used a space-time domain search to collect data on lightning events from both the Bangladesh meteorological department and the NASA global hydrological resource center [20]. Both sources have data from 1998 to 2022. We collected the data using a bounding box that covered the entire Bangladesh. Figure 3(a) depicts the data collection for lightning events in the Bangladesh region. The parameters Data are collected from the Copernicus climate change services (CCCS) website [21]. We collected 14 parameters related to thunderstorms from this site, which are: cape (convective available potential energy), total precipitation, convective inhibition, convective precipitation, convective rain rate, evaporation, K-index, surface pressure, total cloud cover, and totals index, wind components at 10 m U and V, 2 m dew point temperature, and 2 m temperature [9, 12, 21, 22]. These parameters have a direct and indirect impact on thunderstorm formation [23, 24]. All of the parameters were in raw NetCDF format, and they were downloaded from the CDS API, as shown in figure 3(b).
Figure 1 shows the methodology diagram for the thunderstorm prediction model. The first step in the process is to collect data on various thunderstorm-related parameters. The information was gathered from reliable international sources. After the data has been correctly combined, data cleaning is performed to eliminate any missing information and prepare the data for analysis. The best prediction model, GRU, was chosen after a comparative examination of various ML and DL algorithms (e.g., ARMA, ARIMA, SARIMA, SVM, LSTM, GRU, XGBoost, and ANN). The best thunderstorm prediction model is chosen by examining various error metrics, including RMSE, MAPE, and MAE, as well as R2 performance metrics.
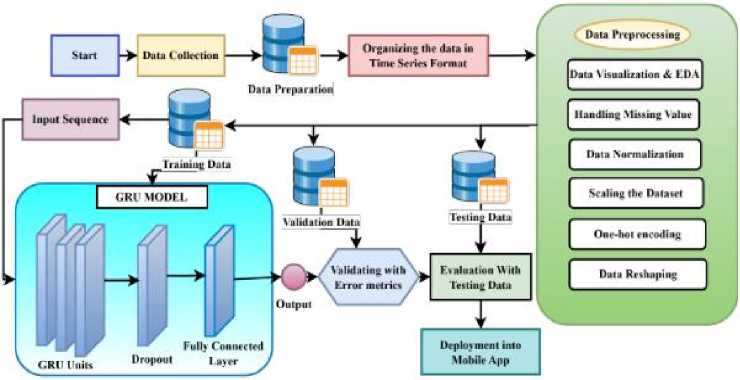
Fig.1. Methodology diagram for thunderstorm prediction model
The goal is to get the best accuracy possible from our chosen model when predicting the likelihood of a thunderstorm. Figure 2 depicts the system model for the mobile application that provides thunderstorm assistance. The mobile app is built with Flutter and the Flask API service platform. The mobile app is intended to provide users with accurate and timely thunderstorm predictions by combining advanced machine-learning models with real-time weather data. The app uses the FBprophet model to forecast various weather parameters, which are then stored in a database for later use. When users enter their district and desired date, the app retrieves the appropriate forecasted data and sends it to a Flask backend. GRU (Gated Recurrent Unit) model trained on historical weather parameters processes the data to make a thunderstorm prediction. This predicted value is then displayed to the user, indicating the likelihood of a thunderstorm as well as any necessary safety precautions. The following sections discuss various steps associated with the thunderstorm prediction model using machine and deep learning techniques.
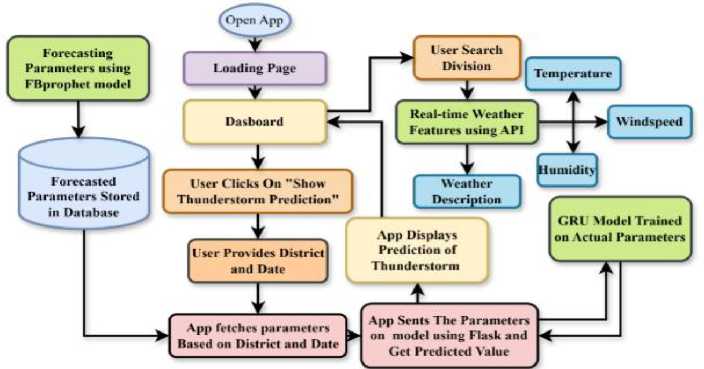
Fig.2. Mobile application workflow for thunderstorm prediction assistance
The parameter data were hourly data, which were then converted to daily data, with the average of the entire day calculated while converting the NetCDF format to CSV format, as the NetCDF format is extremely difficult to work with. The data from the aforementioned sources is reanalysis data, which ensures data quality, which is critical for achieving a good result in our prediction work. The raw data collected from lightning events and parameters is used to prepare the dataset for model training. First, we gathered the longitude and latitude coordinates for 64 districts in Bangladesh. Then we created a data frame with dates for each district from 1998 to 2022. For each day, we looked for the closest longitude and latitude. For each day, we searched the NetCDF file for the nearest longitude and latitude values, and the data frame was assigned the corresponding target parameter. The lightning event data was stored in CSV format. However, the longitude and latitude were scattered, making it difficult to sort by district location and date. So, to complete this task, we first preprocessed the data and removed any unnecessary columns. Then we had a data frame comparable to the parameter dataset. We found the nearest location for each district and date and added the Lightning Events value. If the date is not found in the file, the lightning event value is set to zero. Then this dataset is combined with the parameter dataset. Figure 4 shows a glimpse of our final thunderstorm event prediction dataset. Among the parameters, the K index value represents the likelihood of a thunderstorm forming. The K value is calculated using the temperature and dew point temperature in the lower atmosphere. The computation takes into account the temperature at 850, 700, and 500 hPa, as well as the dew point temperature at those pressures. Higher K values indicate a greater chance of thunderstorm formation. Figure 5 depicts the association between the k index parameter and thunderstorms [21].
a.
’reanalysis-eras-single-levels’,
{
'product_type*: ’reanalysis’,
’variable’: ’convective_available_potential_energy 'year': ’1998’,
’month': [
’01’, ’02’, ’03’,’04', '05', ’06’,’07’, ’08', ’09'
IB’, 1Г, 12',],
’day’: ['01', '02', '03','04', ’05’, '06',
|
'07', |
'08', |
'09','10', |
’ll'» |
12', |
|
’13', |
'14', |
15’,'16', |
’17', |
’18',’19’, ’20’, ’21’, |
|
*22’, |
’23’, |
'24’,’25 , |
'26', |
’27’,’28’, ’29’, ’30', |
31’,], time': |[ ’00:00', '01:00', '02 :00', '03:00' , '04:00', '05:00', '06:00','07:00','08:00',’09:00',’10:00’,'11:00', '12:00',’13:00',’14:00', 15:00-,'16:00','17:00', '18:00','19:00','20:00','21:00','22:00','23:00',],
’area’: [
27, 87, 21,
93,],
’format’: ’netcdf’,},
b.
Fig.3. a. Lightning events data collection for Bangladesh, b. Parameters data collection using API call for Bangladesh.
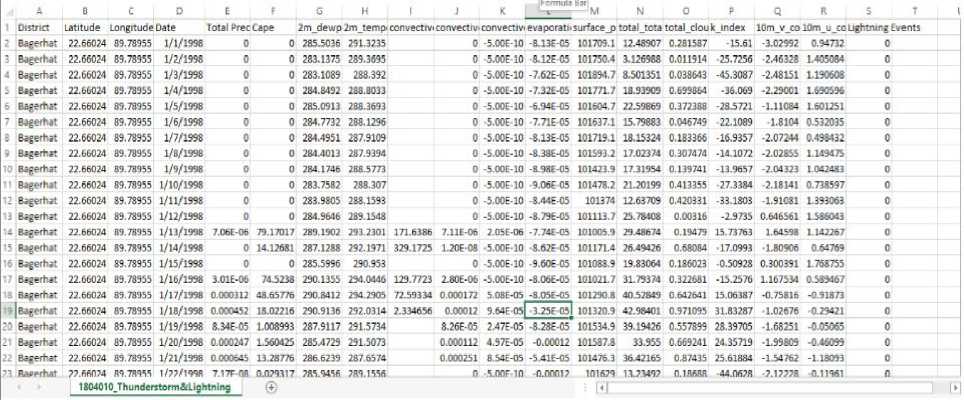
Fig.4. Final dataset for thunderstorm event prediction
|
К-Index Range |
Thunderstorm Activity |
|
Less than 20 К |
No thunderstorm |
|
20-25 К |
Thunderstorms are isolated |
|
26-30 К |
Thunderstorms arc widely spread |
|
31-35 К |
Thunderstorms are scattered |
|
Greater than 35 К |
Many thunderstorms |
Fig.5. Thunderstorm activity based on K index value
-
3.3. Data Preprocessing, Data Visualization, Feature Importance
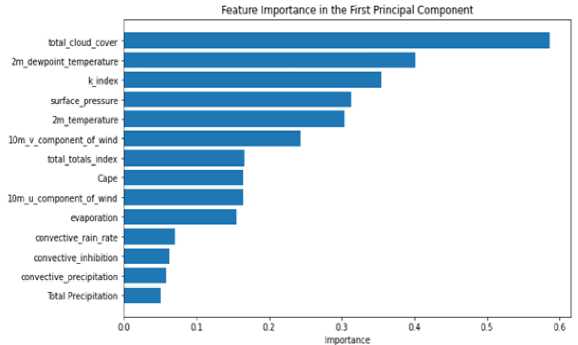
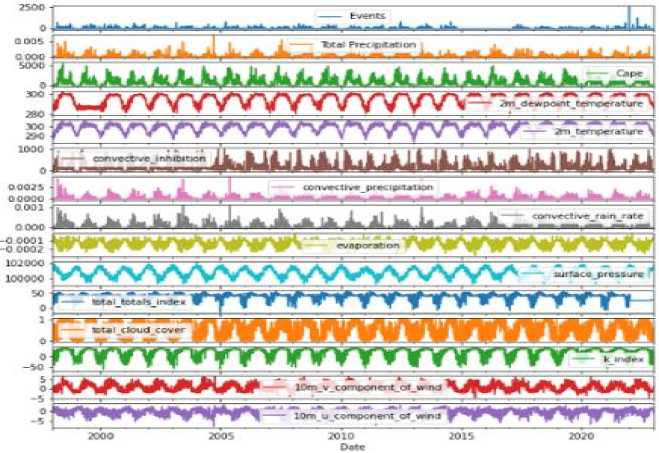
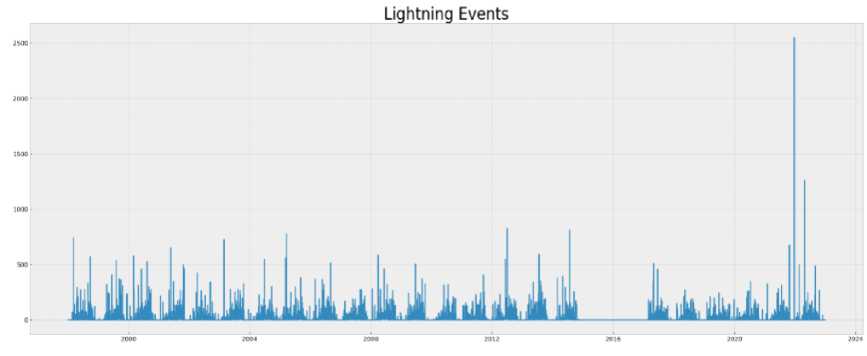
Data preprocessing is a necessary step before developing a model. Otherwise, the model may not function or produce consistent results. Our dataset contained null values. In this step, we removed the null values and cleaned up the data by removing the unnecessary column, as illustrated in Figure 6. We then use the Pearson correlation formula to determine the correlation between all of the parameters, as shown in Figure 7. Figure 8(a) shows how one hot encoding is used to transform the district column into numeric data. We then normalized the data. For all of the features in this sample, we used min-max feature scaling. It is a type of scaling in which points are shifted and rescaled until they fall between 0 and 1. The selected model is then given an input data sequence (for training and testing) by evaluating various machine and deep learning models. We have selected the best model for prediction by comparing different error and R squared values associated with machine and deep learning models. Figure 8(b) shows that sixty percent of the input data sequence is used for the training set, twenty percent for the validation set, and twenty percent for testing. We performed hyper parameter tuning using the grid search technique, as shown in Figure 9(a), to improve model accuracy and select the best parameters. Figure 9(b) depicts the feature-important results obtained while training the model using the PCA mechanism. Then, we'll talk about the data visualization aspect of our work. Matplotlib and Seaborn are Python packages used for data visualization. They include modules for generating various types of graphs. While Matplotlib is used to integrate graphs into applications, Seaborn is primarily used to generate statistical charts. We displayed the Dhaka district parameters over time because our dataset is multi-location and time series formatted. Figure 10 shows how thunderstorm event prediction parameters vary over time. Figure 11 shows a visualization of lightning events in the Dhaka district. The graph depicts a series of vertical bars, with the height of each bar representing the number of lightning events recorded over a specific time period, most likely a day or a series of days. The data appears to be cyclical or seasonal, with peaks and troughs occurring regularly throughout the years.
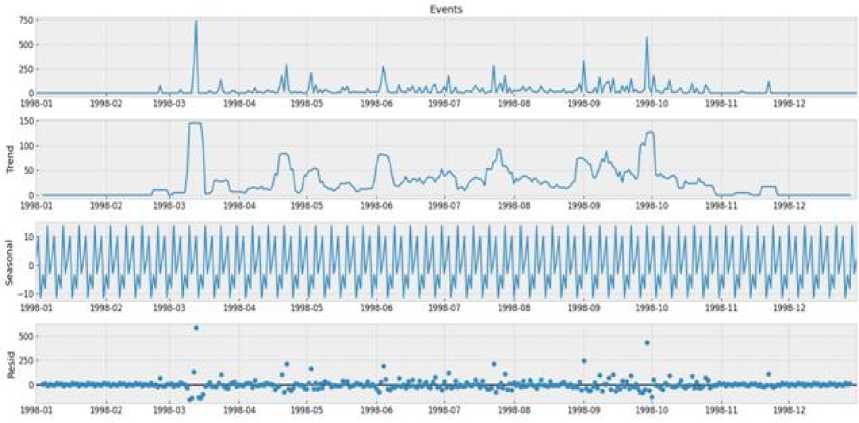
Peaks, represented by taller bars, indicate periods with a higher frequency of lightning events, whereas troughs, represented by shorter bars or gaps, indicate periods with few or no lightning events. Time series decomposition analysis improves comprehension and forecast accuracy by separating patterns from components. While additive decomposition is effective for fixed seasonal fluctuations, multiplicative decomposition is used when seasonal variations are proportional to the data level [25, 26]. By accounting for seasonal patterns and trends separately, both approaches improve model accuracy and facilitate sound analysis and decision-making. Figure 12 depicts the trend, seasonal, and residual patterns in the lightening events dataset's additive decomposition diagram.
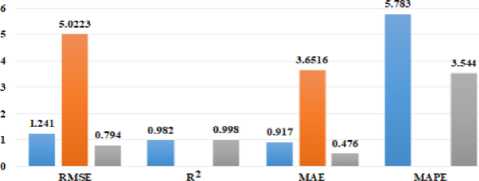
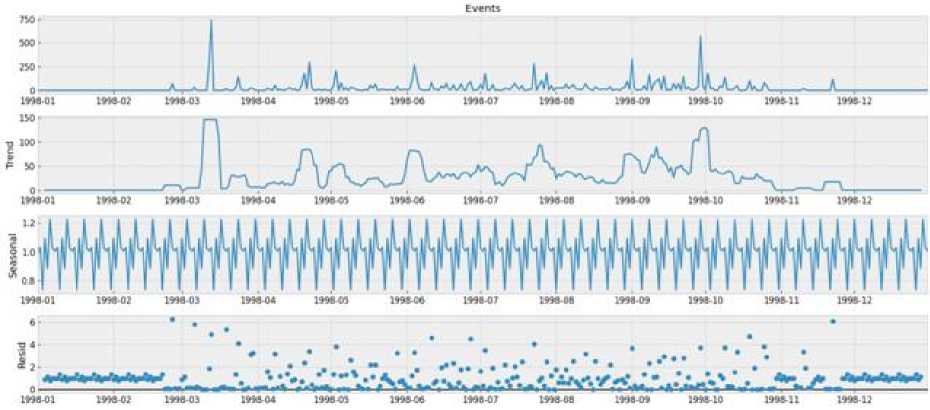
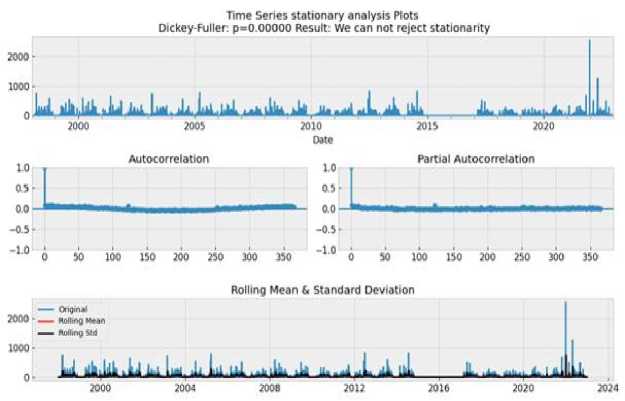
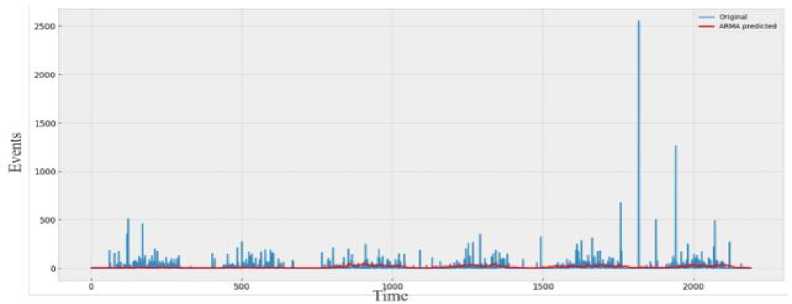
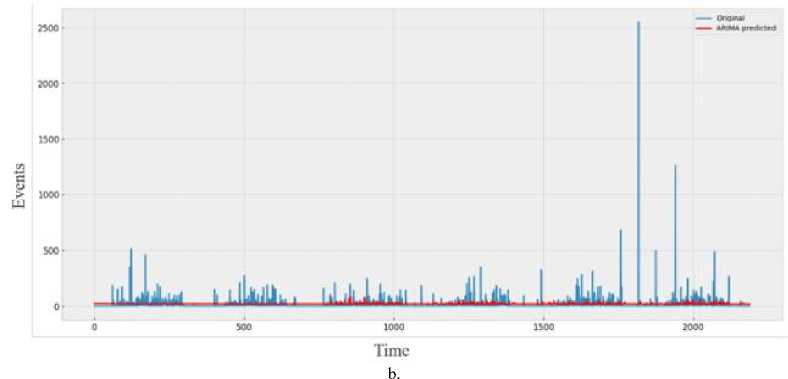
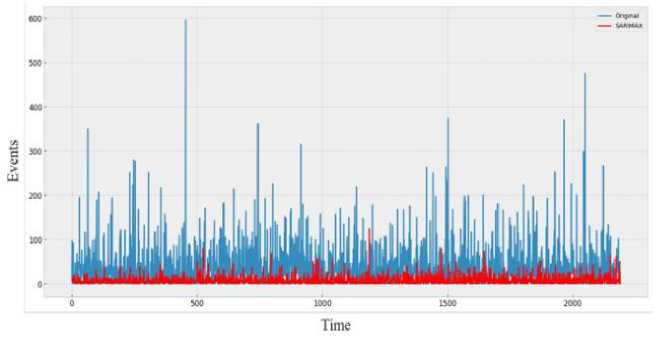
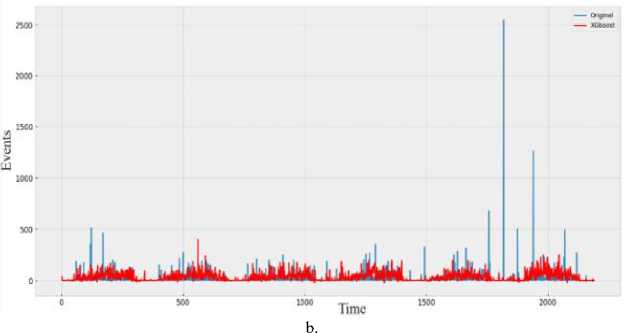
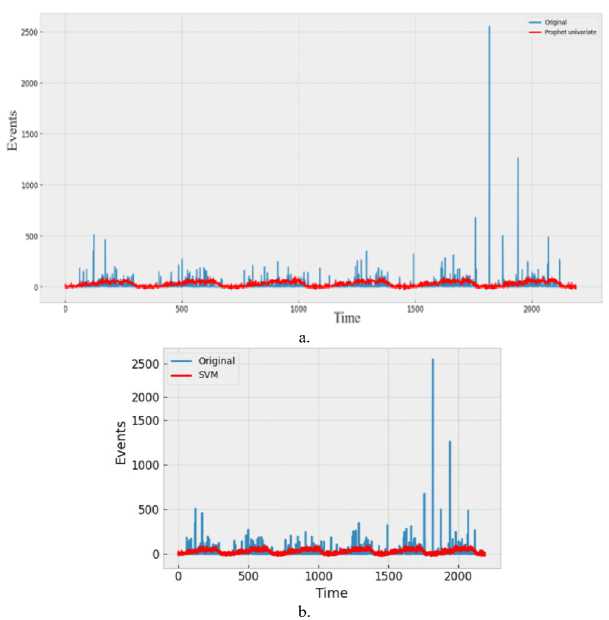
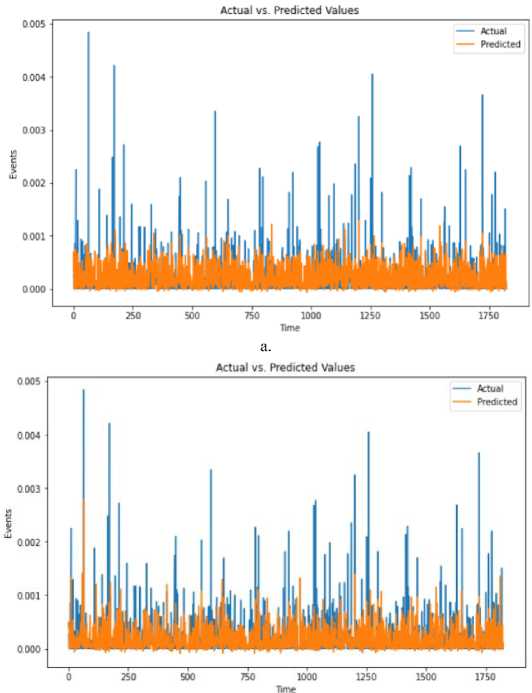
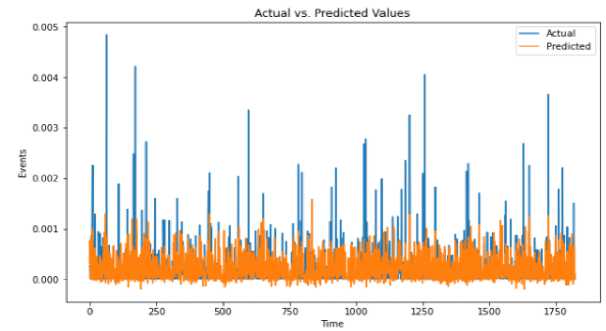
d»ta('Date* ] - p ■ Coluewi Non-Hull Count «Лур» 9 District 9133 non-null object 1 Date 9133 non-nul1 datet l*e«MJ n 2 Total Precipitation 9131 non nul1 fIoat44 3 Cape 9131 non-nuli float44 J» dewpoint tawparature «>>1 non-nuli fIoat 04 S ?■ temperature 913 3 non-nul1 Помва 6 convective Inhibition 9119 non-null ♦ loot64 7 convective prec Ipltat ion 9131 non -nul1 fIoat 64 a convective rain rate 9131 non-nul1 float64 evaporation 9111 non-null f‘oat 64 Id surf aca pre*sure 911! non-nul1 float64 11 total total* index 9131 non-nul1 f1oat64 12 total cloud cover 9131 non-null f1oat64 11 к Index. 9131 non-null float64 14 io* v component of wind 0131 non-null float64 1 Ош u cowpor-ant of wind 91 11 non-nulI floa'64 14 f vent * 9133 non-nulI intM Dtypes: 0.1«1^»*(п»)<1). По.1О*(И). Intent I), obj»ct(l) »WWO< -y usage: 1-2* MB Fig.6. Dataset cleaning (source code) Fig.7.Correlation among the parameters In [13]: free sklearn.preprocessing import OneHotEncoder 9 One Hot Encode the 'District' column encoder - OneHotEncoder() 9 Ho ’sparse' argument encoded_df - pd.OataFraee(encoded_events.toarray(), coluens-encoder.get_feature_naees_out((’District'J)) encoded_df OUtfilJ’ District DhaM 01.0 21.0 a. * Scaling data scaler - MMaxScaler(feature_range«(8, 1)) seq_length Зв 9 A coupon choice for tine series X, у - create_$equences(scaled_data, se^length) • Split in? data X_train_full, X_test, y_train_full, y_test - train_test_$pllt(X, y, test_slzee.2, randoe_state-42) * Further split the training data into training and validation sets b. Fig.8. a. Performing one hot encoding in the dataset, b. Scaling, sequence creation, and splitting data 9 Defining the hyperparameters grid paramgrid - { '□nits': (32, 64, 128], 'dropout_rate': [0.2, 0.3, 0.4], 'learning_rate’: [0.001, 0.01, 0.1], batch_slze*: [16, 32, 64], 'epochs*: [50, 100] 9 Create GridSearchCV grid - GridSearchCV(estimator model, param_grid param_grid, cv-3, verbose 1) 9 Perform Grid Search grid_result grid.fit(X_train, y_train) 9 Summarize the results print(f"8est: {grid_result.best_score_] using {gridresult.bestparams}”) 9 Evaluate the best model b. Fig.9. a. Hyper parameter tuning, b. Feature importance in training the model Fig.10. Different thunderstorm prediction parameters vary from 1998 to 2022 in Dhaka district Fig.11. Lightning events from 1998 to 2022 in dhaka district Fig.12. Time series decomposition diagram (additive) Figure 13 shows our dataset's multiplicative decomposition results. This decomposition separates the original time series' trend, seasonal, and residual components (as shown in the top panel). The trend component (second panel) captures the data's long-term pattern or direction. The third panel, which represents the seasonal component, shows the consistent ups and downs that occur throughout the year. After adjusting for trend and seasonality, the residual component (fourth panel) represents random or unexplained variations. Our data must be stationary in order to build a stable model. To do so, we looked at the Augmented Dickey-Fuller or ADF test [26]. Figure 14 depicts the results of the ADF test, autocorrelation, partial correlation, rolling, and standard mean of the lightning events data, all of which confirm our dataset's stationarity. It is clear that our mean and standard deviation behave consistently over time; even when they fluctuate during the year, the pattern is maintained the following year. This once again establishes the stationary series. Fig.13. Time series decomposition diagram (multiplicative) Fig.14. Confirmation of stationarity in the dataset 3.4. Model Evaluation, Best Model Selection, and Comparison with Existing Works In this subsection, we evaluated the performance of various machine learning, deep learning, and statistical methods to select an appropriate model for thunderstorm event prediction. Figure 15(a) depicts a comparison of the original lightning event data with predictions made by an autoregressive moving average model (ARMA) [27]. The blue line depicts the original data, which has a highly irregular pattern with numerous spikes and peaks scattered across the time period. These spikes are likely to coincide with periods of intense lightning activity. The red line represents the ARMA model's predictions. It appears to capture the overall trend and distribution of the original data, but it smoothes out the extreme peaks and valleys, yielding a more consistent prediction. Figure 15(b) compares the original data to predictions made by an ARIMA model. The blue line shows the original data. The red line represents the ARIMA model's predictions. The ARIMA model, like the ARMA model, captures the overall trend and distribution of the original data, but smoothes out the extreme peaks and valleys, resulting in a more regularized prediction. Figure 16(a) compares the actual and predicted values of lightning events using the SARIMA model. The original data (blue line) displays a pattern that repeats over time, with several peaks and valleys, indicating the possibility of seasonal or cyclical components. The SARIMA model (red line) attempts to represent the seasonal fluctuations as well as the overall trend found in the original data. It appears to follow the overall pattern fairly well, but it occasionally deviates from the pattern. Figure 16(b) appears to compare the original data (shown in blue) to predictions made by an XGBoost model (shown in red), over time. Figure 16(b) shows that the XGBoost model [28] generally follows the shape and trend of the original data while smoothing out some of the extreme peaks and valleys. Despite the smoothing effect, the XGBoost model appears to be reasonably good at predicting the overall pattern and capturing larger fluctuations in the data. However, as with many forecasting models, it may struggle to accurately predict extreme events or outliers. Figure 17(a) plots the original data (blue) against predictions made by a Prophet univariate forecasting model [29] (red) over time. Overall, this graph indicates that the Prophet univariate forecasting model provides a reasonable approximation of the original data while accounting for patterns and seasonality and mitigating some noise and extreme variations. Figure 17(b) depicts the distribution of lightning events or data points over time, as predicted by the SVM model. The blue "Original" line depicts a series of spikes or peaks at different time points, indicating a recurring pattern or periodic events. The red "SVM" line appears to capture or model the recurring events with larger spikes at similar time intervals, which represent the original data. Figure 18(a) shows the actual (blue) and predicted (orange) values of lightning events from our time series data using an ANN model [30]. The actual values show a recurring pattern of peaks and troughs. The predicted values generally follow the same trend as the actual values. However, there are discrepancies between predicted and actual values. A closer alignment indicates improved forecasting performance. Figure 18(b) compares the performance of the LSTM model in predicting actual (blue line) and anticipated (orange line) lightning incidents from our time series data. The actual values show a recurrent pattern of peaks and troughs. Forecast values generally follow the trend of actual values. However, there are discrepancies between expected and actual numbers. Closer alignment indicates better predictive performance. Figure 19 shows how well the GRU model performed in our time series forecasting by comparing the expected and actual event values. The projected values, shown in orange, follow a smoother pattern, reflecting the overall trend but not the extreme spikes, whereas the actual values, shown in blue, are highly variable with noticeable spikes. The GRU model produces results similar to the LSTM and ANN models, but it outperforms them. This suggests that the model accurately captures seasonal elements and underlying trends. Because of its effective architecture and update and reset gates that control information flow, the Gated Recurrent Unit (GRU) model has proven effective in dealing with longterm dependencies in sequential data. a. Fig.15. a. Prediction result of ARMA model, b. Prediction result of ARIMA model Fig.16. a. Prediction result of SARIMA model, b. Prediction result of XGBoost model Fig.17. a. Prediction result of FB prophet model, b. Prediction result of SVM model b. Fig.18. a. Prediction result of ANN model, b. Prediction result of LSTM model Fig.19. Prediction result of GRU model Arad ef al «2021X9] EEMD-ЛХХ Islam «aL(2O21)[U] SARIXLA Proposed GRV b. Fig.20. a. Comparison of model performance metrics, b. Proposed GRU prediction model comparison with existing works a. b. Fig.21. Welcome screen of our app, b. Home page of our app with search, weather, temperature, wind speed, and humidity display option Fig.22. Thunderstorm prediction screen of our app, b. Thunderstorm warning and necessary suggestions page of our app b. Next, this paper assesses the suitability of various ML, DL, and statistical models using performance metrics such as R squared, RMSE, MAE, and MAPE error. The calculation regarding R squared (R2), RMSE, MAE, and MAPE are illustrated as follows: £2 = 1 4UM£ ^(■vso2 MAE^Z^-SJ(2) RMSE = ^|Ё'Ш — <(3) MAPE^Z^^(4) Where 8t, 8i, St, and N are observed value of variable at time i, predicted value of variable at time i, mean value of variable, and sum of all observation, respectively. Figure 20(a) compares the Root Mean Square Error (RMSE) values for different ML and DL models. RMSE investigates the differences between predicted and observed values. Traditional models such as ARMA, ARIMA, and SARIMA have the highest RMSE values, indicating lower accuracy, with ARMA and ARIMA both at 7.48 and SARIMA slightly better at 5.34. Moving on to machine learning approaches, SVM performs better with an RMSE of 4.56, while ANN reduces the error to 1.67. XGBoost, a powerful gradient-boosting algorithm, achieves even lower RMSE (1.34). FBprophet, which is specifically designed to handle time series data with strong seasonal effects, reduces the RMSE to 0.998. The most advanced models, LSTM and GRU, perform the best, with LSTM achieving an RMSE of 0.842 and GRU, with its simpler structure but effective handling of long-term dependencies, achieving the lowest RMSE of 0.794. This comparison shows that advanced neural network models, particularly GRU, perform better at minimizing prediction errors for the given time-series thunderstorm forecasting task. Figure 20(a) shows R-squared (R2) values for various time-series forecasting models; these values indicate the suitability of each model and predict the variance in the dependent variable. The GRU model performs the best, with an R2 of 0.998, followed closely by the LSTM at 0.989. The ANN model also performs well, with an R2 value of 0.9234. FBprophet achieves a strong R2 of 0.8372, while XGBoost has a moderate R2 of 0.67. The SVM model has an R2 of 0.577, indicating reasonable accuracy. Traditional models are less effective, with ARIMA at 0.364, SARIMA at 0.346, and ARMA at 0.294. This comparison shows that GRU and LSTM models have the highest predictive power, followed by ANN and FBprophet, with traditional models trailing behind. Figure 20(a) compares the mean absolute error (MAE) values of different time series forecasting models. ARMA has the highest MAE of 4.611, followed by ARIMA at 4.015. SARIMA performs better, with an MAE of 3.252. SVM and XGBoost have lower MAEs (1.34 and 1.089, respectively). Fbprophet has a mean absolute error of 0.823. The deep learning models ANN, LSTM, and GRU have the lowest MAEs (0.679, 0.499, and 0.476, respectively), with GRU being the most accurate of all models compared. The mean absolute percentage error is also known as MAPE. Figure 20(a) also shows the MAPE values for various models. With a MAPE of 50.667%, ARMA has the highest accuracy, while ARIMA is slightly better at 48.237%. With seasonality taken into account, SARIMA has a lower MAPE of 28.995%. The machine learning method XGBoost shows a significant improvement, with a MAPE of 10.928%. SVM and FBprophet further reduce MAPE to 7.34% and 6.123%, respectively. The deep earning models ANN, LSTM, and GRU have the least accuracy, with MAPE values of 5.899%, 3.67%, and 3.544%, respectively. The graph clearly shows that sophisticated machine learning and deep learning models outperform more traditional techniques such as ARMA and ARIMA. Figure 20(a) shows that the GRU model outperforms other models in terms of r-squared, MAPE, MAE, and RMSE, and thus is chosen for thunderstorm prediction. Figure 20(b) compares three hybrid machine learning models: the EEMD-ANN model by Azad et al. [9], the SARIMA model by Islam et al. [14], and our proposed GRU model. We used common predictive modeling metrics (RMSE, R2, MAE, and MAPE) to compare. The proposed GRU model consistently outperforms the EEMD-ANN in all metrics, implying higher prediction accuracy. It has lower error rates in RMSE (0.794 vs. 5.0223 vs. 1.241) and MAE (0.476 vs. 3.6516 vs. 0.917), comparable high data fit in R2 (0.998 vs. 0.982), and significantly better MAPE accuracy (3.544% vs. 5.783%). These findings show that the GRU model is more accurate and better fitted to the data, with a particularly significant improvement in percentage accuracy terms.
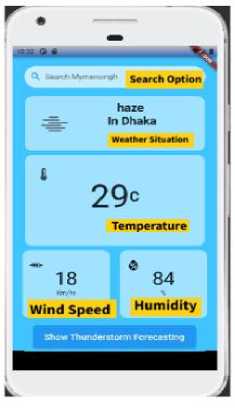
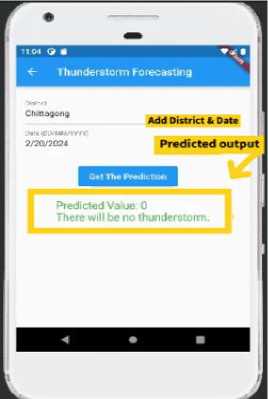
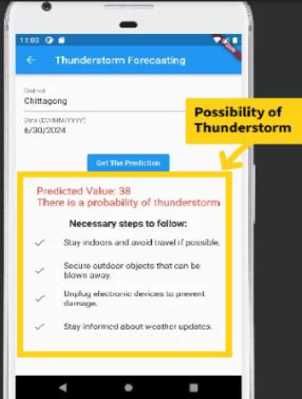
4. Proposed Thunderstorm Assistance Mobile Application This section presents the proposed thunderstorm prediction assistance mobile application features. Figure 21(a) depicts the welcome page for our mobile application. Figure 21(b) illustrates the application's home page, which includes several of its features. It includes a search function, a weather condition module, a temperature module, a wind speed module, a humidity module, and a link to the thunderstorm prediction page. Figure 21(b) depicts the search functionality of our application, which allows users to easily enter their desired location. Once the location is entered, the application provides detailed weather updates for that area. Users can view real-time data such as temperature, humidity, and forecast information. Figure 21(b) depicts the button for accessing the thunderstorm prediction page. This feature enables users to see detailed forecasts of potential thunderstorms. Figure 22(a) depicts the thunderstorm prediction page, which allows users to enter their district location and date. This allows them to see detailed thunderstorm forecasts for their specific location. Figure 22(a) shows that there is no chance of a thunderstorm occurring on the specified date and location. It also indicates that the number of likely lightning events is zero by examining the district and date information. Figure 22(b) depicts the likelihood of a thunderstorm occurring on the given date and location. It also indicates how many lightning events are likely to occur. This feature allows users to anticipate and prepare for potential severe weather conditions. By providing detailed probability and lightning event data, it improves user awareness and safety. Figure 22(b) also shows the necessary steps for a thunderstorm event. Fig.23. Quality evaluation of our app Table 1. Proposed mobile application necessity assessment result (150 user survey) Criteria Excellent Just average Not ok Developed Features are excellent and useful 65% 20% 15% Proposed application can assist users regarding thunderstorm prediction 55% 35% 10% App design, flexibility, navigation, cost wise beneficial 55% 30% 15% Provide security, reliability, can tackle future challenges 60% 25% 15%
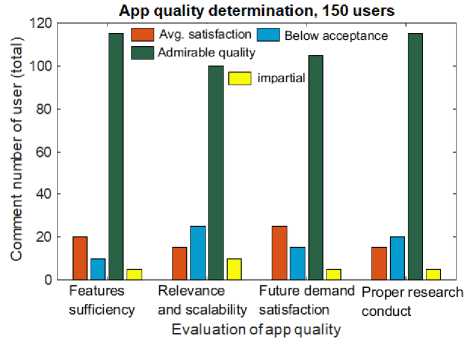
5. Evaluation Results This section offers the mobile app features evaluation results. Figure 23 depicts the app quality evaluation of our thunderstorm assistance application. We examined the evaluation results by collecting responses from 150 users through a Google form. The app quality factors include feature sufficiency, app relevance and scalability, future demand satisfaction, and proper research before app development. Based on the collected user comments about the examined factors, we discovered in figure 23 that the admirable quality response (vote range 100-115), average satisfaction (vote range 15-25), below acceptance (vote range 10-25), and impartial responses (vote range 05-10) secured first, second, third, and fourth place, respectively. Table 1 depicts the application's necessity evaluation results. The issues investigated include feature usefulness, real-time applicability for thunderstorm prediction, design, cost, flexibility, reliability, and future issues. Table 1 clearly shows that for all issues, user excellent responses about the app's necessity took first place, with a vote range of 55 percent to 65 percent. The just average comment about the app necessity evaluation came in second (with 20 to 35 percent of the vote), while the not-so-good comment came in third (with 10 to 15 percent of the vote).
6. Conclusions This paper initiates the development of a daily location-centric thunderstorm prediction system with improved accuracy by leveraging a large weather dataset and advanced predictive models. We used a comprehensive dataset spanning 24 years (1998-2022) and covering 64 districts in Bangladesh. This extensive data collection, which includes a diverse set of meteorological variables and derived indices, provides a solid foundation for accurate predictions by capturing the complex interplay of factors that contribute to thunderstorm formation. To select an appropriate thunderstorm prediction model, we investigated a variety of machine learning models, deep learning models, and traditional statistical methods such as LSTM, ANN, ARIMA, SARIMA's XGBoost, SVM, and the ARMA model. We discovered that the GRU model comes out as a best thunderstorm prediction model. The proposed GRU model outperforms other machine learning and statistical models, with an RMSE of 0.794, R2 of 0.998, MAE of 0.476, and MAPE of 3.544%. This research also created a mobile application that provides accurate and localized thunderstorm predictions using the GRU deep learning model and a large weather dataset. According to the app necessity assessment results, more than 55 percent of users gave the proposed application positive feedback. Based on review results, it can be said that the customers are satisfied with the proposed high accuracy and location based thunderstorm prediction system and mobile application. The presented work could be helpful for people to detect thunderstorm event information in disaster prone areas. Future work could include expanding coverage to smaller areas, such as villagelevel thunderstorm prediction. In the future, rather than just predicting thunderstorm occurrences, this paper will attempt to predict multiple aspects such as storm intensity, duration, or specific risks (e.g., hail, tornadoes) using a multi-task learning setup. Based on user feedback, additional features such as push notifications for impending storms or integration with other apps (e.g., calendars, maps) may be added to improve the user experience. Edge computing techniques can be used to deploy lightweight versions of the models on users' devices, resulting in faster, and more localized predictions. Given the longterm dataset, this study is uniquely positioned to investigate how thunderstorm patterns have evolved over the last 24 years. This could provide valuable information about the effects of climate change. To enrich the predictive models, in future, we will try to integrate data from other domains such as satellite imagery, radar data, or even social media (e.g., user-generated storm reports). Partners with local governments or businesses can use the proposed thunderstorm prediction system to plan for long-term resilience, such as improving drainage systems or upgrading power grids in areas prone to frequent thunderstorms. In future, some other issues need to be investigated like expanding the model for other weather events, incorporating additional environmental variables, improving public safety, and disaster preparedness by using advanced block chain, reinforcement learning, robotics, and IoT technology, among others.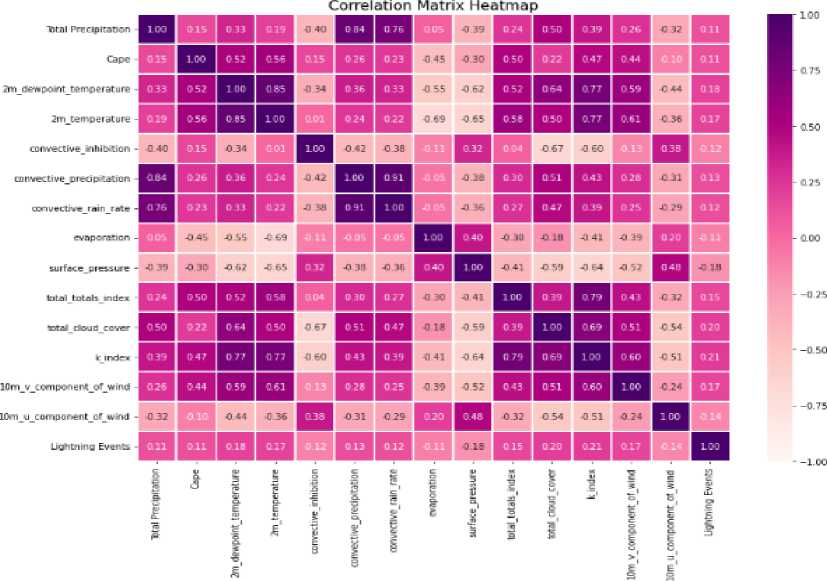
Model
RMSE
R2
MAE
MAPE
ARMA
7.188
0.291
4.611
50.667
ARIMA
7.477
0.361
4.015
48.237
SARLMA
5.344
0.346
3.252
28.995
Xgboost
1.34
0.67
1.089
10.928
SVM
4.56
0.577
1.31
7.34
Fbprophct
0.998
0.8372
0.823
6.123
ANN
1.667
0.9234
0.6879
5.899
LSTM
ii.s 12
0.989
0.499
3.67
GRU
0.794
0.998
0.476
3.544
a.