An Integrated Approach using Loss Sensitivity Factor and Whale Optimization Algorithm for Distributed Generation Allocation

Author: Sakthidasan A., Senthil Kumar M., Jovin Deglus, Sabarish P., Rajakumar P., Sundar R.
Journal: International Journal of Information Technology and Computer Science @ijitcs
Article in issue: 2 Vol. 17, 2025.
Free access
The incorporation of distributed generation (DG) in radial distribution systems (RDS) has recently garnered much attention. The prime goal of DG integration is to generate power locally and cut down the total power losses (PL) of RDS to increase the overall efficiency. The present work suggests a hybrid optimization approach integrating loss sensitivity factor (LSF) with a whale optimization algorithm (WOA) to optimize different categories of DG. The LSF locates the ideal site, and WOA optimizes the size. The present study optimizes DG units to minimize the total active power losses (APLT) and enhance the bus voltages (BV). The present work investigates the adaptability of the proposed integrated technique on the small 33-bus and a large 118-bus RDS. The APLT of the 33-bus RDS is minimized from 210.98 kW to 101.3 kW, 124.3 kW, 64.56 kW, and 86.5 kW for Type I, Type II, Type III, and Type IV DG placements, respectively. Correspondingly, the minimum bus voltage (BVmin) is increased from 0.9038 p.u. to 0.9511 p.u., 0.9503 p.u., 0.9608 p.u., and 0.9579 p.u. Likewise, significant PL reduction and bus voltage enhancement are obtained in 118-bus for three units of Type I and Type III DG placements. Further, the adequateness of the hybrid technique is examined for varying power demand on the IEEE 33-bus RDS. The integrated technique effectively narrows the search space of the optimization problem and helps the WOA to find the optimal solution. The simulation outcomes are compared to examine the sovereignty of the proposed optimization technique.
Distributed Generation, Power Losses, Optimization Algorithm, Distribution System
Short address: https://sciup.org/15019811
IDR: 15019811 | DOI: 10.5815/ijitcs.2025.02.06
Text of the scientific article An Integrated Approach using Loss Sensitivity Factor and Whale Optimization Algorithm for Distributed Generation Allocation
Electricity customers are powered from a centralized power station through a transmission and distribution power network (DPN). The DPN experiences more power losses, voltage drops and instability problems than the transmission power network because of its unique structure and higher R/X ratio. This scenario worsens more if the load demand on the RDS increases beyond the thermal limit. Recently, the researcher's focus has been increased toward DG allocation to minimize the level of the aforementioned problems in RDS. DG placement has emerged quite dramatically due to its distinctive ability to produce electrical power locally at the point of consumption [1]. Optimized inclusion of DG minimizes the power losses significantly since it does not require power transmission lines to transfer power to the customers. Besides, DG placement offers several technical benefits including enrichment in bus voltage, improved system stability and increased system reliability. However, appropriate choice of site and size for DG is essential to achieve the above-said benefits, since inappropriate integration of DG can result in unfavorable outcome.
Numerous DG optimization studies were implemented using different techniques to quantify the benefits of optimal DG placement. The DG's locations and sizes were optimized to achieve single and multiple objectives. An analytical optimization methodology was executed in [2] to locate the optimal position and size of the DG unit for total active power loss (APL T ) minimization. A simple iterative methodology using the Newton Raphson (NR) power flow (PF) algorithm was introduced in [3] to optimize the DG site and size. The authors [4] have applied analytical technique to optimize DG units and capacitors for APL T minimization. Grey Wolf Optimization (GWO) algorithm has been executed in [5] to optimize the type-I and type-II DG in RDS. An integrated optimization approach has been proposed in [6] for simultaneous DG allocation and network reconfiguration considering a multi-objective function. This integrated technique was formed by combining Bat and Shuffled Frog Leaping algorithms. The discrete ABC algorithm is successfully applied in [7] for simultaneous DG allocation and network reconfiguration to curtail the APL T . A Backtracking Search Algorithm (BSOA) [8] and Ant Lion Optimizer [9] algorithms have been applied to optimize DG in the different RDS. Genetic algorithm (GA) was proposed ad applied to optimize DGs into RDS to cut down the APL T [10].
Despite optimizing the DG units, the analytical methods take more time for optimal convergence and provide inaccurate results for a complex and large optimization problem. Likewise, optimization algorithms presented in the literature, such as GA, ABC, ALO, BSOA, and GWO, often prematurely converge and become trapped in a local optimal solution. Moreover, these algorithms take more time for convergence since they explore the entire search space of RDS. Thus, in this work, a unique optimization technique is proposed, combining the advantages of the LSF and WOA to discover the ideal site and size for the DG unit. The inclusion of LSF not only identifies the potential bus location for DG placement but also narrows down the search space of RDS effectively. This allows the WOA algorithm to focus only on the potential buses to find the optimal solution at a significant convergence rate.
The contribution of the present work is listed below:
• Investigates the efficacy of the LSF-WOA integrated approach for distinct types of DG allocation.
• Realizes the simulation study on the 33-bus and 118-bus RDSs to evaluate the applicability of the integrated technique.
• Validates the adequateness of the proposed LSF-WOA technique for varying load demand.
• Correlates the simulation findings with other population optimization techniques to investigate the effectiveness of the proposed integrated technique.
2. Distributed Generation
The present work is presented as different sections. Section 2 outlines the DG approach; Section 3 defines the objective function and relevant constraints; Section 4 explains the proposed LSF-WOA hybrid technique with adequate modelling expressions; Section 5 details the simulation findings for distinctive types of DG allocation; and Section 6 summarizes the significant findings of the present study as a conclusion.
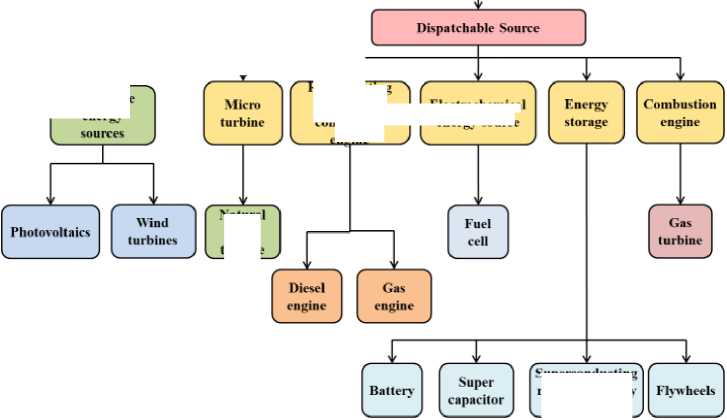
DG is a unique power generation approach where the power can be produced at the point of the load. Different resources are used as DG sources, as illustrated in Fig. 1. Further, DG is grouped into four categories [11] as highlighted in Table 1.
Table 1. DG categories
|
Type |
Characteristics |
Power factor (p.f.) |
Example |
|
Type I |
Produce only active power (AP) |
1.0 |
PV and MT |
|
Type II |
Produce only reactive power (RP) |
0 |
Synchronous compensator |
|
Type III |
Produce AP and RP |
0 < p.f. < 1.0 |
Synchronous generator |
|
Type IV |
Produce AP but consumes RP |
0 < p.f. < 1.0 |
Wind turbine |
Distributed Generation
_______ Sources _______
Non-Dispatchable Source
Renewable energv
natural
Ras turbine
Superconducting magnetic energy storage
Reciprocating internal combustion engine.
Electrochemical
energy source
Fig.1. DG resources
3. Objective Function Modelling
The present study is intended to optimize DG to minimize APL T and improve bus voltages (BV) of RDS. The objective function (F) for the multi-objective DG optimization problem is expressed in (1).
F = min( ^ i f i + ^ 2 f 2 )
Where, f 1 corresponds to the objective function (OF) of APL T minimization and f 2 is the objective function for BV enhancement. Φ 1 and Φ 2 are the weightage factors.
Equations (2) and (3) give the expressions for ‘f 1 ’ and ‘f 2 ’.
f 1 =
APL T ( afterDG ) l APL T ( withouDG )
f 2 = max ( K i - V m ) (3)
Where, ‘V 1 ’ and ‘V’ are the BV of the reference bus and load bus, respectively. The mathematical expression for the APL T of RDS is given in (4).
n - 1
APL t = ^ R m , m + 1 m = 1
' P m 2 + Q m 2
l Ы2
Where, ‘n’ relates to the number of buses, ‘m’ is the bus number, ‘R’ denotes resistance, ‘P’ and ‘Q’ are the AP and RP loads, ‘P DG ’ and ‘Q DG ’ are the AP and RP ratings of a DG unit.
-
3.1. Operating Constraints
The multi-OF is minimized in line with several operating constraints, including voltage magnitude, feeder current, and power flow, as given below.
-
A. Bus Voltage Constraint
0.95
p
.u
<
V
m
<
1.05
p
.u (5)
The BV must be kept inside the recommended minimum and maximum voltages as given in (5).
-
B. Thermal Constraint
The optimized solution must keep the line current (I) below the maximum current (I max ) transfer limit. Equation (6) gives the thermal constraint.
I m , , m + 1 < I m , m + 1(max) (6)
-
C. DG Power Generation Constraint
The AP and RP ratings of the optimized DG unit should not violate the specified minimum and maximum capacity. In the present study, DG rating is optimized between 10% (minimum) and 80% (maximum) of total power load. The mathematical expressions for DG power ratings are presented in (7) and (8).
minmax
PDG < PDG < PDG
QDG < Qdg < QDG(8)
-
D. Power Balance Constraint
The net AP and RP injection, including DG rating, should not be greater than the connected load, including power losses. Equations (9) and (10) present the active and reactive power balance constraints.
n
P s + P dg < X pm + APL t (9)
m = 1
n
Q s + Q dg < E Q m + RPL t (10)
m = 1
Where, ‘P s ’ and ‘Q s ’ relate the active and reactive power supply, RPL T is the total reactive power losses.
-
3.2. Power Flow
The power flow (PF) is an important aspect of power system networks for assessing their performance. However, the popular PF methods such as Gauss-Seidel and Newton Raphson become ineffective for RDS due to their unique structure and larger number of buses [12]. Hence, the BFS algorithm-based PF method is implemented in RDS to compute line flows, bus voltages, and power losses. The BFS algorithm solves the PF problem in two steps: (i) Forward sweep and (ii) backward sweep.
-
A. Forward Sweep
In a forward sweep, the BVs are calculated. The calculation is initiated from the first bus to the far-end node. Initially, the all the BVs are assumed to be 1 p.u.
B. Backward Sweep
4. LSF-WOA Integrated Approach
4.1. Loss Sensitivity Factor for DG Placement
In a backward sweep, the current through all branches is computed. Here, the calculation begins from the far end branch of the test system and proceeds in a backward route to the head node. Fig. 2 illustrates the flowchart of the BFS algorithm.
The ideal site for DG placement is determined using LSF. The prediction of bus location using LSF significantly reduces the search space for the WOA and helps to converge faster. The mathematical equation for LSF is given in (11).
. 2 Q m + 1, eff R m , m + 1
LSF m , m + 1 = ' "t
| V m + 112
The flowchart for identification of optimal bus for DG assimilation is illustrated in Fig. 3.
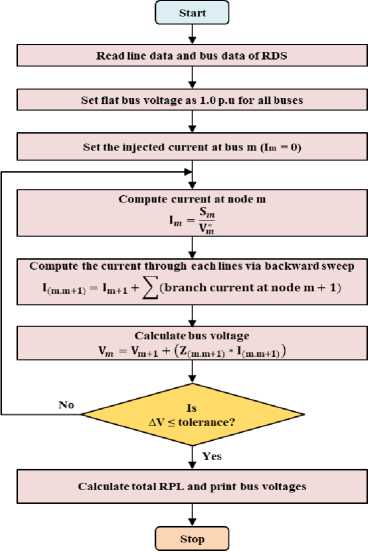
Fig.2. Flowchart for BFS algorithm
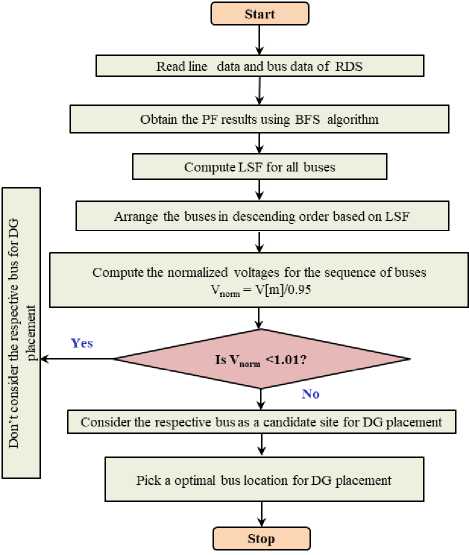
Fig.3. Flowchart for optimal bus selection
-
4.2. Whale Optimization Algorithm
Hof and Van Der Gucht are the scientists who discovered that whales have brain cells that are similar to human cells and also outnumber human cells count [13]. The whale, especially the humpback type, uses these cells effectively in hunting behavior. Such behavior is termed a bubble-net feeding technique and is mathematically modeled in two stages [14].
-
A. Prey Searching and Encircling of Prey
The whale’s ability to search for food (known as prey) is represented using (12) and (13):
D = \C * X rand - X (12)
X ( t + 1) = Xmn d - A * D (13)
The coefficient ‘A’ is used to find the distance between the present location (whale) and the best solution (elite), and ‘D’ points out the distance of the whale from the present location to the elite solution.
The mathematical expression for coefficient ‘A’ is given in (14).
A = 2 * a * r - a(14)
C = 2 * r(15)
If A<1 , then
D = |C * X *( t) - X (t )|
X (t +1) = X *( t) - A * D(17)
For ‘ A≥1’ , (12) and (13) exemplify the whale’s random search for food. Whereas, for ‘ A<1’ , (16) and (17) represent the encircling of prey. This process is termed a shrinking mechanism, and it characterizes the attacking nature of whales after having found the prey.
-
B. Spirally Updating Position
-
4.3. Implementation of Proposed Methodology
The position of hunter is updated using (18).
X(t + l) = [ X'(t) - A * D if P < 0^ (18)
[ D * e bl * cos (2nl) + X * (t) if p > 0 . 5
Where, ‘a’, ‘r’, ‘p’and ‘l’ are the random numbers, and ‘b’ is a constant.
The proposed integrated technique is implemented in various steps as described below.
Step 1) Feed the required bus and line data of RDS.
Step 2) Execute PF and compute line PL, BV, and LSF of RDS.
Step 3) Point out the optimal location for DG.
Step 4) Feed the optimal bus location and initialize the population = 30, max. iteration = 50, and DG size (search agent) boundary limits. If DG size goes beyond the specified bound, then its size is normalized within the limits.
Step 5) Compute the fitness value (F) for all search agents and find the best agent (initial).
Step 6) Update the values of ‘l, a, A, C, and p’ for every value of the search agent.
Step 7) If ‘p<0.5,’ then move to Step 8, or else move to Step 9.
Step 8) Replace the initial best agent if ‘ |A|<1’ . Otherwise, determine and update the search agent.
Step 9) Upgrade the search agent position.
Step 10) Print the result if a convergence criterion is reached. Otherwise, move to Step 5.
5. Test Results and Discussion
The proposed integrated method was realized on a 33-bus RDS and a large 118-bus RDS. The optimized outcomes were presented for different types of DG allocation. The necessary programming for the hybrid approach was encrypted and executed in MATLAB version 2020b.
-
5.1. IEEE 33 bus RDS: No DG placement
The one-line representation diagram of 33-bus RDS is presented in Fig. 4 [15]. The power flow (PF) is executed by taking 100 MVA-base power and 12.66 kV-base voltage. The APL T and RPL T are 210.98 kW and 143.12 kVAr, respectively. The test system with no DG has a minimum BV of 0.9038 p.u. In addition to this, LSF for the 33-bus RDS
-
5.2. IEEE 33 Bus RDS: After DG placement
is computed using PF results data to locate the ideal site for a DG unit. Fig. 5 presents LSF for the 33-bus RDS. The integrated technique identifies the 6 th bus as the optimal site for DG placement.
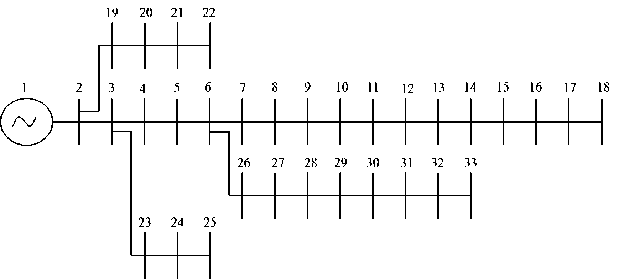
Fig.4. 33 bus IEEE RDS
The simulation findings for different types of DG allocation are presented in Table 2. Fig. 6 presents the BVs of the 33-bus RDS without and with DGs. Fig. 7 presents the convergence plot of WOA for distinct types of DG unit optimization.
-
A. Type I DG
Type I DG supplies only the active power at the point of integration. The hybrid technique optimizes the Type I DG for a 2436.5 kW rating in the 6 th bus of the test system. The APL T is minimized from 210.98 kW to 101.3 kW, and BV min is increased from 0.9038 p.u. to 0.9511 p.u. WOA takes 7 iterations and 18 seconds to optimize Type I DG.
-
B. Type II DG
Type II DG is modelled to inject only the reactive power at the point of integration. The integrated technique optimizes the Type II DG for an 1865.6 kVAr rating. WOA takes 8 iterations and 21 seconds to converge on the optimal solution. The optimal integration of type II DG reduces the APL T to 124.3 kW and increases the BV min to 0.9503 p.u. The simulation findings of this case DG placement are not superior to type I DG placement findings but are better than no DG placement results.
Table 2. Simulation findings
|
Simulation Results |
After DG Placement |
|||
|
Type I |
Type II |
Type III @ 0.866 p.f. |
Type IV @ 0.866p.f. |
|
|
APL T in kW |
101.3 |
124.3 |
64.56 |
86.5 |
|
BV min in p.u. |
0.9511 |
0.9503 |
0.9608 |
0.9579 |
|
Optimal bus location |
6 |
6 |
6 |
6 |
|
Optimal size |
2436.5 |
1865.6 |
2354.8 |
2199.65 |
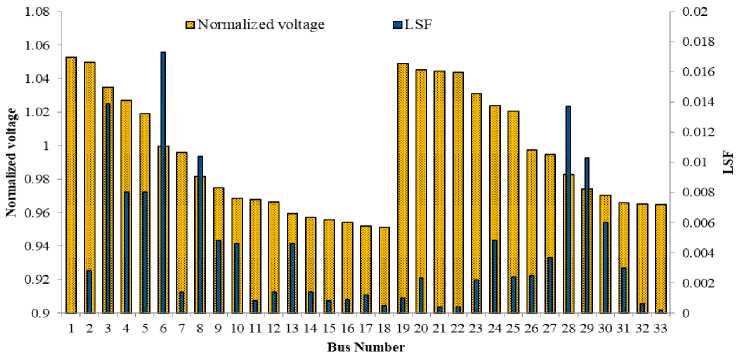
Fig.5. LSF for IEEE 33-bus RDS
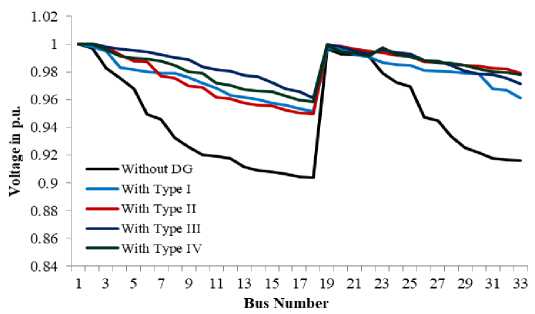
Fig.6. BV of 33-bus RDS prior and after DG placement
---Type I DG
----Type II DG
----Type III DG
---Type IV DG
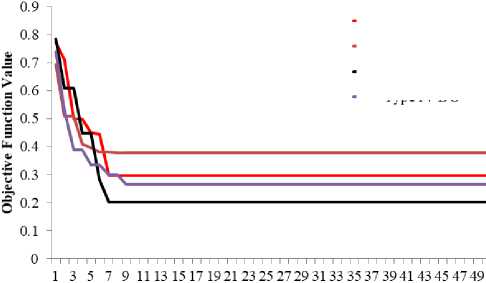
Iteration Number
Fig.7. Convergence curve of WOA for different DG placement
-
C. Type III DG (@ 0.866 p.f Leading)
Type III DG generates both active and reactive power. The integrated technique optimizes the Type III DG for a 2354.8 kVA capacity. APL T is minimized to 64.56 kW, and BV min is improved to 0.9608 p.u. following the Type III DG placement. Type III DG integration results in more PL reduction than Type I and Type II DG placements. Also, the BV min of the test system is enhances more than other cases of DG optimization. For Type III DG optimization, WOA takes 7 iterations and 24 seconds to converge on the best solution.
-
D. Type IV DG (@ 0.866 p.f Lagging)
-
5.3. Effect of Variable Loads
Load demand will not be constant over the year. In practical scenarios, load demand will vary with respect to seasonal variation. Hence, it is important to test the effectiveness of the proposed integrated technique for a variable loading condition. The load demand of the 33-bus RDS is increased by 1.6 times the nominal value for simulating the variable load demand. Now, the AP and RP load demand of the test system is increased from 3720 kW to 5952 kW and 2300 kVAr to 3680 kVAr, respectively. The simulation findings of the LSF-WOA integrated technique for the 33-bus RDS with peak load demand are presented in Table 3. Without DG placement APL T is 603.36 kW and BV min is 0.8360 p.u. However, the APL T is minimized to 367.48 kW, 304.34 kW, 214.89 kW, and 245.54 kW after the integrated approach optimizes Type I, Type II, Type III, and Type IV DG, respectively. Consequently, the magnitude of BV min increases to 0.9568 p.u, 0.9560 p.u, 0.9665 p.u, and 0.9636 p.u. following Type I, Type II, Type III, and Type IV DG placement, respectively. Maximum favorable results are obtained for Type III DG placement, whereas the least
The LSF-WOA integrated approach optimizes the Type IV DG at bus number 6 with a 2199.65 kVA rating. The WOA converges to the optimal solution in 9 iterations and 20 seconds. The APL T decreases from 210.98 kW to 86.5 kW, and BV min is enriched from 0.9038 p.u. to 0.9579 p.u.
The optimal DG unit allocation via the suggested hybrid method has considerably improved the performance of RDS. The optimized placement of Type I, Type II, Type III, and Type IV DG has achieved 51.98%, 41.08%, 69.39%, and 59% of APL T reduction, respectively. Also, it is witnessed that Type III DG achieved maximum PL reduction and better BV enhancement compared to other DGs. This is due to the ability of Type III DG to provide reactive power support along with real power injection. Fig. 8 highlights the statistical outcome for different DG unit placements. For all types of DG optimization, the WOA only took less than 10 iterations to converge.
favorable results are obtained with Type I DG placement. The proposed integrated technique delivered an optimal solution for all types of DG integration and also showcased its effectiveness on a test system with variable load demand.
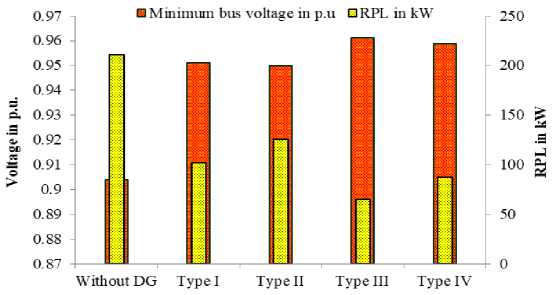
Fig.8. Statistical test result comparison for different DG placement
Table 3. Simulation findings of IEEE 33-bus RDS with varying load demand
|
Simulation Result |
Without DG |
Type I |
Type II |
Type III @ 0.866 p.f. |
Type IV @ 0.866p.f. |
|
APL T in kW |
603.36 |
367.48 |
304.34 |
214.89 |
245.54 |
|
BV min in p.u. |
0.8360 |
0.9568 |
0.9560 |
0.9665 |
0.9636 |
|
Optimal bus location |
- |
6 |
6 |
6 |
6 |
|
Optimal size |
- |
2656.4 |
2876.46 |
2676.8 |
2389.41 |
-
5.4. Comparative Study
The outcome of the suggested integrated methodology is compared to the result of analytical [4], BSOA [8], ALO [9], GA [10], LSF-SCA [16], SC [16], hybrid [17], heuristic [18], and TLBO-GWO [19] cited in the literature to investigate its efficacy level. Tables 4, 5, and 6 present the simulation findings of the proposed integrated approach and other techniques. The comparison is done based on APL T and BV min . The LSF-WOA integrated technique reduces the APL T of the test system by 51.98%, 41.08%, and 69.39% for Type I, Type II, and Type III DG allocation, respectively. However, the literature reports 47.37% for LSF-SCA, SCA, GA, and ALO techniques and 44% for BSOA to a type I DG placement. Likewise, LSF-SCA, hybrid, and analytical techniques have reported 28.25%, 28.17%, and 21.98% APL T reduction, respectively for a type II DG allocation. Furthermore, LSF-SCA, SCA, BSOA, and TLBO-GWO reported 67.84%, 67.85%, 60.76%, and 61.40% PL reduction for type III DG integration. It is evident from the above discussion that the proposed technique provides maximum PL reduction compared to the literature reports for all types of DG placements. Also, the maximum BV min increment is registered with the proposed integrated technique optimized DG placements.
Table 4. Simulation findings of integrated technique and other techniques for Type I DG optimization
|
Findings |
Proposed |
BSOA [8] |
ALO [9] |
GA [10] |
LSF-SCA [16] |
SCA [16] |
|
APL T in kW |
101.3 |
118.12 |
111.03 |
111.03 |
111.02 |
111.02 |
|
BV min in p.u. |
0.9511 |
0.9441 |
0.9424 |
0.9425 |
0.9424 |
0.9424 |
|
Optimal bus location |
6 |
8 |
6 |
6 |
6 |
6 |
|
Optimal size |
2436.5 |
1875.5 |
2590.2 |
2600 |
2590.21 |
2590.16 |
|
Percentage of APL T reduction |
51.98 |
44.00 |
47.37 |
47.37 |
47.37 |
47.37 |
Table 5. Simulation findings of proposed integrated technique and other techniques for Type II DG optimization
|
Findings |
Proposed |
Analytical [4] |
LSF-SCA [16] |
Hybrid [17] |
Heuristic [18] |
|
APL T in kW |
124.3 |
164.6 |
151.37 |
151.55 |
151.55 |
|
BV min in p.u. |
0.9503 |
0.9160 |
0.9165 |
NR |
NR |
|
Optimal bus location |
6 |
33 |
30 |
30 |
30 |
|
Optimal size |
1865.6 |
1000 |
1258.01 |
1230 |
1190 |
|
Percentage of APL T reduction |
41.08 |
21.98 |
28.25 |
28.17 |
28.17 |
Table 6. Simulation findings of proposed integrated technique and other techniques for Type III DG optimization
|
Findings |
Proposed |
BSOA [9] |
LSF-SCA [16] |
SCA [16] |
TLBO-GWO [19] |
|
APL T in kW |
64.56 |
82.78 |
67.85 |
67.85 |
81.43 |
|
BV min in p.u. |
0.9608 |
0.9549 |
0.9584 |
0.9584 |
0.9360 |
|
Optimal bus location |
6 |
8 |
6 |
6 |
30 |
|
Optimal size |
2354.8 |
1857.5 |
3105.75 |
3105.86 |
1000 |
|
Percentage of APL T reduction |
69.39 |
60.76 |
67.84 |
67.85 |
61.40 |
Table 7. Non-optimized and optimized solution of the large 118-bus RDS
|
Cases |
Optimal Sizes |
Optimal locations |
APL T in kW |
BV min in p.u |
No. of iterations |
CPU running time (Sec) |
|
No DG |
- |
- |
1296.3 |
0.8688 |
- |
- |
|
Type I DGs |
2122.4 1899.3 1398.7 |
71 69 70 |
530.4 |
0.9704 |
25 |
52 |
|
Type III DGs |
934.2 1736.5 1382.1 |
71 69 70 |
321.5 |
0.9765 |
28 |
59 |
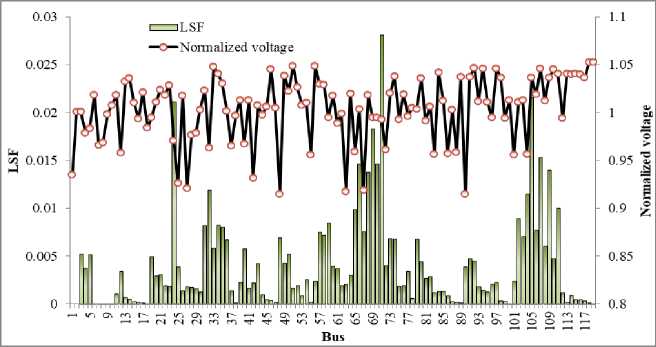
Fig.9. LSF and normalized voltages of IEEE 118-bus RDS
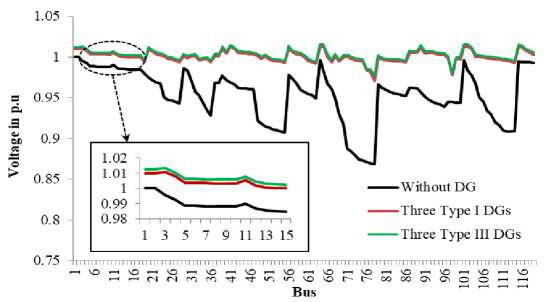
Fig.10. Bus voltage of 118 bus IEEE RDS
5.5. IEEE 118-bus Benchmark RDS
The applicability and adoptability of the LSF-WOA integrated technique are investigated by extending the simulation study to a large 118-bus IEEE RDS. This large RDS has 22709.7 kW AP and 17041.1 kVAR RP load demand. Simulation findings are analyzed for three units of Type I and Type III DG placements, considering the size of the test system. Table 7 presents the non-optimized and optimized solutions for the large 118-bus RDS. APLT and BVmin before the DG placement are 1296.3 kW and 0.8688 p.u. The hybrid technique optimizes the DGs in the 71 st, 69th, and 70thbuses of the test system according to the LSF computation. Fig. 9 illustrates the LSF values of the 118-bus RDS. The APLT minimizes to 530.4 kW and 321.5 kW, respectively, after the hybrid technique optimizes Type I DGs for 2122.4 kW, 1899.3 kW, and 1398.7 kW ratings and Type III DGs for 934.2 kVA, 1736.5 kVA, and 1382.1 kVA ratings, respectively. Further, BVmin is improved from 0.8688 p.u. to 0.9704 p.u. and 0.9765 p.u. after the three units of
6. Conclusions
Type I and Type III DG allocations, respectively. WOA takes 25 iterations and 52 seconds to converge for type I DG optimization, and it takes 28 iterations and 59 seconds to converge for type III DG optimization. For both types of DG allocations, WOA converges efficiently without any local optima stagnation. Fig. 10 and Fig. 11 present the optimal solution for bus voltage of the 118-bus RDS and the convergence characteristic of WOA, respectively.
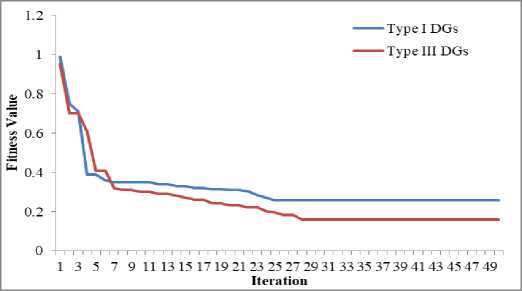
Fig.11. Convergence characteristic of WOA for 118-bus RDS
An integrated approach has been implemented in this work by integrating LSF and WOA to optimize different types of DG into the RDS. The ideal site and size for the DG units are found to cut down the APL T and enhance the bus voltages of RDSs. The effectiveness of the proposed technique has been realized on the 33-bus and 118-bus IEEE RDSs. The PL is significantly minimized, and the bus voltages are considerably enhanced without violating operational constraints of RDSs. Also, the simulation findings are related to the popular optimization methods to examine the efficacy of the hybrid technique. The comparison emphasized that better results are obtained with the proposed technique than with the other methods. Further, the adoptability of the hybrid technique is tested for variable load demand on the IEEE 33-bus RDS. The simulation findings prove that the proposed hybrid technique can perform DG optimization effectively to a dynamic load demand variation. However, the present work does not analyze the performance for unbalanced loading conditions. It can be addressed as future work.
