An Intelligent Approach of Regulating Electric-Fan Adapting to Temperature and Relative Humidity

Author: Ali Newaz Bahar, Mrinal Kanti Baowaly, Abhijit Chakraborty
Journal: International Journal of Intelligent Systems and Applications(IJISA) @ijisa
Article in issue: 7 vol.4, 2012.
Free access
In our daily lives, we enjoy the service of thousands of devices and systems that have made our lives easier and more comfortable. Electric fan is one of the most popular and used systems in developing countries like Bangladesh for its cost effectiveness and low power consumption. In the era of twenty-first century we expect all of our living and working systems will be intelligent when it will provide the service. We have developed a fuzzy inference system that effectively and intelligently controls the rotating speed of an electric fan according to the temperature of environment and its relative humidity. We used experimental data and verified the experimental data with different mathematical procedure to ensure that our result is well enough. We designed a simulation system to test the result but it can be easily implemented on hardware level, since fuzzy logic toolbox provides such facility.
Fuzzy logic, controller, inference system, fuzzy rules, curve fitting tools, relative humidity
Short address: https://sciup.org/15010281
IDR: 15010281
Text of the scientific article An Intelligent Approach of Regulating Electric-Fan Adapting to Temperature and Relative Humidity
Published Online June 2012 in MECS
An electric fan is a device which employs hubmounted rotating paddles to circulate air in the room. Unlike air conditioners, fans only move air; they do not directly change its temperature. Most of the real life system are nonlinear and it very difficult to represent a nonlinear system by any mathematical equation. Electric fan is also a nonlinear system when we are considering that it will be rotated according to the environment. So it is difficult to find any relation among relative humidity, air temperature and air velocity. We build such a fuzzy inference system [1] that has been successfully finding the relation among relative humidity, air Temperature and air velocity which will help to maximize the thermal comfort of human.
Energy crisis is one of the most critical problem that today’s world is facing. In order to reduce the energy consumption, we need to look through the areas where minimization of energy consumption is possible. In the typical home, air conditioning uses more electricity than anything else does - 16% of total electricity used. In warmer regions, AC can cause 60%-70% of our summer electric bill itself alone [2]. A window unit AC uses 500 to 1440 watts, while a 2.5-ton central system uses about 3500 watts [3]. In that place, a floor fan uses only 100 watts on the highest speed, and ceiling fans use only 15 to 95 watts depending on speed and size [4]. A combination of electric fans, insulation, and the other tips below keeps us comfortable - and saves hundreds of money, reduce production of CO2 and ultimately low down the use of energy [5].
Fuzzy logic is especially promising as it can provide intelligence behavior for many systems and devices. In this paper we have applied fuzzy logic to build a fuzzy inference system for the aims of regulating electric fan smartly that can lead a comfortable environment together with energy saving.
-
II. Overview of Fuzzy Based System
Fuzzy logic is an expert system that forms of mathematical logic which defines output between 0 and 1 with infinity number of values (multi-values).Fuzzy logic is widely used in machine control. Here some key terms’ definitions and explanations are listed below:
Fuzzy system: Fuzzy system is a mathematical system that analyzes analog input values in terms of logical variables that take on continuous values between 0 and 1.
Fuzzy controller: A fuzzy controller is a control system that controls the fuzzy logic base system. A fuzzy controller (Figure 1) consists of:
-
• An input stage
-
• A processing stage
-
• An output stage.
The input stage maps sensor or other inputs, such as switches, thumbwheels, and so on, to the appropriate membership functions and truth values. The processing stage invokes each appropriate rule and generates a result for each, then combines the results of the rules. Finally, the output stage converts the combined result back into a specific control output value.
Fuzzy Inference Systems: Fuzzy inference is the process of formulating and mapping a given input space to an output using fuzzy logic (Figure 2). The fuzzy inference consist membership functions, fuzzy logic operators and If-then rules. Fuzzy inference systems have been successfully applied in fields such as automatic control, data classification, decision analysis, expert systems, and computer vision.
Fuzzy controller
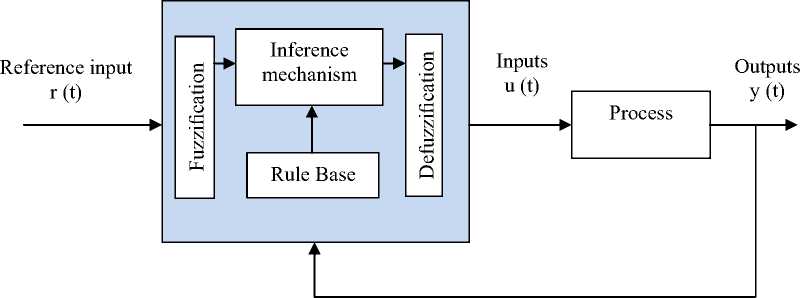
Figure 1 . A generalized form of a fuzzy controller
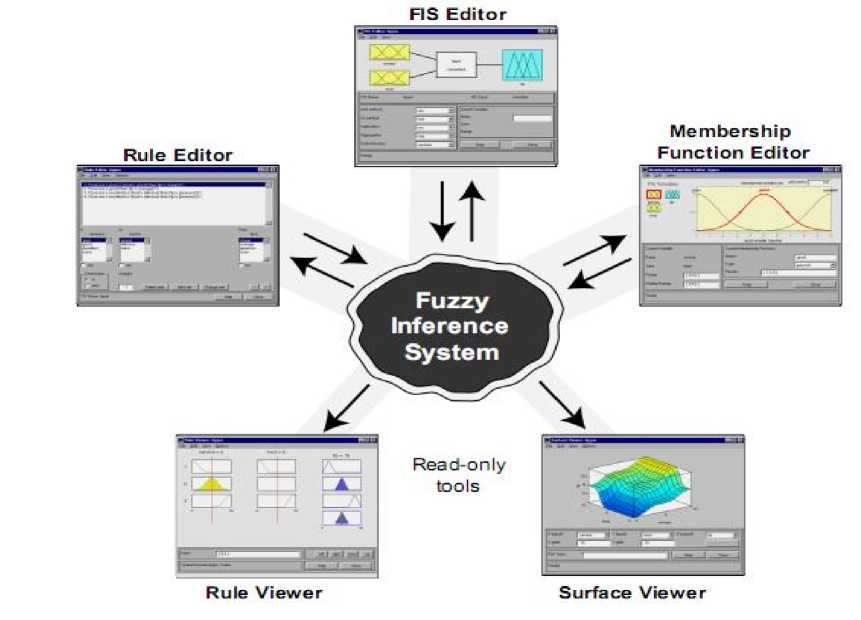
Figure 2.Fuzzy Inference System
The Fuzzy Logic Toolbox is a collection of functions built on the MATLAB numeric computing environment. It provides tools for you to create and edit fuzzy inference systems within the framework of MATLAB.
A fuzzy set consists of a universe of discourse and a membership function that maps every element in the universe of discourse to a membership value between 0 and 1.
A fuzzy rule is defined as a conditional statement in the form:
IF x is A
THEN y is B where x and y are linguistic variables; A and B are linguistic values determined by fuzzy sets on the universe of discourse X and Y, respectively.
Relative humidity: The ratio of the amount of water vapor in the air at a specific temperature to the maximum amount that the air could hold at that temperature and is given as a percentage value.
Fuzzy model : A finite set of fuzzy relations that form an algorithm for determining the outputs of a process from some finite number of past inputs and outputs.
-
III. Methodology
In this investigation the idea behind the use of the fuzzy logic was from the fact that temperature is not explicitly defined. For example, considering of “it is warm”, is this true, given that a measured temperature is 75o F? One would hesitate to answer “true” or “false”; rather prefer to say “sort of”. This is not a question of uncertainty about the external world, because we are sure of the degree of temperature. Rather, it is a case of vagueness or uncertainty about the meaning of the linguistic term “warm”. Fuzzy logic treats the true value of warmness is a number between 0 and 1, rather than being just “true” or “false”. Thus, a fuzzy set F in a universe of discourse X is characterized by a membership function µF that takes values within [0, 1] as follows:
µ F : X → [0, 1]
While conventional controllers are analytically described by a set of equations, the FLC is described by a knowledge-based algorithm. The FLC incorporates human knowledge into their Knowledge Base (KB) through fuzzy rules and fuzzy membership functions [6]. It is also suitable for nonlinear multi-input and multioutput systems. A block diagram of fuzzy logic system for temperature control is illustrated in Figure 3. In this project, the temperature (state variable) was determined by a heater in a form of output voltage (control variable). Membership functions transform crisp inputs (temperature) into fuzzy sets in the process of fuzzification and fuzzy sets back into crisp outputs (voltage) in the process of defuzzification [7].
Knowledge Base
Crisp data
Fuzzification


Fuzzy sets
Fuzzy sets
Crisp data
Inference
Defuzzification
Controlled System
Process State
Control Action
Environment
(Temperature)
(Voltage)
Figure 3 . Block diagram of fuzzy logic system for temperature control
Our whole experimental procedure has been divided into three phases:
Phase 1: Experiment Methodology Design
This phase includes the quest of answers of following questions:
How a non-linear system can be implemented with fuzzy system? [8]
If a fuzzy system is being developed, is it going to be better solution?
Phase 2: Experiment for Feasibility Testing
Generate curve for Temperature and Air Velocity
Tested with Heat Index Chart
Findings: Truly non-linear system
Generate curve for Air Velocity vs. Relative Humidity:
Tested with Wind Chill Effect Chart
Findings: Truly non-linear system
Generate curve for Temperature, Relative Humidity and Air Velocity:
Tested with Empirical Data
Findings: It also a non-linear system, but not truly non-linear system, a linear system can be implemented if one the thermal comfort parameter is constant. It shows that, if we build a fuzzy system, it could get a better result.
Phase 3: Simulated Implementation
Finally we implement our project using MATLAB package, named Fuzzy Logic Toolbox.
-
IV. Materials And Methods
A temperature control system consisted of a sensor, actuator, and computer (Figure 4). The signal from the sensor was amplified to increase measurement resolutions and fed back to A/D computer interface board. Lab View software was used to acquire the input signal and send output signal to an actuator. The output signal was determined by control algorithm. Fuzzy logic controller was designed in the Lab View and compared with conventional PID [9] controller.
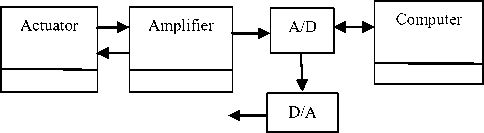
Figure 4 . Schematic diagram of a temperature control system
TABLE I. Experimental Data Set
|
Temp (oC) |
% rh |
Female (m/s) |
Male (m/s) |
Male & Female(m/s) |
|
50 |
0.38 |
0.41 |
0.39 |
|
|
26 |
60 |
0.41 |
0.41 |
0.41 |
|
70 |
0.58 |
0.58 |
0.58 |
|
|
80 |
0.74 |
0.76 |
0.75 |
|
|
50 |
0.98 |
1.09 |
1.03 |
|
|
28 |
60 |
1.05 |
1.05 |
1.05 |
|
70 |
1.27 |
1.16 |
1.22 |
|
|
80 |
1.35 |
1.27 |
1.31 |
|
|
50 |
1.74 |
1.69 |
1.72 |
|
|
30 |
60 |
1.64 |
1.72 |
1.68 |
|
70 |
1.72 |
1.69 |
1.70 |
|
|
80 |
1.79 |
1.84 |
1.83 |
|
|
50 |
1.87 |
1.74 |
1.81 |
|
|
32 |
60 |
1.92 |
1.97 |
1.95 |
|
70 |
2.16 |
2.21 |
2.18 |
|
|
80 |
2.21 |
2.34 |
2.27 |
-
V. Experimental Data Set
Experimental data set is the most significant part of a research. To develop our system, we use Experimental data set [10]. A subjective experiment as conducted to investigates the effects of air velocity on thermal comfort. A total of 128 college-ages students (64 males, 64 females) were asked to participate in the research work. Experiments were conducted in the environmental chamber at Chulalongkorn University from April to December 2002 The scope of the experiments were limited to the most common application where the subjects wore normal working dress and do office work.
-
VI. Experimental Fuzzy Rules
-
1. For If (T is mf1) and (RH is mf1)then(AV is mf1) (1)
-
2. If (T is mf1) and (RH is mf2) then (AV is mf1) (1)
-
3. If (T is mf1) and (RH is mf3) then (AV is mf1) (0.92)
-
4. If (T is mf1) and (RH is mf3) then (AV is mf2) (0.08)
-
5. If (T is mf1) and (RH is mf4) then (AV is mf1) (0.75)
-
6. If (T is mf1) and (RH is mf4) then (AV is mf2) (0.25)
-
7. If (T is mf2) and (RH is mf1) then (AV is mf3) (0.03)
-
8. If (T is mf2) and (RH is mf1) then (AV is mf2) (0.97)
-
9. If (T is mf2) and (RH is mf2) then (AV is mf2) (0.95)
-
10. If (T is mf2) and (RH is mf2) then (AV is mf3) (0.05)
-
11. If (T is mf2) and (RH is mf3) then (AV is mf2) (0.88)
-
12. If (T is mf2) and (RH is mf3) then (AV is mf3) (0.12)
-
13. If (T is mf2) and (RH is mf4) then (AV is mf2) (0.59)
-
14. If (T is mf2) and (RH is mf4) then (AV is mf3) (0.31)
-
15. If (T is mf3) and (RH is mf1) then (AV is mf3) (0.72)
-
16. If (T is mf3) and (RH is mf1) then (AV is mf4) (0.28)
-
17. If (T is mf3) and (RH is mf2) then (AV is mf3) (0.68)
-
18. If (T is mf3) and (RH is mf2) then (AV is mf4) (0.32)
-
19. If (T is mf3) and (RH is mf3) then (AV is mf3) (0.80)
-
20. If (T is mf3) and (RH is mf3) then (AV is mf4) (0.20)
-
21. If (T is mf3) and (RH is mf4) then (AV is mf3) (0.68)
-
22. If (T is mf3) and (RH is mf4) then (AV is mf4) (0.32)
-
23. If (T is mf4) and (RH is mf1) then (AV is mf3) (0.69)
-
24. If (T is mf4) and (RH is mf1) then (AV is mf4) (0.31)
-
25. If (T is mf4) and (RH is mf2) then (AV is mf3) (0.05)
-
26. If (T is mf4) and (RH is mf2) then (AV is mf4) (0.95)
-
27. If (T is mf4) and (RH is mf3) then (AV is mf4) (0.72)
-
28. If (T is mf4) and (RH is mf3) then (AV is mf5) (0.28)
-
29. If (T is mf4) and (RH is mf4) then (AV is mf4) (0.73)
-
30. If (T is mf4) and (RH is mf4) then (AV is mf5) (0.27)
-
VII. Experiment And Analysis of Results
After using graphical methods to evaluate the goodness of fit, we should examine the goodness-of-fit statistics. Curve Fitting Toolbox [11] software supports these goodness-of-fit statistics for parametric models:
o The sum of squares due to error (SSE)
o R-square o Adjusted R-square o Root means squared error (RMSE)
For the current fit, these statistics are displayed in the Results list box in the Fit Editor. For all fits in the current curve-fitting session, you can compare the goodness-of-fit statistics in the Sum of Squares Due to Error. This statistic measures the total deviation of the response values from the fit to the response values. It is also called the summed square of residuals and is usually labeled as SSE.A value closer to 0 indicates that the model has a smaller random error component, and that the fit will be more useful for prediction.
This analysis signifies that, if one input parameter is taken under consideration, we found, the system as a linear system. But, the total system is not a linear system, that is, if we consider temperature and relative humidity as input and try to relate with air velocity, it concludes with a non-linear system.
If some of the input parameter shows the linearity attitude with output parameter, then we can conclude our observation as – fuzzy mamdani system can be implemented in our system. So it is necessary to insure that, fuzzy mamdani system can be used in our system.

Figure 5 . Rule Viewer
|
Air Velocity vs. Temperature |
p 3 = |
-16.73 |
|
Linear model Poly3: |
p 4 = |
150.4 |
|
f(x) = p 1 *x3 + p 2 *x2+ p 3 *x + p 4 (1) |
Coefficients: fit3 |
|
|
Where x is normalized by mean 29 and std 2.582 |
p 1 = |
0.003333 |
|
Coefficients: fit1 |
p 2 = |
-0.3 |
|
p 1 = -0.01354 |
p 3 = |
9.227 |
|
p 2 = 1.144 |
p 4 = |
-95.1 |
|
p 3 = -31.81 |
Coefficients: fit4 |
|
|
p 4 = 292.4 |
p 1 = |
-0.0002083 |
|
Coefficients: fit2 |
p 2 = |
0.01125 |
|
p 1 = -0.007292 |
p 3 = |
0.1283 |
|
p 2 = 0.6112 |
p 4 = |
-6.53 |
26 27 28 29 30 31 32
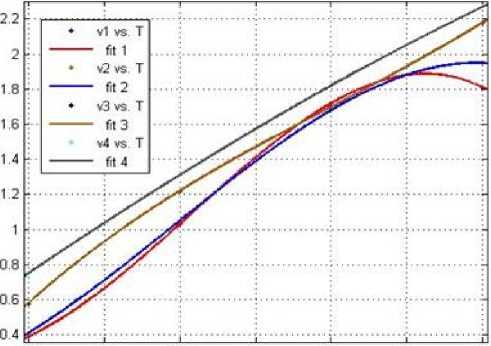
Figure 6 . Curve Fitting Air Velocities vs. Temperature
|
Air Velocity vs. Relative Humidity |
p 3 = |
0.2318 |
|
Linear model Poly3: |
p 4 = |
1.131 |
|
f(x) = p 1 *x3 + p 2 *x2 + p 3 *x + p 4 (2) |
Coefficients: fit3 |
|
|
Where x is normalized by mean 65 and std 12.91 |
p 1 = |
0.01434 |
|
Coefficients: fit1 |
p 2 = |
0.06667 |
|
p 1 = -0.05379 |
p 3 = |
0.02367 |
|
p 2 = 0.0625 |
p 4 = |
1.68 |
|
p 3 = 0.2275 |
Coefficients: fit4 |
|
|
p4 = 0.4856 |
p 1 = |
-0.08248 |
|
Coefficients:fit2 |
p 2 = |
-0.02083 |
|
p 1 = -0.08248 |
p 3 = |
0.3093 |
|
p 2 = 0.02917 |
p 4 = |
2.068 |
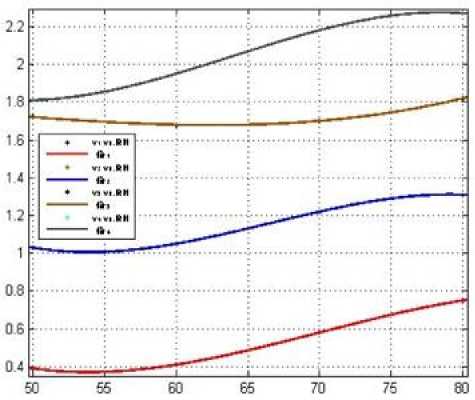
Figure 7 . Curve Fitting Air Velocities vs. Relative Humidity
If the first derivative f ' is positive (+), then the function f is increasing.
If the first derivative f ' is negative (-), then the function f is decreasing.
If the second derivative f '' is positive (+), then the function f is concave up.
If the second derivative f '' is negative (-), then the function f is concave down.
Air Velocity vs. Relative Humidity Curve Analysis figure is following.
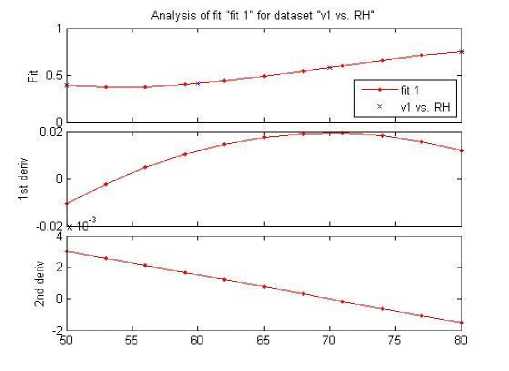
Figure 8 . Analysis of V1 vs. RH
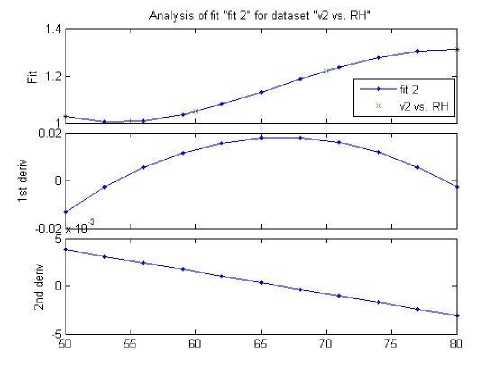
Figure 9 . Analysis of V2 vs. RH
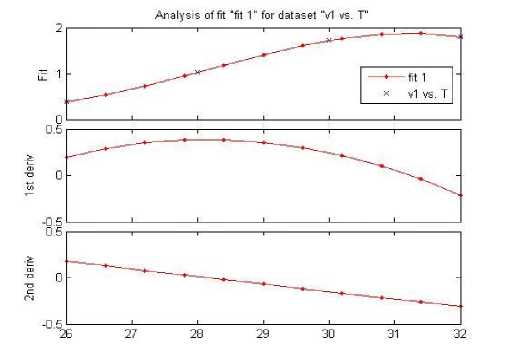
Figure 10 . Analysis of V1 vs. T
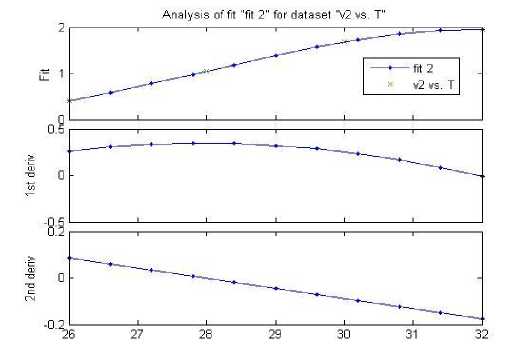
Figure 11 . Analysis of V2 vs. T
As we can see from the following curves, all individual parameters are linear with the output. So, if we develop our system with fuzzy mamdani system, it will provide good result. Here in the above, you can see that – first order derivative and second order derivative being calculated, it is done because we need to know the nature of curve for missing data, i.e. what will be the air velocity of 26.7F?
Here, we also verified our experimental data with curve fitting and curve nature analysis that ensure the optimized output from fuzzy mamdani inference system.
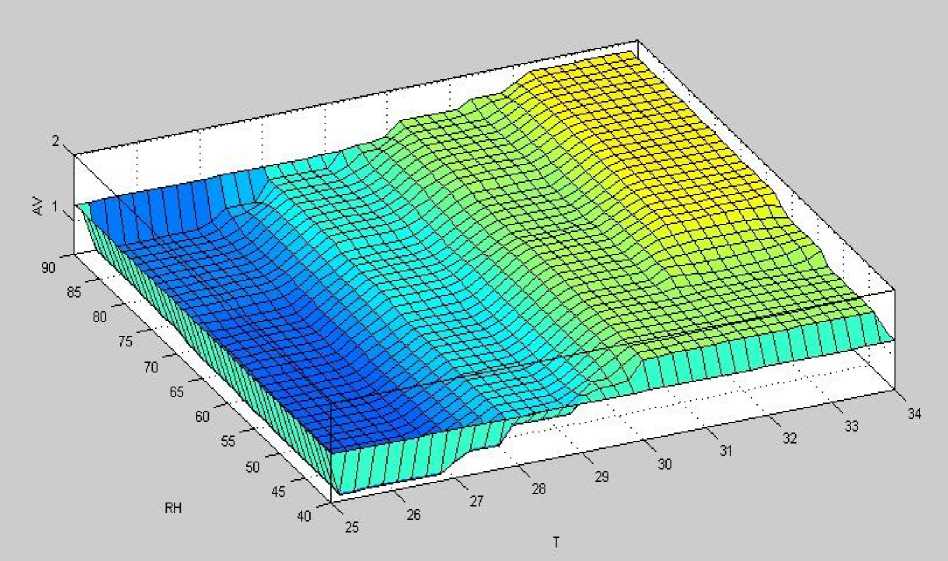
Figure 12 Output Surface view
-
VIII. Implementation
We conveyed our research project implementation using MATLAB package, named Fuzzy Logic Toolbox [12]. We got simulated outcomes by using this tool. Fuzzy Logic Toolbox save its project files with FIS file extension. It can also save the FIS in ASCII format for use outside the MATLAB environment. The toolbox supplies a fuzzy inference engine that can execute your fuzzy system as a stand-alone application or embedded in an external application. So, it’s simple to implement fuzzy system in an embedded system. There is free fuzzy logic library, implemented in C++, also available for this purpose.
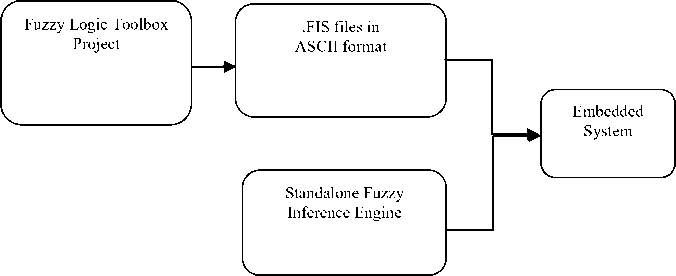
Figure 13 Fuzzy System Implementation Diagram
-
IX. Limitation And Future Scope
Since, the research project is related to the human thermal satisfaction, it is quite impossible to insure the maximum satisfaction [13] to all. There are lots of human thermal factors which are not mathematically described yet.
The present system has been formalized considering human comfort as prime condition. There are several issues that could be taken under consideration as future work.
-
i. The system can be extended if it includes real time analysis on basis of seasonal changes. Adaptive neural network can be a better choose for this purpose.
-
ii. The economy zone can be subdivided to include different modes depending on power being used by
the system and to enhance the system performance to include power saving features.
Also the system can be implemented with a timer based control to make the Fan work in a native manner to effectively increase the net output of the system.
-
X. Conclusion
The great achievement of our research project is that finally we can develop such a Fuzzy inference system successfully which establish a relationship among relative humidity, air temperature and air velocity. With this project now it is possible to control an electric fan automatically based on weather and condition which will intelligently control a fan.
References An Intelligent Approach of Regulating Electric-Fan Adapting to Temperature and Relative Humidity
- M. Hamdi, and G. A Lachiver, “Fuzzy Control System Based on the Human Sensation of Thermal Comfort," IEEE, 1998, pp.487- 492.
- Ari, S., Cosden, I. A., Khalifa, H. E., Dannenhoffer, J. F., Wilcoxen, P. and Isik, C. , 2007: “Individual Thermal Comfort and Energy Optimization”, Proceedings of Clima Wellbeing Indoors.
- Dr. Hassan Moghbelli, Sinan Sabih, Fatima Ali “Investigation and Design of Solar Cell System for Households in Gulf Cooperation Council (GCC)”
- http://dealnews.com/features/Get-Some-Deals-to-Keep-Your-House-Cool/461807.html
- Kuntze, H.-B, Bernard, Th, “A new fuzzy-based supervisory control concept for the demand-responsive optimization of HVAC control systems” Decision and Control, Proceedings of the 37th IEEE Conference on, vol. 4, pp. 4258-4263, 1998.
- De SILVA, C. , “Knowledge Base Decoupling in Fuzzy Logic Control Systems”, Proceedings of the American Control Conference, San Francisco, USA, vol. 1, 760–764, 1993.
- Defuzzification: criteria and classification, from the journal Fuzzy Sets and Systems, Van Leekwijck and Kerre, Vol. 108 (1999), pp. 159-178
- C.M. Chu, T.L. Jong, and Y.W. Huang, " Thermal Comfort Control on Multi-Room Fan Coil Unit System Using LEE-Based Fuzzy Logic," Energy Conversion and Management, Vol. 46, Issues 9-10, June 2005, pp. 1579-1593. 10.
- Jantzen, J., September, 1998: „Tuning of Fuzzy PID Controllers‟, Technical University of Denmark, report 98-H 871.
- “Effects of Air Velocity on Thermal Comfort in Hot and Humid Climates” by W. Srivajana, Thammasat Int. J. Sc.Tech.Vol. 8, No. 2, April-June 2003).
- MATLAB: Curve Fitting Toolbox http://www.mathworks.com/products/curvefitting
- MATLAB: Fuzzy Logic Toolbox User’s Guide, www.mathworks.com, 2008.
- Jones, B. W., 2002, “Capabilities and limitations of thermal models for use in thermal comfort standards”, Energy and Buildings, Vol. 1, No. 34, pp. 653–659.
