An Investigation and Structure Model Study on College Students'Studying-interest

Author: Chuanmei Wang
Journal: International Journal of Modern Education and Computer Science (IJMECS) @ijmecs
Article in issue: 3 vol.3, 2011.
Free access
Nowadays college students’ studying-weariness is a common problem needs to be solved in China. Also, college students' studying-interest, studying-weariness psychology and misbehaviors have been the subject of considerable research in the last few years to educators and researchers all over the world. However, most of the existing studies in this field are qualitative theory analysis and short of actual investigation, survey and even less mathematical quantificational study. The investigation and study on studying-interest of college students from four universities in Wuhan demonstrates that college students show generally studying-weary mentality and correlative misbehaviors. With the designed college students' learning-interest questionnaire, college students in four universities of Wuhan were surveyed. And based on this survey, Structural Equation Model (SEM) was used to analyze the date of our investigation of the factors affecting college students’ studying-interest and studying-weariness. Results of our quantitative statistical analysis with mathematical model show the degree of each factor influencing studying-interest and studying-weariness. School-related factor and society-related factor are the main influences on college students’ studying-interest and studying-weariness. The major objective of this paper is to provide an integrative review of the college students’ studying-interest and studying-weariness, in order to contribute to the development of high education. Countermeasures and Suggestions are also put forward to rectify the college students’ studying-weariness. This work will play an important role for education departments and educators to take corresponding measures to provide scientific guidance of high education.
College students, studying-weariness, questionnaire survey, studying-weariness structure mode, empirical study
Short address: https://sciup.org/15010207
IDR: 15010207
Text of the scientific article An Investigation and Structure Model Study on College Students'Studying-interest
Published Online June 2011 in MECS
The literature on studying-weariness psychology or studying-interest has shown that studying-weariness psychology or with less studying-interest has been the more outstanding problem in college students' learning activities. And it is an important aspect related to whether college students' psychological is healthy. The weariness not only seriously hindered the professional knowledge of students, but also greatly affects the accumulation of college students' integrated qualities, including psychological quality. Currently there are many researches on college students' weariness, but the vast majority is qualitative theory analysis, only Ref. [1] and [2] are questionnaire surveys with simple statistical analysis. Ref. [1] is only on a questionnaire with simple descriptive analysis, and Ref [2] used Logistic regression analysis to analyze the influence factors of studying-weariness with less survey data and little result of correlation. Logistic regression analysis is to select a few observations, and to see their significant correlation on studying-weariness. There are many latent not observed variables such as family-related factors and school-related factors are ignored. Other qualitative analysis (such as Ref [3] ~ [8]) including the college students' psychological health (such as Ref [3] [4]) emphasized students-related factors (as the purpose of to university, self-control, learning foundation, etc.), family-related factors (such as the family economic status, parents’ attitude, etc.) and study-related factors (such as learning environment, teachers' ability, etc.) for college students of weariness. However, how to measure the degree of these latent not observed factors related to studying-interest and studying-weariness and the correlations between these factors were short of research by now.
The aim of this paper is to explore the factors those influence college students' studying-interest and studying-weariness, also the degree of the correlations. The investigation with 250 questionnaires to study on studying-interest and studying-weariness of college students from four universities in Wuhan demonstrates that college students show generally less studying-interest or studying-weary feelings and behaviors. The weariness mostly results from body and-mind pattern and externalcause pattern varies from person to person. Antecedents of college students' studying-weariness are different to different research models. As to research many factors that impact on studying-weariness needs to deal with a number of reasons and many results of the relationship, or the variables which cannot be observed directly (latent variable), such as the family factors or the study factors, and they are Complex problems. But these problems can be solved easily using SEM (Structural Equation Model).
This article is divided into five parts: the first part contains a literature review on college students’ studying-interest and studying-weariness. The second part presents the description of our investigation. The third part comprises of the study model and analysis. The forth part is the research result. The fifth part is consisted of countermeasures and suggestions to college students’ studying-interest and studying-weariness. In this paper the data is analyzed using SEM principle to put forward the college students' studying-weariness structure model.
The methods to measure the relationship of each antecedent are also illustrated. The work of this paper is of important meanings to education organizers and psychology researchers both in realism and academic study.
-
II. T he O VERALL D escriptive A nalysis of O ur I nvestation
We adopt the view, common in psychology, which learning-interest consists of the change in an individual’s behavior that occurs in response to some psychology. The author of this paper designed a "college students' studying-interest list for questionnaire ". The content of the list for questionnaire included six blocks: respondents’ basic information (including professional, grade, education, gender, etc); factors influencing studying-weariness coming from family schools, society, personality; and degree of studying-weariness and improvement measures of respondents. The designed questionnaire was reviewed by two exporters, and they modify some indexes of the narrative narrate to make correction indexes express meaning clearer. Then 30 senior undergraduates were tested, and results show that the scale with good reliability and validity.
College students coming from four universities in Wuhan were randomly sampled to our questionnaire in December of 2009. There were total 250 college students, including students form freshmen to master graduate students. After the screening of questionnaire survey, some invalid questionnaires were removed, and total 216 valid questionnaires were obtained. So the efficiency was 86.4%, and boys account for 52.5%, girls 44.5%.
Another important aspect of investigation is the indexes to reflect the psychology of studying-interest and studying-weariness. We adopt the view that learning consists of the change in an individual’s behavior that occurs in response to some experience. The behavior of an individual is described by some indexes, and we design the indexes of studying-weariness mainly including: passive learning, tired in class, escaping with trouble and professional weariness etc. More than three observations were designed for each potential variable. And each observation was measured by five points Likert method, 1 means "basically no influence," 5 means "affected greatly". Each grade with more than 3 points that is the moderate intensity of studying-weariness is statistically as table I.
TABLE I.
studying - weariness degree of each grade
|
Grade |
Passive learning |
Tired in class |
Escaping with trouble |
Professiona l weariness |
|
Freshman |
0.37 |
0.41 |
0.44 |
0.23 |
|
Sophomore |
0.72 |
0.83 |
0.72 |
0.55 |
|
Junior |
0.70 |
0.72 |
0.61 |
0.57 |
|
Senior |
0.46 |
0.36 |
0.57 |
0.39 |
|
Postgraduate |
0.29 |
0.36 |
0.29 |
0.36 |
These results show that sophomore and junior with higher studying-weariness than other grade students
(Note that each respondent may give more than one answer.). Seniors is not the worst on studying-weariness. Postgraduates and freshmen are with better attitude on learning. Freshmen just leave high school and the rigorous study style do not lose; most postgraduates with certain ideals or to pursue their own interests, to do research and study, so they have lower degree of disgusted attitude. Sophomore and junior students are already familiar with the university of learning, examinations, living environment, and without pressure of graduation, entering a higher school or finding job. At the same time, a big part of these students have a parttime job outside, so that their economy is good, and they do not mind learning. Senior students are busy with the examination of postgraduates or finding jobs in pressure. Meanwhile, many students understand the importance of knowledge and to make effort at the last moment, so the weariness is not very prominent.
-
III. C ollege S tudents ' S tudying - weariness S tructure M odel
To discuss the college students' studying-interest and studying-weariness structure model, building of structure variables and theory-based hypotheses must be accompanying with. So we can later examine a nomological network to test construct validity. Although this approach does not follow the conventional article format, we felt that it was justifiable given the stress on mathematical model in the special issue.
-
A. Variable Selection for the Structure Model
Family-related factor, school-related factor and social-related factor are the basic dimensions relevant for the college students’ studying-interest and studying-weariness. So there are four latent variables affect college students’ studying-weariness: family-related factor ( ξ 1 ), school-related factor ( ξ 2), society-related factor ( ξ 3) and personality-related factor of learning ( η 1 ). These latent variables and college students’ studying-weariness ( η 2 ) make up all the structural variables in college students’ studying-weariness structure model.
-
B. Hypotheses of the Correlation Between the Varibles
Family-related factor, school-related factor and social-related factor are influences from outside to effect the college students’ studying-interest and studying-weariness, so they were set as exogenous variables (also called independent variables). The personal learning factor of studying-weariness psychology measured by observations: learning self-control, purpose of going to university, planning and graduation etc. Many of them are coming from the outlook on life of psychological, and they are easily changed in the external environment, so personal factor of learning and studying-weariness are set as endogenous latent variables (also called dependent variable). According to the literature study reviews ([1]~[9]) and educators’ practical experience, family-related factor, school-related factor, and social-related factor effect the college students' personality factor of learning; family-related factor, school-related factor, society-related factor and the college students’ and personality factor affect studying-interest and studying-weariness psychology. So we can play the correlations of each latent variable as follows:
Hypothesis 1. Family-related factor is positively related to college students' personal factor of learning;
Hypothesis 2. School-related factor is positively related to college students' personal factor of learning;
Hypothesis 3. Social-related factor is positively related to college students' personal factor of learning;
Hypothesis 4. Family-related factor is positively related to college students’ studying-weariness psychology;
Hypothesis 5. School-related factor is positively related to college students’ studying-weariness psychology;
Hypothesis 6. Social-related factor is positively related to college students’ studying-weariness psychology;
Hypothesis 7. College students with higher personality of learning are more likely to be with less studying-weariness.
As shown in Fig.1 of each factor to describe the relationship among the variables and college students studying-weariness.
-
C. The Research Model
Next we will use SEM principal [9][10] [11] to study the influence and the degree of antecedences to college students’ studying-weariness. With the above analysis, we can construct the college students’ studying-weariness structure model as Fig.1. That is a schematic diagram of the conceptual elements in our research model.
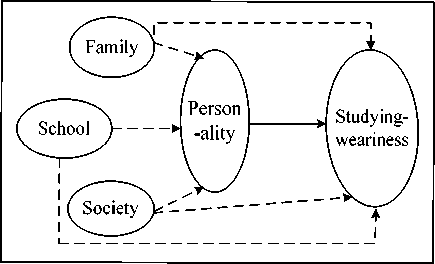
f igure 1. c ollege s tudents ' s tudying - weariness s tructure m odel .
Fig. 1 shows the structural equation can be expressed as:
П2 — в21П1 + Y21^1 + 722^2 + 72353 + $2
And Eq. (1) can be shorted in matrix form as П = Bn + V ^ + q .
Here we suppose there are S(p) observations correspond to the pth independent variables ^ denoted as xpq(q = 1,l,5(p), p = 1,2,3) ; and L(I) observations correspond to dependent the ith variable ni are denoted as yji(i —1,2; j - 1,L,L(i)). The relationship functions of those latent variables give rise to the observations are as follows:
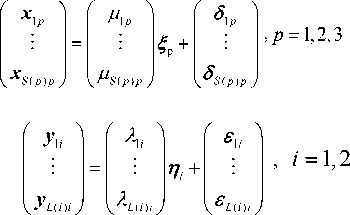
Where (2) and (3) make up a system of equations. ^ qp and X ji are loadings. g qp is zero mean random term, which is not correlating with the latent variable ^ p ( p — 1,2,3 ). £ ji is zero mean random terms not correlating with the latent variables n i ( i — 1,2). On the other hand, we denote the observations give rise to the latent variables with loadings у pq to exogenous variables and m ij to endogenous variables. The relationship functions which the observations give rise to the latent variables can be denoted as follows:
S ( p )
q — 1
L ( i )
n . - E ® .} У }. + £ 4.’ i — 1,2 (5)
j — 1
Where and are random errors with zero mean 5p n and not correlating with the other variables. Equation (1), (2) and (3) make up the SEM equation system which with forward observations. Equation (1), (4) and (5) make up the SEM equation system which with backward observations.
-
D. The Algorithm of Our Research Model
The College Students' Studying-weariness Structure Model (CSSM) belongs to the SEM, so we can use SEM algorithm to discuss its estimation. At present, the international popular algorithm for SEM is Linear Structure RELationship (LISREL) and partial least square (PLS) algorithm. Let’s take College Students' Studying-weariness Structure Model in Fig .1 for example to illustrate its algorithms.
LISREL starts from (1), (2) and (3) SEM equation system, and the algorithm is to fit model covariance with sample covariance. As PLS algorithm is more reasonable and popular, this paper mainly introduced the PLS algorithm.
The PLS algorithm was put forward by Professor Fornell et al in 1996, and the algorithm starts from (1), (4) and (5) SEM equation system. Fornell’s algorithm is as follows:
Step 1: a group of initial value of ^(0) and Д'*1 are pq ij given, and then we can educe the initial value of Jp0) and 7(0) from (4)and (5);
Step 2: With the initial value of ^0) and 7 (0) , we can put them in structural model (1), then we can estimate the coefficients P j 0 and y j based on OLS.
Step 3: With the estimated J p0) , P j and y^ , we
(1) can forecast 7 , again with (1).
Step 4: With the up-to-the-minute J p 0 and 7 , '’ , corresponding to the observations, we can estimate у/^ and to j again from (4) and (5).
Through the partial least square (PLS) method iterates time after time, until the solution is steady-going.
The iterative process above mentioned can be described as follows:
.
Where 7 * 1' parameter estimation is obtained from structural equations and ( J 1 , 7 , ) (0) parameter estimation is obtained from observed equations.
Professor Fornell, the founder of CSI model found there were main two defects of this algorithm:
Firstly, Fornell’s PLS method doesn’t always ensure the convergence of iterative process. In his paper (1996) and many other literatures, they gave arbitrary initial value and usually took ( 1,0,0, L 0 ) ' - It was reported that it could cost four or five minutes to adopt PLS method in CSSM for 250 samples and 18 indexes. Obviously it is too slow.
Secondly, the convergency has not been proven well.
In fact, we find that arbitrary initial value of ^ pq and ro y is not necessary and we can calculate the suitable iterative initial value based on PLS and the sense of ordinary least square (OLS). First of all, let’s specify some essential properties of PLS to SEM.
Firstly, the solution of our model consisting of (1), (2) and (3) is not unique, which may be different as much as constant times. That is, if ( 7 , , 7 2 ,J 1 , J 2 , J 3 ) is a solution, then ( C 7 X , C 7 2 , c J , c J , 2 ) is also a solution, where c is an arbitrary constant. Therefore, we can normalize latent variables 7 1 , 7 2 ,J 1 , J 2 , J 3 to unit variable.
L ( i )
Secondly, (3) is equivalent to (5) if X x x = 1. So Z^ ij j j = 1
the solution of (3) is equal to that of (5) based on PLS. In the past, the PLS algorithm is not proceeded based on (3) but (5). The previous PLS algorithm starts from (1), (4)
and (5) SEM equation system, and next we start from (1), (2) and (3) SEM equation system with a constraint of modular length of the structural variables to obtain the suitable iterative initial value, also we give the provision of the convergence of the modular constraint least square solution.
Note that (3), if we denote Y , = ( yh, L , y L ( , ) , ), with the assumption that each observation variable has n observations, then Y is a n by L ( ) matrix. Note Л у = ( X 1,, L , X l ( , ) , ) , e , = K v, e L „J , consequently, the above function can be rewritten as :
Y = 7.Л K+ e, (6)
With Y ' multiplying the two sides of the above function, under the sense of ordinary least square equality, we can get: Y , ' Y , « ЛД ' 7 Л у + e ' e , = 7РЛ У, Л у + e',6, . If we choose the latent variables satisfy 7 / 7 , = 1 , then
Y' y «л у л у, + ед (7)
If we ignore the variance of e, , we can get Y,’ Y, «Л УЛ у , and then we can get the biased estimation of Xk, (k = 1,l , L(,)) . Here we fully consider the variance of 8, to improve the biased estimators.
In fact, E ( Y ' Y ) = Л У Л Y, + E ( e ' e , ) , so (7) is reasonable. We can see with our assumption, E( e ' e^ is a diagonal matrix which can be denoted as E ( e ' e^ = T = d,ag ( ^ , 2, l , ^ L o-) ) . Denote e ( Y-' Y ) = 2 , and we can get
2 = Л Y^ y+Y (8)
That is
л У1,' У, Уи y2, L Уи' yL(,)
У2,’ У, У2,’ У2, L У2,’ yL(,), vyL(,) yii yL(,), y2, L yL(,), yL(,), v
^ ki +Фк = уы' уы,1 = 1, L , L ( i ) (10)
where Aki reflects the influence of latent variable fi to observation variable yki .
Now our task is to estimate Л Yi and Y from (8).
First we should estimate Y . As Y is a diagonal matrix, we can estimate it as follows: denote Y = diag ( ф 2, l , ф L ( i ) ) , here ф 2 = 1 att , and S - 1 = (ox ) , i.e. the diagonal elements of Y is the reciprocal of the diagonal elements of S - 1 .
With Y and S - 1 , from (8) we can estimate Л Yi . Because Л ^ Л Yi is a nonnegative definite matrix, and
Л Yi is a j-dimension row-vector, we can know the rank of Л ^ Л Yi is 1, so we can make orthogonal transformation with orthogonal matrix T as follows:
T ( S - Y ) T = diag ( 1 1 ,0, L ,0) = Ф L ,) x L ( i ) (11)
Let T 1 be the first column of T , so
AYA Yi = ТФТ’ = (Tl/2 /(Т^2)
And we get the estimator:
Л „ = T#(13)
Similarly, we can estimate Л X in the same way.
So we get the suitable iterative initial value
ˆˆˆ
Л Yi = ( A i , L , A L ( i ) i ) ( i = 1, 2 ) and
ˆ
Л X ( /А p , , X 2 S ( p ) p ) .
Next we will estimate the elements of the latent variable fi . Note ni = (fn,^2,l,fn)' , we will estimate its elements one by one.
Equation (6) can be rewrited
%
Yr ^ y^ L , y L ( i y) =
M ( A i , L , A L ( i ) i ) + £ i .
as
Each
\P n )
yi (к = 1,l , L(i)) have n observations, denote them as Pki = (Уи 1,L, yin) (1 = 1,L,L (i)). Then to the (s,k)th element of Yi we have the approximative relation as below:
y^ * 4n , 1 = 1, L , L ( i ) ; s = 1, L , n (14)
We denote vector y is = ( У 1 is , L , y L ( i ) is ) as the s th row of matrix Y i . Consequently, the above function (14)
can be note as: y is * n is Л Yi . With Л Yi multiplying the two sides of y is * n is Л Yi from the right side, under the sense of OLS equality, we get
J is ЛА- * n is Л Yi ^ Yi
In fact, E ( y s A Yi ) = n is Л Yi A Yi . Then we can estimate n is as
^ • is = T s A Y L, s = 1, L , n . (16)
Л Yi Л Yi
Here Л Yi is estimated previously. In this way we obtain the estimation of all latent variables. They satisfy
L ( i )
Il n - E ® ij y ji ii ^ min
= 1
whose geometric significance is to find the distance between a unit spherical surface and a hyperplane. Its solution is unique if there are not linearly dependence among y ji .
It is necessary that the unit spherical surface and the hyperplane have no point of intersection. Otherwise the left of (17) may be zero, namely (5) has a precise solution or
L ( i )
it satisfies n i = ^ ® ij y ji . Then we can j = 1
conclude that there is linearly dependence among yji based on (3).
And our algorithm can be summarize as follows:
Step1: With the constraint || ^ || = 1,|| n || = 1 , we can estimate (2^ p , f j i ) (0) with (2) and (3).
Step2: Once we have the initial value of 2 p and f i , we can put them in structural model (1), then we can estimate the coefficients P ij and y y based on OLS.
Step3: With the estimated 2p, Pij and уу, we can forecast fi again with (1).
Step4: With the up-to-the-minute 2 and n , pi corresponding to the observations, we can estimate ^pq and toij again from (4) and (5).
Step5: We can forecast new (2^^'), f^2 ) with (4) and
(5) again.
Through PLS method iterates time after time, until the solution is steady-going.
The above improved algorithm can be expressed as:
( X pq , У у ) <2)<3),H 2 ||=U f || = ! > (^ 2 p , fl i ) (0) <1) >
У pq, Pj f) _^ (2^, ^T (4)(5) > у,-' (4)(5) > (2\n>
Then it starts iterating in PLS. It’s proven that the convergence rate is much greater. The process has been programmed and this procedure is often iterated only once or twice till convergence. For 250 samples it costs only 1 or 2 s to finish computing and the convergence rate has been enhanced by hundreds of times. The process has been received in software DASC (Tong Hengqing 2008A).
-
E. College Students' Studying-weariness Index
Now we put forward the College Students' Studying-weariness Index (CSSI) based on the CSI (customer satisfaction index) [9][10] with improvement. The formula in the reference paper [9] is short of statistical robustness. (The maximum value and minimum value of the data as a single item are taken to the calculation)
We suggest the last formula of CSSI is:
CSSI =
3 S(1) L(1)
EE Y P ^ pAp + E ^y J! + E ® 2j y j2
p = 1 q = 1 _____________________ J = 1 ____________________ J = 1 ____________
3 S(1) L(1)
EE Y2pVpq + Eв21®1] + E ®2J p =1 q=1 J=1
This formula integrates the variables correlated to the college students' studying-weariness by applying the coefficients multiplication with the observed variables. And make difference with the variables correlated to college students' studying-weariness index directly or indirectly. As here the observations are vectors, so we use the mean of them to take part in the calculation.
With CSSI we can see the degree of the college students' studying-weariness and to get more cheer and bright cognition about the problem. Consequently, we can offer some countermeasures and suggestions to correct college students' studying-weariness psychology, and guide students to learn to positive health direction.
-
IV. C ALCULATION R ESULTS AND A NALYSIS
In this section we will calculate the data of our investigations to analyze the degree of each antecedent how to influence on and the degree to college students' studying-weariness. According to SEM principal, we need to calculate the aCronbach'α value of each factor to insure whether our questionnaire is reliable. And then we need to test the validity of our questionnaire. With good reliability and validity, we can use SEM software DASC to calculate the influence coefficients between latent variables. The full calculation includes the following three steps.
|
personality-related factor |
3.287 |
0.908 |
|
studying-weariness psychology |
3.256 |
0.937 |
All the aCronbach'α of factors are more than 0.8, according to the theory of Nunally, the aCronbach'α value more than 0.7 that means the scale has high reliability. So our questionnaire is of good reliability, and the mean of each factor also can be seen in Tab. II.
Step 2: the Principal Component Analysis (PCA) is used to test the validity of our questionnaire. Bartlett's Test of Sphericity was used firstly to confirm whether the questionnaire can be analyzed by PCA. Results show KMO value is 0.873, that is means Bartlett’s Test of Sphericity with P = 0.000 significant level. Varimax Rotation was chosen to rotate factors, observations were chosen with higher loading of correlation factor and lower loadings in other factors.
Finally, observation variables of each latent variable were selected below. Family-related factors: parents don't care, family economic pressure, study pressure coming from parents. School-related factors: academic atmosphere, teaching methods, cheating in examinations, and oldness of teaching materials. Social-related factors: often entertainment, busy job, busy with passing certificate examinations, study useless. Personal-related factors: self control, foundation of studying, intelligence, purpose of going to university, way of life, plans after university graduate, interpersonal relationship. Studying-weariness psychology: passive learning, no spirit in class, escaping with trouble, professional weariness.
Step 3: using structural equation model (SEM) software DASC [10] to calculate the influence coefficients between latent variables. Equations (1) (2) (3) (or (1) (4) (5)) is a system of structural equation model. The influence coefficients between variables are shown in Tab. III.
TABLE III. influence coefficients of factors
|
coefficients matrixes of structural equations β (ij) and γ (ij) |
|||||||
|
β(ij) |
|||||||
|
0.0000 |
0.0000 |
||||||
|
-0.2167 |
0.0000 |
||||||
|
γ(ij) |
|||||||
|
0.3099 |
0.1675 |
0.2997 |
|||||
|
0.1793 |
0.5329 |
0.3466 |
|||||
|
regression coefficients between structural variables and observations П ( pq ) , w(ij) |
|||||||
|
П ( pq ) |
|||||||
|
-1.992 |
0.894 |
1.180 |
|||||
|
1.521 |
0.499 |
0.714 |
0.191 |
||||
|
0.779 |
0.194 |
-1.658 |
0.948 |
||||
|
ω(ij) |
|||||||
|
-1.030 |
-0.225 |
-0.104 |
0.550 |
0.118 |
-0.428 |
||
|
1.046 |
1.204 |
1.145 |
1.000 |
||||
|
CSSI: 67.023 |
|||||||
TABLE II. FACTORS ’ a C ronbach ’ a VALUES
|
Factors |
mean |
aCronbach’ a |
|
family-related factor |
3.261 |
0.897 |
|
school-related factor |
2.984 |
0.912 |
|
sociality-related factor |
3.089 |
0.924 |
-
(1) Among the influence factors, family-related factor (influence coefficient 0.31) and social-related
factor (influence coefficient 0.30) are the most important factors to personality of study; and school-related factor is the secondary cause (influence coefficient 0.17).
-
(2) Among the influence factors of studying-weariness, school-related factor is with highest level (influence coefficient 0.53), followed by social-related factor (influence coefficient 0.34), family-related factor (0.18), personality of study only for about 0.22. Where, the observations of personality are negative variables, so the coefficient is negative.
-
(3) Family-related cause lies mainly in parents don't care students' learning (influence coefficient -1.99), followed by high pressure form parents to students' study (influence coefficient 1.18).
-
(4) The main reason of school is the learning atmosphere (influence coefficient 1.52), followed by examination mode (influence coefficient0.71).
-
(5) The social aspect is mainly the viewpoint of certificates more useful than common learning (influence coefficient -1.66), and standpoint of study useless (influence coefficient of 0.95).
-
(6) To the personality of college students' studying-weariness, the main reason is less of self-control (influence coefficient -1.03) and purpose of going to college (influence coefficient -0.55).
-
(7) The college students' studying-weariness index of our survey in Wuhan four universities is 67.023. Relative to the full marks 100, the score indicates that the studying-weariness is serious.
-
V . C OUNTERMEASURES AND S UGGESTIONS
According to our questionnaire-based empirical study of college students’ study interest; it is obviously that college students' studying-weariness psychology is a common and serious problem needs to be solved.
-
(1) Schools should strengthen discipline construction: guide positive and diligent study atmosphere; govern strict examination discipline, and make students realize without effort there is no way to pass tests. In addition to strengthen the training of teachers, teaching methods, the implementation of heuristic implies the students in the open field, knowledge, and improve the ability to analyze and solve problems, arouse the students' interest in learning, to gradually disappear studying-weariness.
-
(2) School education should pay more attention to the psychological health of students, emotional cultivation, and help them set up correct outlook of life and values, and develop a wholesome personality. By now the university moral education is only in the
intellectual form; to establish real morality, it is important for schools to pay attention to the psychological or emotional health education.
-
(3) To establish a "school and family" jointed system. And to fully play the role of family in the college students' learning, living and the personality fostering, inhibit its negative influences. School teachers often communicate with parents, to help parents establish correct concept of education; so that they can guide the students to study and live scientifically and effectively.
A cknowledgment
This paper is supported by National Natural Science Fund of China (07F020305, 50979086 ) and Doctors Research Start-up Fund of Wuhan University of Technology(471-38650546).
References An Investigation and Structure Model Study on College Students'Studying-interest
- HeLuLan, FengMingLi etc, “Students learning situation investigation and analysis of relevant factors,” Journal of xianyang normal college. vol. 4, 2005, pp. 72–75.
- Yao Liwen, Yin Huaiyong, “Investigation and analysis on college students’ studying-weariness,” Journal of Lanzhou University (Social Science Version), Vol. 29, 2001, pp. 161–157.
- Kong Fanyan, “psychological analysis and control strategies of college students’ depression psychology,” Journal of Higher Education Research, Vol. 24, 2001, pp. 62–64.
- Qiu Xiaomei, “University of new poor mental health status analysis,” journal of higher education research. Vol. 24, 2007, pp. 37–39.
- Liu Xuenian, Zhang Bin, “Mental Barriers Analysis About College Students' Leaning,” Journal of Shenyang Medical College. Vol. 10, 1996, pp. 68–71.
- Yu Xiuhua, “Factors of Mental Errors and Governance of College Students Growth,” Journal of Shangrao Teachers College. Vol. 4, 1998, pp. 42–46.
- Song Ranran, Wu Hanrong, “Personality Characteristics Related Factors Analysis of One Secondary Specialized School Students in Wuhan,” Journal of Chinese School Health. Vol. 24, 2003, pp.118–121.
- Ge Jisheng, “College Students' Mental Disorders and Countermeasures in Sports teaching,” Journal of Teachers College of Qingdao University. Vol. 20, 2003, pp. 76-78.
- C. Fornell, M.D. Johnson and E.W. Anderson. 1996, The American customer satisfaction index: nature, purpose, and findings. J. Mark, 60, 7–18.
- So Young Sohn, Tae Hee Moon. 2003, Structural equation model for predicting technology commercialization success index (TCSI), Technological Forecasting & Social Change, 70, 885–899.
- Sun Lianrong, “The Principle and Operation of Structural Equation Modeling (SEM),” Journal of Ningbo University (Educational Science Edition). Vol.27, No.2, 2005, pp.
- Tong Hengqing, “Theorithm of Econometrics,” Higher Education Press of China. 2008,3.
