Анализ использования трудовых ресурсов и производительности труда

Автор: Болюченко Д.А., Бабалыкова И.А.
Журнал: Экономика и социум @ekonomika-socium
Рубрика: Основной раздел
Статья в выпуске: 5 (48), 2018 года.
Бесплатный доступ
Произведен анализ системы оплаты труда. Изучены факторы, влияющие на изменение работоспособности и эффективности сотрудников. Рассмотрено влияние факторов на производство валовой продукции. Исследована динамика затрат труда и трудоемкости на примере ООО РСП «Ангелинское».
Заработная плата, учет, оптимизация, сокращение издержек, эффективность
Короткий адрес: https://sciup.org/140239012
IDR: 140239012
Analysis of the use of labor resources and labor productivity
Analysis of the wage system. The factors with the greatest impact on the change in productivity and efficiency. The influence of factors on the production of gross output is considered. The dynamics of labor input and labor intensity on the example of Limited Liability Partnership Fish collective Farm "Arhangelskoe" (LLP FF "Arhangelskoe") of Krasnodar region.
Текст научной статьи Анализ использования трудовых ресурсов и производительности труда
Analysis of the use of labor resources and labor productivity
From the very beginning of scrutinizing of resources in Limited Liability Partnership Fish collective Farm "Arhangelskoe" (LLP FF "Arhangelskoe") we have analyzed the usage of labor potentials in 2016.
Table 1 – Use of labor resources in LLP FF "Arhangelskoe" in 2016.
|
Month |
The average number of employees |
Actual days worked by 1 employee |
Actual hours worked by 1 employee |
||||||
|
Planned |
Actual |
sufficiency, % |
Planned |
Actual |
% in correspondence with monthly average data |
Planned |
Actual |
% in correspondence with monthly average data |
|
|
January |
41 |
40 |
97,6 |
18 |
16 |
76,0 |
126 |
104 |
75,9 |
|
February |
42 |
40 |
95,2 |
18 |
17 |
81,0 |
126 |
107 |
78,0 |
|
March |
43 |
42 |
97,7 |
20 |
18 |
85,7 |
140 |
115 |
84,0 |
|
April |
41 |
42 |
102,4 |
23 |
20 |
95,2 |
162 |
144 |
105,1 |
|
May |
42 |
42 |
100,0 |
23 |
22 |
104,7 |
161 |
150 |
109,5 |
|
June |
45 |
43 |
95,5 |
23 |
22 |
104,7 |
160 |
155 |
113,1 |
|
July |
44 |
42 |
95,5 |
24 |
25 |
119,0 |
168 |
175 |
127,7 |
|
August |
44 |
44 |
100,0 |
24 |
25 |
119,0 |
168 |
170 |
124,0 |
|
September |
45 |
43 |
95,5 |
24 |
24 |
114,0 |
167 |
165 |
120,4 |
|
October |
40 |
42 |
105,0 |
23 |
24 |
104,0 |
161 |
156 |
114,0 |
|
November |
39 |
41 |
105,1 |
21 |
20 |
95,2 |
140 |
122 |
89,0 |
|
December |
40 |
41 |
97,6 |
19 |
19 |
90,0 |
125 |
118 |
86,1 |
|
Monthly average Data |
42 |
42 |
100,0 |
21,6 |
21 |
100,0 |
151 |
137 |
100,0 |
Conclusion,based on conducted analysis, clears up that the highest level of efficiency of employees is observed during the months of active fishing and preparing for the winter season in particular July, August, September. On the contrary, period of the lowest level of employees effectiveness continues since November till March. Such rapid changing of trend is affiliated with lack of job due to extremely lowest temperatures of the winter season
In order of comprehensive analyze of level of efficiency of the staff, it is necessary to observe their dynamics and structure, as well as factors of their changes, as it shown in figure 1.
Figure 1 – Structural-logical model of productivity
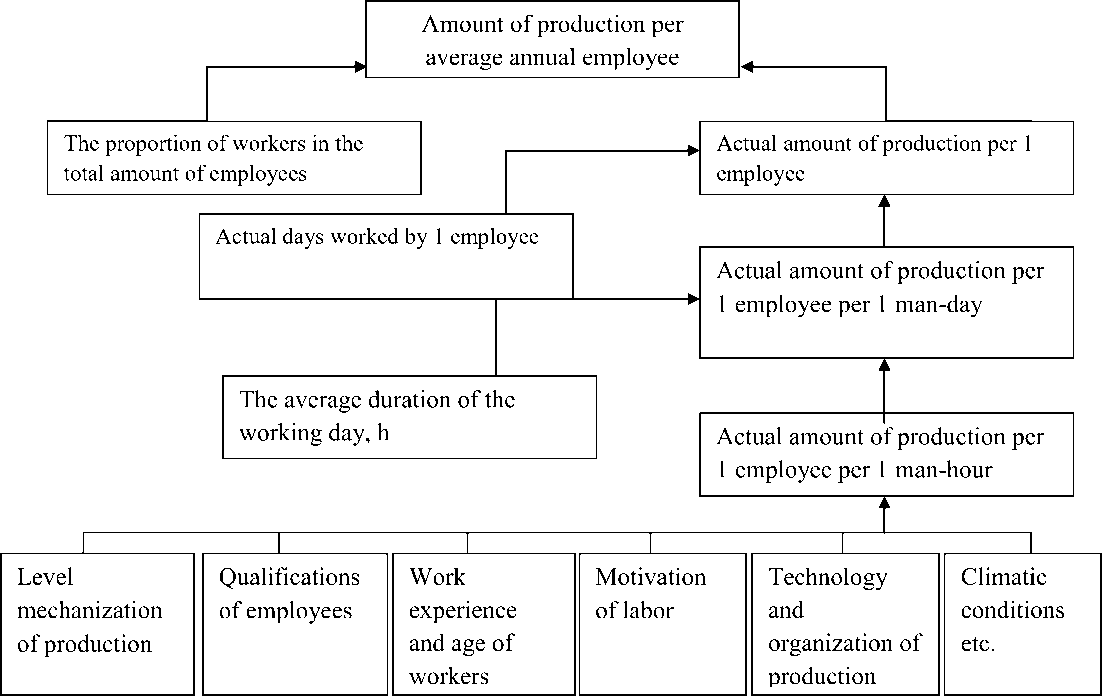
For any organization it is necessary to evaluate not only the level of productivity of worker in particular, but efficiency of entire staff in general. This analysis will enable us to calculate an indicator such as productivity. This is unique measure determining usefulness of a specific work and the rationality of the functioning of one employee in particular. Down below let us observe table 2. Table 2 – Indicators of labour productivity in LLP FF "Arhangelskoe"
|
Factor |
2014 |
2015 |
2016 |
2016 in correspondence with % |
|
|
2014 |
2015 |
||||
|
Received per 1 average annual employee , rub: gross output at current prices |
382,36 |
529,51 |
540,34 |
141,32 |
102,05 |
|
- sales revenue |
382,36 |
529,51 |
600,41 |
157,03 |
113,39 |
|
- sales profit |
28,41 |
33,53 |
60,89 |
214,33 |
181,6 |
|
- net income |
42,98 |
17,19 |
-44,87 |
X |
X |
|
Received per 1 man-hours, rub gross output at current prices |
1,52 |
2,04 |
1,12 |
73,68 |
54,9 |
|
- sales revenue |
1,52 |
2,04 |
1,25 |
82,24 |
61,27 |
|
- sales profit |
0,11 |
0,13 |
0,13 |
118,18 |
100,0 |
|
- net income |
0,17 |
0,07 |
-0,92 |
X |
X |
In 2016, compared to 2014 level of gross output in current prices has significantly grown up for 41.32% , more revenue from sales for 57,03% and more profit from sales for 114,33% per annual average employee. That tendency is considered as a positive factor for the organization.
Having analysed the parameters of given table, it is possible with certainty to declare, that factor of profit per employee is increasing each year. And that tendency indicates the efficient functioning of employees, despite their relative reduction.
Having observed factors of labor productivity, it is necessary to review its factors of volume changing . table 3 is represented down below
Table 3 - Analysis of the influence of factors on the gross output in LLP FF
"Arhangelskoe"
|
Factor |
2015 |
2016 |
deviation (+,-) in 2015 in correspondence with 2014 |
|
The average number of employees - total: |
39 |
40 |
+1 |
|
Actual hours worked by 1 employee |
246 |
245 |
-1 |
|
Gross output in current prices, thousand rubles. |
2152,47 |
2450,64 |
+298,17 |
|
Hourly efficiency, rubles |
137672 |
146499 |
+8827 |
|
The change in gross output due to the number of employees |
X |
X |
-8472,12 |
|
- Actual hours worked |
X |
X |
-525,2 |
|
- Hourly efficiency |
X |
X |
-17824,6 |
Having reviewed the table, it is posible to report, that the increasing level of hour productivity of labour has demonstrated the greatest influence on the growth of Gross output in current prices for 8827 thousand rub., despite of significant decline of worked man-hours per the year by one employee, that had the least impact on change of gross output. This suggests, that most of its employees of organization do their work conscientiously and efficiently. It is definitely a positive factor for the organization.
In the process of analyzing labor productivity, it is also necessary to evaluate the dynamics of labor cost and labor intensity, the completion of the plan for its implementation, the causes and consequences of its deviation. The changes of productiveness depends on the laboriousness, while decline of laboriousness level is concidered to be as a key-factor for increasing of efficiency . In order to check the given data , let us to refer to the table 4.
Table 4 - The dynamics of labor cost and Labor input (laboriousness)
|
Продукция |
Amount of production |
Labor costs |
Labor input (laboriousness) |
Temp of growth of Labor input (laboriousness),% |
Calculated labor costs |
|||
|
g 0 |
g 1 |
2015 г. |
2016 г. |
t 0 |
t 1 |
|||
|
Fish |
85916 |
62427 |
320,0 |
305,0 |
3,72 |
4,89 |
131,45 |
232,23 |
|
Sum |
X |
X |
320 |
305 |
X |
X |
131,45 |
232,23 |
The level of laboriousness has grown up by 1.17 man-hours in comparison of reporting year and base period. It is a consequence of a reduction of capacity of output by 23489 centers. Thus, increasing of laboriousness means that production demands more time, and therefore it should be definitely attributed to the negative trends for the organization. Based on represented data, it clears up, that that due to increased gross output the level of laboriousness has increased as well by 1.34. Therefore the same level of production and laboriousness determines index of basic reserve cost of labor equals 232,23 thousand man-hours. Which implies the necessity for the head of organization to undertake steps to reduce the level of laboriousness.
Table 5 – Impact of factors on the level of production laboriousness in LLP FF "Arhangelskoe"
|
Production |
The productivity of the animals, center |
Direct labor costs, man-hour. |
Direct labor costs per 1 center, man-hour. |
Deviation (+, -),man-hour. |
||||||
|
2015 |
2016 |
2015 |
2016 |
2015 |
calculated value |
2016 |
sum |
Including changes caused by |
||
|
Productiveness |
Costs all together |
|||||||||
|
Fish |
298,9 |
212,1 |
1230,77 |
1182,17 |
4,12 |
5,8 |
5,57 |
1,45 |
1,68 |
-0,23 |
The level of labor costs has grown up by 1,45 man-hours in comparison of reporting year and base period. Such tendency might be explained because of the line of productiveness, which was also decreasing. Decline of direct costs level by 48.6 man-hours entailed the process of reducing of laboriousness by 0.23 manhours.
Regarding such tendencies, it is possible to explain decreasing of animal proactiveness. Obviously, organization has to improve productivity of animals and simultaneously reduce level of laboriousness.
Список литературы Анализ использования трудовых ресурсов и производительности труда
- А.И. Алексеева, Ю.В. Васильев Комплексный экономический анализ хозяйственной деятельности: учебное пособие. -Кнорус: 2016 г. -720 с.
- Комплексный анализ хозяйственной деятельности: учебник и практикум для академического бакалавриата/под ред. В. И. Бариленко. -М.: Издательство Юрайт. -2015 г. -455 с.
