Analysis of 3D-models of artificially deformed crania, using geometric morphometry

Author: Pugacheva E.V., Uchaneva E.N., Kazarnitsky A.A., Gromov A.V.
Journal: Archaeology, Ethnology & Anthropology of Eurasia @journal-aeae-en
Section: Anthropology and paleogenetics
Article in issue: 3 т.50, 2022.
Free access
The study of artificially deformed crania is complicated by difficulties in analyzing curvilinear shapes without reliable reference points for measurement. Methods of geometric morphometrics (GM) help to solve this problem. We generated 3D-models of deformed crania (26 male and 19 female) from burials of different chronological periods of the Okunev archaeological culture (Verkhniy Askiz I, Uybat III and V, Uybat-Charkov, Itkol I and II), Southern Siberia (2600–1700 BC). Using the Landmark IDAV software, each model was transformed into a set of six traditional craniometric landmarks and 450 semi-landmarks regularly distributed over the entire surface of the braincase. For further processing with the Procrustes and principal component analysis, functions of several R-packages (Morpho, Geomorph, and Arothron) were employed. Crania from early Okunev burials were found to have a small deformed area around lambda, spanning the posterior parts of parietal bones and the upper part of the occipital squama. In crania from later Okunev burials, the deformation extends on the parietal area, causing the reduction of cranial height owing to a lesser curvature of the parietal segment. The lateral walls of the braincase, the frontal squama, and the lower part of the occipital squama in such crania are more convex.
Craniology, artificial cranial deformation, geometric morphometrics, 3D-models, Okunev culture
Short address: https://sciup.org/145146795
IDR: 145146795 | DOI: 10.17746/1563-0110.2022.50.3.140-147
Text of the scientific article Analysis of 3D-models of artificially deformed crania, using geometric morphometry
Artificially deformed crania are much rarer employed in craniometric studies than undeformed skulls (Tiesler, 2012: 33; 2014: 4). One of the reasons for this is the difficulty of describing varying patterns of deformation of such crania, using traditional typological schemes (Natahi et al., 2019; Kazarnitsky, Kapinus, Grigoriev, 2021). Another reason is the influence of the deformation on the initial size and shape of the crania, which obstructs the use of their data for studying population history. But the advent of novel methods of morphometric analysis—geometric morphometrics (GM) (Bookstein, 1991, 1997; Slice, 2005; Vasiliev, Vasilieva, Shkurikhin, 2018; and others)—stimulates researchers to turn back to this “inconvenient” object of study (Mayall, Pilbrow, 2018; Natahi et al., 2019; Gromov, Kazarnitsky, 2020; and others).
Unlike “traditional” morphometrics (TM), GM does not employ linear measurements, but rather
coordinates of landmarks placed on objects of any shape, including those problematic for measuring. An additional advantage of GM is the possibility to exclude the influence of the absolute dimensions, which is possible at the stage of central adjustment, scaling, and rotation. Multidimensional statistical methods, including the principal component analysis (PCA), are applicable for analyzing GM data in just the same way they are for TM data (Vasiliev, Vasilieva, Shkurikhin, 2018: 33–124).
In this study, we turn to the collections of crania of the Okunev archaeological culture, known for their artificial deformation (Zhirov, 1940; Benevolenskaya, Gromov, 1997; Gromov, 1998). The history of the study of deformation in those collections reflects the development of methods for describing the shape of the cranial vault. The Okunev culture occupied the Minusinsk basin in Southern Siberia from the 26th to 18th centuries BC (Maksimenkov, 1965; Vadetskaya, 1986: 27–36; Polyakov, Svyatko, 2009). Sites of this culture can be divided into several chronological horizons, gradually changing one another during the continuous development of the culture over a long period of time (Lazaretov, 2019). Three of those horizons contained cranial collections of a satisfactory sample size: the early Uibat (26th–25th centuries BC) and Tas-Khazaa (24th century BC), and the relatively late Chernovaya (22nd–20th centuries BC).
The first mention of the deformed crania from the Okunev Ulus cemetery was made by E.V. Zhirov (1940) in the time when the term “Okunev culture” had not yet been coined. This conclusion by Zhirov was based on visual assessment of the shape of the skull—an easy and convenient though subjective method. Further, Zhirov developed a visual scheme of classification of the types of artificial deformation (Ibid.). However, the absence of objective criteria was likely the reason why later, when the Okunev archaeological culture was singled out by G.A. Maksimenkov (1965), some researchers expressed doubts regarding the cause that produced the specific shape of the Okunev skulls (Alekseev, Gokhman, Tumen, 1987). Only a morphometric study employing metric variables describing the occipital and parietal regions of the cranial vault (indexes of the shape and height of the occiput) was able to demonstrate the artificial nature of the changes in the shape of Okunev skulls (Benevolenskaya, Gromov, 1997). But those indexes have a disadvantage of being dependent on the reference points of the coordinate system put forward by Y.D. Benevolenskaya (1976: 25–28) for describing the occipital region of the skull. If the deformed area does not fit into the region containing the reference points (i.e. the pole of the occiput and the projection of the opistion point on the sagittal suture), the identification of the deformation becomes impossible (Gromov, 2004).
The next step in studying the artificially deformed crania of the Okunev people was related to the transition from measuring single linear distances and calculating their indexes to studying the shape of the sagittal outline in general. This became possible due to the use of GM methods. These are particularly relevant, because in the Okunev skulls, the deformed area can be rather small and then only subtly affects the shape of the vault. In such cases, the severity of the deformation cannot be described via linear measurements.
Our analysis of the sagittal outlines of the deformed crania has demonstrated systematic differences in the patterns of deformation in the early and late Okunev samples (Gromov, Kazarnitsky, 2022). The deformed area in the skulls from the earlier horizons is relatively small and is placed near lambda . It affects the upper part of the occipital squama and the posterior part of the parietal bones, while it likely does not affect the height of the vault. In the later samples, the deformation is stronger pronounced and covers almost the whole parietal region, decreasing the vertical diameter of the skull. However, the variation of the sagittal outline does not reflect all the consequences of the artificial deformation. In order to obtain information regarding the variation of the cranial vault in general and to develop a protocol for analyzing 3D-models, we performed 3D-scanning of the same collections.
Material and methods
Well-preserved skulls displaying visually discernible signs of deformation were selected from the samples of the Okunev culture. The high requirements to the state of preservation have led to a reduction of the sample size as compared to our previous research of the sagittal outlines (Gromov, Kazarnitsky, 2022): 26 male and 19 female skulls were studied instead of 35 and 28, respectively. Crania from the following sites were sampled: Verkhny Askiz I, Uibat III and V, Uibat-Charkov, Itkol I and II (excavated by S.V. Khavrin, A.A. Kovalev, I.P. Lazaretov, A.V. Polyakov, S.V. Morozov). All the collections are presently kept at the Museum of Anthropology and Ethnography RAS.
The skulls were scanned using the RangeVision Spectrum device and the RangeVision ScanCenter NG 2021.2 software, using a medium-sized calibration field. The precision of placing a 3D-landmark was 0.06 mm; projector resolution 1280 × 800 pixels; camera resolution 2048 × 1536 pixels. Each 3D-model was initially exported as a cloud of 1.5 to 2.0 points in the PLY format (3–4 millions of polygons). But later, lighter models (22,500 points, 45,000 polygons) proved to be more convenient.
As our main objective was to analyze variation of the cranial vault, the facial parts of the 3D-models were removed during obtaining the sample via the tools available in RangeVision ScanCenter NG. The need for this removal was related to our intention to use the virtual digitizer of the Geomorph package in R. But later, preference was given to the Landmark IDAV software, and the step of removing the facial parts turned out to be redundant.
Further, the PLY-files were converted to the ASCII format in order to present the raw data as a text rather than a binary document. This was necessary to process the data in various programs, i.e. Landmark IDAV or R-Studio. The type of formatting was changed in MeshLab via switching off the “Binary encoding” variant of extension when exporting a file.
The shape of an object can be described in GM using two types of landmarks. The first is landmarks in a narrow sense, which are placed on homologous elements of the shape defined by strict morphological criteria. Landmarks of this type, in turn, can be divided into three categories: points at the contact between homologous elements; points of maximum curvature (concavity or convexity); and marginally delimiting points. The traditional craniometric points (Alekseev, Debets, 1964: 41–48) all belong to this first type of landmarks. The second type (semilandmarks) was developed for describing smooth spherical or extremely complex shapes, and was, thus, more suitable for our study. Semilandmarks are the points placed at an equal distance from each other along a line connecting “true” landmarks (of the first type). The more semilandmarks are placed the better their array describes the outline of an element of shape; therefore, landmarks of this type are sometimes referred to as “outline semilandmarks” (see (Vasiliev, Vasilieva, Shkurikhin, 2018: 46–53; Pavlinov, Mikeshina, 2002)).
Both types of landmarks were employed in the present study. Six anatomical landmarks and 450 semilandmarks were placed on each of the 3D cranial models in Landmark IDAV (Wiley, 2006). The following craniometric points were employed (Alekseev, Debets, 1964: 45–47): 1) frontomalare orbitale, left; 2) nasion; 3) frontomalare orbitale, right; 4) porion, right; 5) opistion; 6) porion, left. The surface delimited by those points (excluding the cranial base) was evenly filled with semilandmarks divided into two symmetric networks (patches) covering the left and right sides of the cranial vault, 225 (15 × 15) semilandmarks each (Fig. 1). The coordinates of the landmarks and semilandmarks were exported in
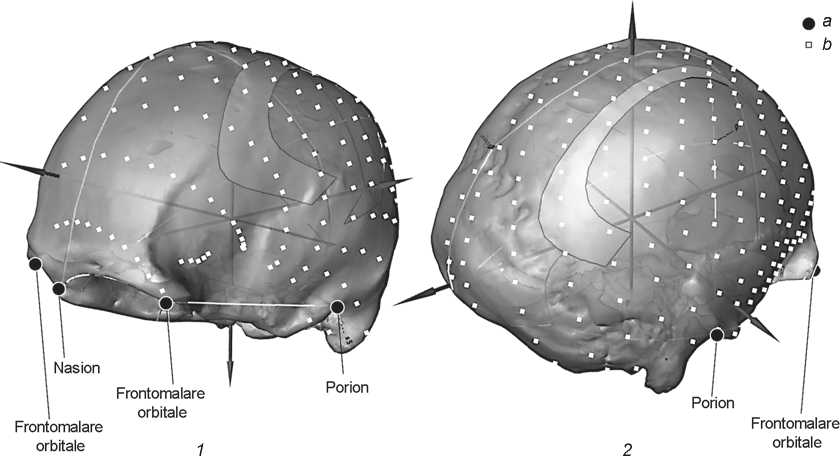
Fig. 1. Landmarks ( a ) and semilandmarks ( b ) on a 3D-model of the cranial vault.
1 – left patch; 2 – right patch.
the PTS format for individual skulls, and in the DTA format for the whole sample.
The following procedures of the Generalized Procrustes Analysis (GPA), including calculation of the mean shape and Procrustes coordinates, PCA, and visualization of the main trends of variation as “heat maps” were carried out in R-Studio. The R language for statistical analyses targets a wide range of users, which makes it relatively easy to master and employ. A large number of open-source program packages have been created to date, using this language. All the functions of R are available for editing and addition by any researcher. By using various packages and editing existing functions, it is possible to develop new statistical algorithms for particular research aims. There are a number of GM packages for creating databases and statistical analyses in R. Three of these were employed in this study: Morpho/Rvcg, Geomorph, and Arothron (Schlager, 2017; Adams, Otarola-Castillo, 2013; Antonio et al., 2021).
Results and discussion
Most of the analyses were carried out in the Morpho and Rvcg packages, created by the same author (Schlager, 2017) and related to each other. The first of the packages contains functions for employing the GM techniques. The second, an immediate extension of the first, can be used for modeling and surface warping. The Geomorph package (Adams, Otarola-Castillo, 2013) largely duplicates the functions of Morpho, and could be used as the main tool of the analysis. However, in this study, we employed only one function of Geomorph, absent in Morpho—computation of a mean 3D-model.
The Arothron package (Antonio et al., 2021) was rather an accessory tool, containing some additional functions widening the possibility of presenting and visualizing the results. This package was specifically developed for visual presentation of anthropological objects. Some of its functions are related to working with 3D-models, virtual reconstructions, and restoration of skeletal elements, while others facilitate the visual representation of the results. One of the functions can be used for creating “heat maps”, which demonstrate local differences in shape via mapping some areas of the object as “warm” (mainly orange) or “cold” (mainly blue) colors.
The algorithm of working in R we followed in this study can be broadly divided into three stages: import of the data, statistical analysis, and visualization of the results in the form of plots and “heat maps”. Morpho and Geomorph were used for the first two stages, while some functions of Arothron and other graphic editors were employed at the third stage.
The read.ply and read.pts functions were utilized for importing the data to the workspace of R. These functions upload PLY-files of 3D-models and PTS-files containing landmark and semilandmark coordinates. These raw data were then transformed to arrays using the list2array function of Morpho in order to prepare the data for further operations.
The mean shape (i.e. the configuration of landmarks describing the average shape of a particular sample) was calculated at the second stage by the ProcGPA function of Morpho. It was extracted using the aggregate and vecx functions, and then a PCA was carried out employing the procSym function of the same package. The PCA values for individual skulls, as well as the proportion of the total variance described by the PCs, were exported for drawing scatterplots in an external graphics editor.
At the last stage, the “heat maps” visualizing the morphological changes associated with particular PCs were created. The areas displaying the highest level of morphological variation are depicted in the 3D-models via the gradations of color (Fig. 2–4), ranging from red and orange (maximum and intermediate expression of a trait—the degree of convexity of an area of the cranial vault in this particular case) to violet and blue (weak or the weakest convexity of an area). The areas exhibiting no shape change were colored in white.
Building a “heat map” requires an averaged 3D-model, and coordinates of the mean shape and the individuals displaying extreme values of the PCs. The averaged 3D-models were created in Geomorph, using the model of one of the skulls in the sample whose shape was the closest to the mean shape. Such skulls have been detected using the findMeanSpeс function, and then the averaged 3D-model was calculated by warpRefMesh . The extraction of the extreme morphological variants was beginning with the creation of the shapes representing the maximal and minimal values of the PCs, using the restoreShapes function in Morpho. These were further transformed employing the thin-plate spline interpolation (Morpho, tps3d ). When all the necessary data were extracted, the “heat maps” representing the “poles” of the morphological variation in the sample were created using the localmeshdiff function of Arothron.
The algorithm outlined above was employed for exploring the trends in variation of the 3D-models of the deformed crania from the Okunev burials.
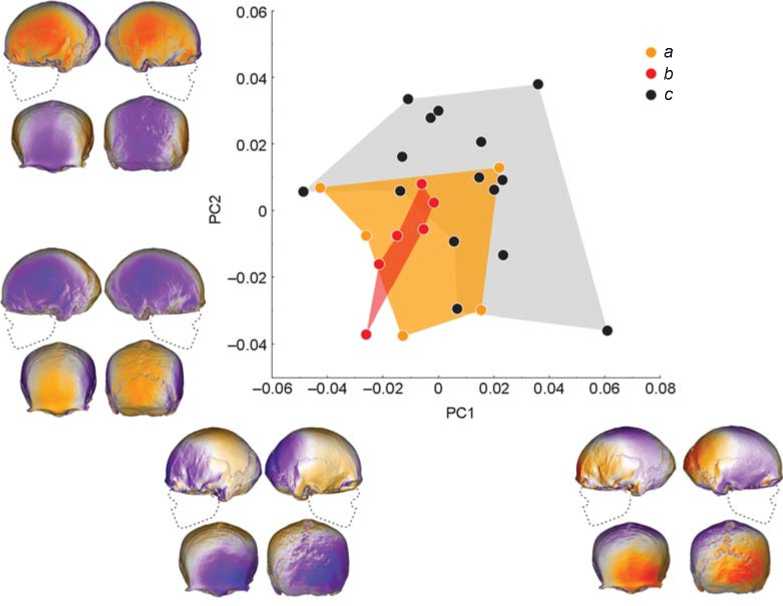
Fig. 2. Principal component analysis of the male sample (PC1 and PC2).
a – Uibat chronological horizon; b – Tas-Khazaa chronological horizon; c – Chernovaya chronological horizon.
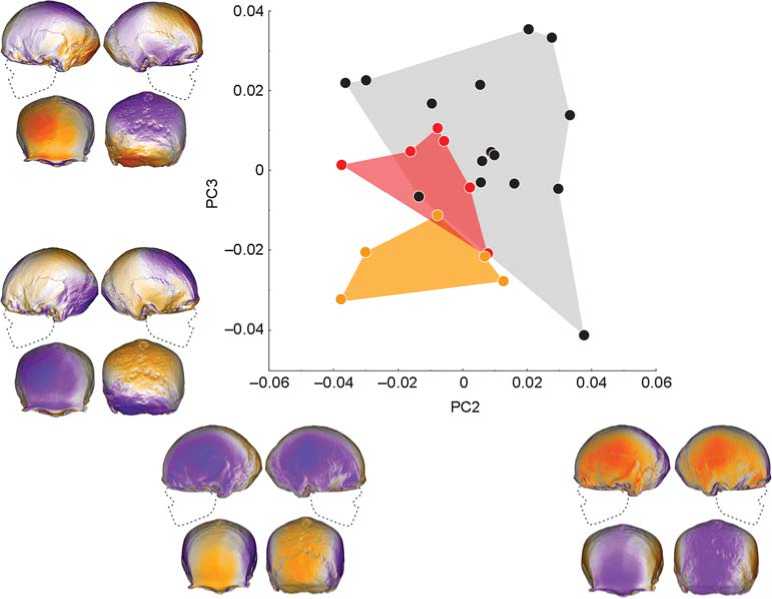
Fig. 3. Principal component analysis of the male sample (PC2 and PC3). Legend same as on Fig. 2.
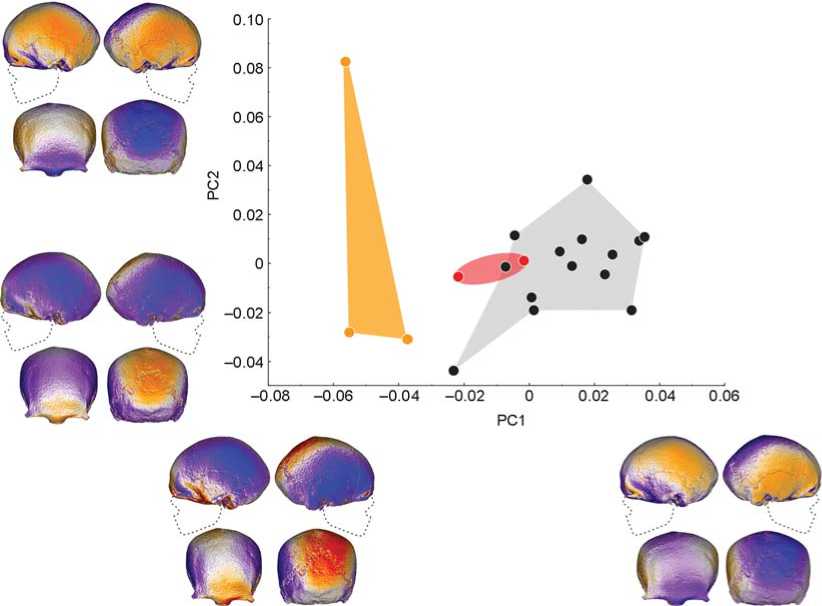
Fig. 4. Principal component analysis of the female sample (PC1 and PC2).
Legend same as on Fig. 2.
The first three PCs of the analysis of the Procrustes coordinates in the male sample account for 38 % of the total variance: PC1 – 15.4 %; PC2 – 12.6 %; PC3 – 10.1 %. The “heat maps” of the cranial models are depicted near the respective axes of the plot (Fig. 2–4) in four projections: left and right lateral, frontal, and occipital. The maps show the shapes associated with minimal negative and maximal positive values of the PCs.
The “heat maps” show that PC1 (see Fig. 2) describes the change from relatively tall vaults (with a more prominent parietal area) to relatively low crania (more bossing in the frontal and occipital parts). PC2 (see Fig. 2, 3) is associated with the variation of the sagittal outline and the width of the vault: a more convex sagittal outline (according to the position of the orange zones along the sagittal axis) is correlated with flatter lateral walls of the vault, and vice versa . These two PCs (see Fig. 2) together account for almost a third of the total variance, and demonstrate the difference between the individuals belonging to the early and late Okunev burials. The former (Uibat and Tas-Khazaa) are usually relatively tall, while the latter (Chernovaya) exhibit a relatively low cranial vault and more convex temporo-parietal areas.
The degree of occipito-parietal flattening is described by PC3 (see Fig. 3): this feature ranges from weak flattening, accompanied by a relatively high parietal curvature, to strong flattening, with more bossing frontal bone and the lower part of the occipital squama. The skulls of the three chronological horizons display the clearest separation in the plot (see Fig. 3): not only are the early groups different from the late groups, but also the two early samples are distinct. The chronologically earliest individuals from Uibat exhibit a combination of the least pronounced occipital-parietal flattening and the least convexity of the lateral walls with a tall cranial vault.
The analysis of the female sample has shown a clear separation of the skulls from different chronological horizons along the first PC, which accounts for 21 % of the total variance (see Fig. 4). This axis describes the variation trend from tall cranial vaults with the least flattening of the parietal bones and the upper part of the occipital squama (with the lateral walls of the walls being vertically oriented) towards relatively low crania displaying a weaker height of the curvature of the vertex (with the temporo-parieatal areas being more convex or bossing). The individuals from Uibat occupy the former pole of PC1, while the skulls from
Chernovaya occupy the latter. The two chronologically intermediate individuals from Tas-Khazaa appeared to be morphologically intermediate as well.
Thus, our analysis of 3D-models of the deformed crania of the Okunev people has demonstrated a gradual change in their morphology at the transition from the early to late periods of the development of the culture, which was likely associated with a modification of the construction of the cradle and/or some accessories placed therein (Benevolenskaya, Gromov, 1997: 293). The pattern of morphological changes with time is the same for males and females.
Conclusions
The analytical algorithm put forward in the present study fosters the application of GM methods for the analysis of 3D-models with free-ware R packages and the Landmark software. The advantages of the algorithm were demonstrated using an example of a sample of deformed crania of bearers of the Okunev archaeological culture. We can recommend using this algorithm in morphological studies of any objects, both biological and archaeological.
Our analysis has shown the differences in the localization of the deformed areas in the Okunev skulls from different chronological horizons. The study of the 3D-models has demonstrated that the increase in the severity of the parietal deformation (which is typical of the individuals from later burials) led to a decrease in the height of the cranial vault due to a flattening of its parietal region, and to an increased convexity of the lateral walls of the skull, frontal bone, and lower part of the occipital squama. Nevertheless, most of the features of shape differentiating the skulls of the early and late horizons reside in the mid-sagittal plane of the vault.
References Analysis of 3D-models of artificially deformed crania, using geometric morphometry
- Adams D.C., Otarola-Castillo E. 2013 Geomorph: An R package for the collection and analysis of geometric morphometric shape data. Methods in Ecology and Evolution, vol. 4 (4): 393-399.
- Alekseev V.P., Gokhman I.I., Tumen D. 1987 Kratkiy ocherk paleoantropologii Tsentralnoy Azii. In Arkheologiya, etnografiya i antropologiya Mongolii (kamenniy vek - epokha rannego zheleza). Novosibirsk: Nauka, pp. 208-241.
- Alekseev V.P., Debets G.F. 1964 Kraniometriya: Metodika antropologicheskikh issledovaniy. Moscow: Nauka.
- Antonio P., Costantino B., Silvia C., Marina M., Paolo P., Alessio V., Pasquale R. 2021 Arothron: An R package for geometric morphometric methods and virtual anthropology applications. American Journal of Physical Anthropology, vol. 176 (1): 144-151.
- Benevolenskaya Y.D. 1976 Problemy etnicheskoy kraniologii: Morfologiya zatylochnoy oblasti cherepa. Leningrad: Nauka.
- Benevolenskaya Y.D., Gromov A.V. 1997 Morfologiya zatylochno-temennoy oblasti cherepov okunevskoy kultury. In Okunevskiy sbornik. St. Petersburg: Petro-RIF, pp. 288-293.
- Bookstein F.L. 1991 Morphometric tools for landmark data: Geometry and biology. Cambridge: Cambridge Univ. Press.
- Bookstein F.L. 1997 Landmark methods for forms without landmarks: Morphometrics of group differences in outline shape. Medical Image Analysis, vol. 1 (3): 225-243.
- Gromov A.V. 1998 K voprosu ob iskusstvennoy deformatsii cherepov okunevskoy kultury. In Sibir v panorame tysyacheletiy: Materialy Mezhdunar. simp., vol. 1. Novosibirsk: IAET SO RAN, pp. 147-156.
- Gromov A.V. 2004 Temennaya i zatylochno-temennaya deformatsiya u drevnego naseleniya sredneyeniseiskikh stepey: Morfologiya i obryad. In OPUS: Mezhdistsiplinarniye issledovaniya v arkheologii, iss. 3. Moscow: Izd. IA RAN, pp. 162-170.
- Gromov A.V., Kazarnitsky A.A. 2020 Shulluktepa: Deformatsiya golovy kak populyatsionniy marker. In Naseleniye rannego zheleznogo veka i Srednevekovya Severnoy Yevrazii po materialam muzeinykh kollektsiy. St. Petersburg: MAE RAN, pp. 575-595. (Sb. MAE; vol. LXVII).
- Gromov A.V., Kazarnitsky A.A. 2022 Iskusstvennaya deformatsiya golovy u rannikh okunevtsev. Arkheologicheskiye vesti, iss. 34: 266-274.
- Kazarnitsky A.A., Kapinus Y.O., Grigoriev A.P. 2021 Ob iskusstvennoy deformatsii cherepov stepnykh kultur epokhi bronzy. Stratum plus, No. 2: 307-318.
- Lazaretov I.P. 2019 Khronologiya i periodizatsiya okunevskoy kultury: Sovremennoye sostoyaniye i perspektivy. Teoriya i praktika arkheologicheskikh issledovaniy, No. 4: 15-50.
- Maksimenkov G.A. 1965 Okunevskaya kultura v Yuzhnoy Sibiri. In Novoye v sovetskoy arkheologii, E.I. Krupnov (ed.). Moscow: Nauka, pp. 168-174. (MIA; No. 130).
- Mayall P., Pilbrow V. 2018 Generalized Procrustes analysis of an ontogenetic series of modifi ed crania: Evaluating the technique of modifi cation in the Migration Period of Europe (4th-7th century AD). American Journal of Physical Anthropology, vol. 166 (1): 156-169.
- Natahi S., Coquerelle M., Pereira G., Bayle P. 2019 Neurocranial shape variation among Tarascan populations: Evidence for varying degrees in artificially modified crania in pre-Hispanic West Mexico (1200-1400 AD). American Journal of Physical Anthropology, vol. 170 (3): 418-432.
- Pavlinov I.Y., Mikeshina N.G. 2002 Printsipy i metody geometricheskoy morfometrii. Zhurnal obshchey biologii, vol. 63 (6): 473-493.
- Polyakov A.V., Svyatko S.V. 2009 Radiouglerodnoye datirovaniye arkheologicheskikh pamyatnikov neolita - nachala zheleznogo veka Srednego Yeniseya: Obzor rezultatov i noviye danniye. In Teoriya i praktika arkheologicheskikh issledovaniy, iss. 5. Barnaul: Izd. Alt. Gos. Univ., pp. 20-56.
- Schlager S. 2017 Morpho and Rvcg - Shape Analysis in R: R-Packages for geometric morphometrics, shape analysis and surface manipulations. In Statistical Shape and Deformation Analysis. New York: Academic Press, pp. 217-256.
- Slice D.E. 2005 Modern Morphometrics in Physical Anthropology. New York: Kluwer Academic / Plenum Publishers.
- Tiesler V. 2012 Studying cranial vault modifications in ancient Mesoamerica. Journal of Anthropological Science, vol. 90: 33-58.
- Tiesler V. 2014 The Bioarchaeology of Artificial Cranial Modifications. New Approaches to Head Shaping and its Meanings in Pre-Columbian Mesoamerica and Beyond. New York: Springer.
- Vadetskaya E.B. 1986 Arkheologicheskiye pamyatniki v stepyakh Srednego Yeniseya. Leningrad: Nauka.
- Vasiliev A.G., Vasilieva I.A., Shkurikhin A.O. 2018 Geometricheskaya morfometriya: Ot teorii k praktike. Moscow: KMK.
- Wiley D.F. 2006 Landmark Editor 3.0. IDAV. Davis: Univ. of California.
- Zhirov E.V. 1940 Ob iskusstvennoy deformatsii golovy. KSIIMK, iss. VIII: 81-88.
