Analysis of an Actively Energized 11/0.415 kV Distribution Transformer Using Power Quality and Energy Analyzer

Author: Pam Paul Gyang, Fubara Edmund Alfred-Abam, Fiyinfoluwa Pelumi Olubodun
Journal: International Journal of Engineering and Manufacturing @ijem
Article in issue: 3 vol.13, 2023.
Free access
The most important equipment utilized by power systems are transformers, which are passive electrical devices suitable for the transfer of electrical energy from one circuit to another which is associated with Electromagnetic (EM) induction. These equipment are important to help maintain network stability and reliability but despite these advantages, they still exhibit problems due to numerous factors such as overloading, poor dielectric strength, bad insulation, thermal degradation which in turn cause abrupt power outages or results in a major electrical system failure. Unfortunately, transformer users are having difficulty keeping an eye on how distribution transformers (DT) are performing when they are being used which contributes to outages. This paper focused on the performance analysis of a DT and the approach which helps to mitigate the difficulties of identifying load imbalance or overloaded DT to provide long-lasting and trouble-free services for power consumers, using Mansard place 1000 KVA, 11/0.415 KV Distribution Transformer (DT) as a case study to obtain the on-load parameters. The (Fluke 435 series II) Power Quality and Energy Analyzer (PQEA) was the equipment utilized to ascertain the reliability measurements of the DT and the experimental method was carried out on the second terminal connection as regards to IS 1180 standard.
Distribution Transformer, Energy Analyzer, Fluke, Insulation, Power quality, Network Stability, Network Reliability, Outages
Short address: https://sciup.org/15018694
IDR: 15018694 | DOI: 10.5815/ijem.2023.03.01
Text of the scientific article Analysis of an Actively Energized 11/0.415 kV Distribution Transformer Using Power Quality and Energy Analyzer
Transformers are integral components of electrical power systems and vital in almost all its applicable sectors such as generation, transmission, and distribution. The applicability may involve the step-up or step-down of voltages depending on the required energy consumption i.e. industrial or domestic usage. In addition, they are made to be robust and reliable equipment capable of delivering higher efficient energy [1]. Since transformer equipment determines the quantity and reliability of power supply, therefore monitoring and maintenance should be made as often as possible in an attempt to lessen system failures. The first used Alternating Current (AC) transformer for lighting was built by P.N. Yablochkov in 1876 and since its invention, transformers have demonstrated to a great extent their significance and applicability in today’s world [2]. The principle of operations concerning transformers involves the mutual inductance effect of two different circuits which are connected by a common magnetic field. There are two main compartments in a transformer i.e. the primary and secondary windings. The primary winding is made up of coils useful for drawing power from the source while the secondary winding is the coil that receives energy via electromagnetic induction from the primary winding and delivers the changed voltage to the load [3,4].
Furthermore, the shell type and core type are the two main cores in a transformer, the shell type wraps the component in a laminated core while the core type windings are turned in the laminated core. Different kinds of transformers can be identified via the output voltage rating of the practical turns of the wires on each section [5]. The number of turns in the primary and secondary sections is characterized by N p and N s, with the voltages at both ends represented by V p and V s hence, resulting in the Eqn:
N p V p N s V s
So, if the input winding voltage is lesser than the output voltage, the secondary section has more wire turns than that of the primary side. This means the output voltage significantly increased hence known as the step-up transformer on the other hand if the output voltage is lesser than the input the transformer is then a step-down type. The Distribution Transformer (DT) usually operates as a step-down type [6]. The distribution transformers are mostly used at the end of the electrical delivery system because they are designed to relatively supply small amounts of power to residential areas. The major function of the DT is to supply the final voltage transformation in the power network and step down the output employed in the distribution line to the users rating [7]. However, losses at the distribution level within the Nigerian Electricity Supply Industry (NESI) have contributed significantly to the inconsistent power supply to end customers in Nigeria over the years. The number of power outages that occur over a specific time period in a specific area has been specifically linked to the partial or total failure of distribution transformers. Some of the unusual causes for the subpar condition of distribution transformers in Nigeria are not implausible [8]. The majority result from the technical staff members in charge of this equipment being careless [9]. Consistent checks on the transformers' operational status could help prevent some faults.
In recent years, several researches have been done to reduce the failure rate of a distribution transformer. Most of these failures are caused by a lack of a proper protection system at the distribution substation and failure of the core and bushings [10]. These failures can be averted by constant monitoring of the transformer parameters (i.e. voltage, current, frequency, harmonics, etc.) [11]. In 2016, a reliability assessment was carried out on a transformer to determine its current status and mode of operation. Daily records of the number and duration of the transformer outages were captured to determine the effectiveness [12]. Tenbohlen et al. proposed that use of a data survey can help know the health condition of a transformer and hence avert the failure that can affect the generation, transmission or distribution transformers. From the result obtained, the hazard curve function revealed the cause of failure rate as against the age of the transformers [13]. Consequently, to obtain the transformer data for analysis purposes, specific tools and equipment are required to accurately capture the parameters on an energized 11/0.415kV distribution transformer [14]. In this paper, one of those equipment called the Power Quality Energy Analyzer (PQEA) will be explored for analysis of an energized 11/0.415kV distribution transformer. The PQEA helps in retrieving the following parameters from on-load distribution transformers: phase-to-phase voltage, phase-to-neutral voltage, power factor (PF), and Total Harmonic Distortion (THD) [15] .
This paper outlines an experimental methodology using an on-load 1000 KVA, 11/0.415 kV distribution, and a Power Quality Energy Analyzer (PQEA). This strategy provides a trustworthy experimental method for assessing the performance of distribution transformers using the recommended power quality equipment. The approach assists engineers in charge of maintenance and operations in taking a swift decision in terms of fault.
2. Method and Data Collection Approach of the Distribution Transformer
-
a) Conceptual Framework
To date, the Nigerian distribution sectors still face a series of difficulties in terms of the performance of the Distribution Transformer (DT) being utilized by the power utility companies. This may be a result of having too many DTs assigned to several designated feeders. Hence, there must be a keen approach to monitoring and identifying weak DTs in order to improve the reliability to ensure the quality and functionality of the electrical supply of the Nigerian electricity supply industry (NESI). At the distribution level, the actual consumed power by customers is known as true power or active power or real power measured in Watt (W), and the Power Factor (PF) is the ratio of the average power to the apparent power measured in Volt-Amperes (VA), which is the product of voltage and current magnitudes. Thus, the mathematical representation of the power factor is expressed in terms of phasor voltage and current as regards to equations:
Average Power P
PowerFactor = ApparentPower = S (2)
Since DTs are inductive loads, complex power in the transformer is given as:
5 = VI
Substituting (4) into (3)
This can also be expressed as:
I = I P + j Q
5 = VI p + jVl Q
5 = P + jQ
5 = 4P 2 + Q
Where, S = Apparent Power in Volt Ampere (VA), V= Voltage, I * = Current in an inductive load, P = Active or Real Power in Watts (W), Q = Reactive Power in Volt-Amp Reactive, and Ip & I q = Reactive Currents.
Therefore, the active power in the transformer is expressed as:
P = 3VVLIL cosd
Or
P-431 J , cosd ph ph
Where, V L & V ph = line and phase voltage respectively, Il & I ph = line and phase current respectively, and cos 6 = Power Factor (Phase angle difference). Hence, the conceptual framework as seen in figure 1 describes the relationship between the dependent and independent variables. The conceptualization of this research work involves the use of key equipment to determine the reliability assessment of the Mansard Place distribution transformer. The method demonstrates how the selected distribution transformer connects with the PQEA device and feeder pillar to obtain the DT performance index.
INDEPENDENT VARIABLES
DISTRIBUTION TRANSFORMER
DT Component efficiency level
DEPENDENT VARIABLE
POWER QUALITY AND ENERGY ANALYZER
TRANSFORMER PERFORMANCE
Device for monitoring electrical parameters
Performance characteristics of the Mansard place 1000 KVA 11/0.415 KV
FEEDER PILLAR
Electrical power control equipment
Fig. 1. Block Diagram of the Conceptual Framework
-
b) Experimental Process and Expectation
This section shows the experimental procedure and method involved in order to extract the readings from the distributed transformer using the PQEA device. From the conceptual framework block diagram in figure 1, the experimental expectation will show the performance of the DT, this process helps to determine the lifespan of the transform.
The experimental method involves obtaining the current readings, voltage readings, phase-to-phase voltage, and phase-to-neutral voltage etc., from the DT for 60 minutes and the approach includes the use of Power Quality and Energy Analyzer (PQEA) - Fluke 435 Series II, to obtain operational parameters from the Mansard place 1000 KVA, 11/0.415 KV DT.
The PQEA is practically connected to the DT with the transformer fully in operation to determine the on-load efficiency and general performance of the DT. Figure 2 shows the circuit diagram connection of the PQEA to the DT, while the feeder line is actively energized with consumers on electricity supply.
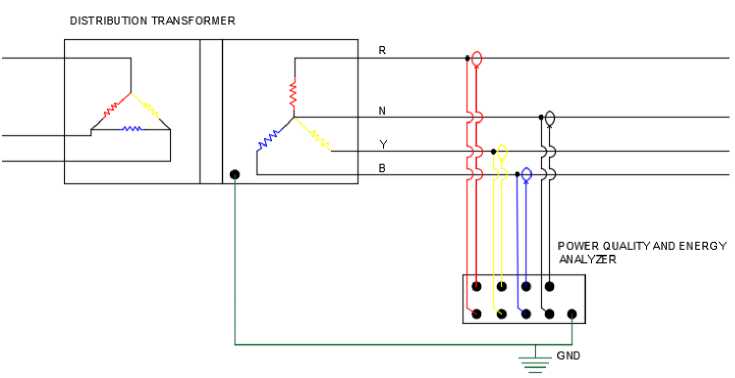
Fig. 2. Circuit diagram of the experimental connection of the PQEA to the DT.
The experimental process shown in figure 3 can be followed sequentially to carry out the technical analysis.
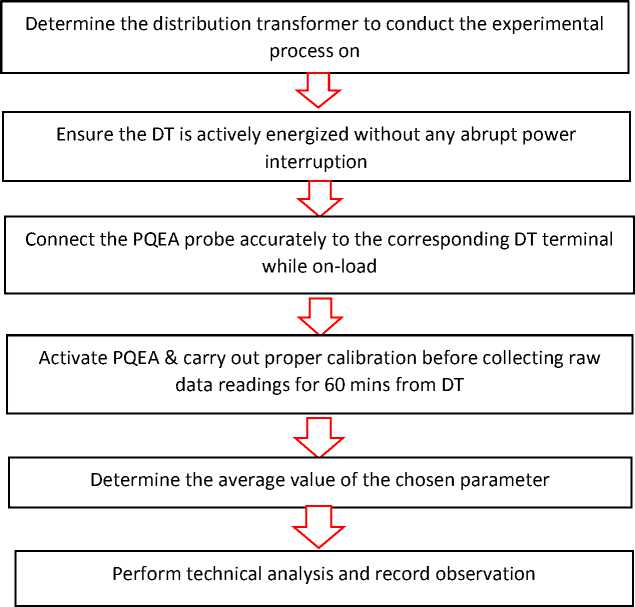
Fig. 3. Data collection process and analysis of the DT using PQEA
The stepwise connection of the PQEA to the DT is outlined below:
1. The four voltage probes of the PQEA are connected to the secondary terminal of the distribution transformer.
2. The four current probes of the PQEA are connected around the cable of each phase and neutral of the DT
3. Ensure proper calibration setup of the PQEA for expected solution time interval
4. Ensure Proper grounding of both the DT and PQEA
5. The duration for capture is set on the PQEA and named for it to be easily tracked on the device.
6. The captured data is then accessed by the power logger software for analysis purposes.
7. Disconnect PQEA after the reading has been extracted from the DT
8. Export readings from the PQEA device and carry out the analysis using python matplotlib application to determine the DT performance.
3. Result and Discussion
secondary side cables.
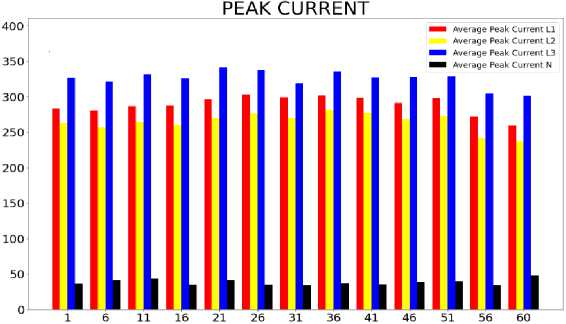
The reliability analysis of the Mansard place 1000 KVA distribution transformer shows the power flow results in form of tables and histogram plots. The corresponding peak current for the 3-phases range from 236.8A to 344.8A, having a peak current (neutral) of 47.8A. Likewise, the results for the peak voltage, phase-to-neutral, and phase-to-phase voltages fall within the acceptable limit of the standard of 230V and 415V, which can be seen in the tables below.
Table 1. Chart 1: Peak Current for Mansard Place 1000kVA
|
TIME (Minute) 5 Minute Interval |
Average Peak Current (RED PHASE) (Ampere) |
Average Peak Current (YELLOW PHASE) (Ampere) |
Average Peak Current (BLUE PHASE) (Ampere) |
AVERAGE Peak Current (NEUTRAL) (Ampere) |
|
1 |
282.4 |
262.6 |
326.2 |
36.4 |
|
6 |
280.2 |
256.2 |
321.2 |
41.2 |
|
11 |
286.6 |
264.6 |
331.2 |
43 |
|
16 |
287.4 |
260.2 |
325.4 |
34.6 |
|
21 |
296 |
269.6 |
341 |
41.2 |
|
26 |
302.8 |
276.6 |
337.6 |
34.4 |
|
31 |
298.8 |
269.6 |
318.4 |
33.8 |
|
36 |
301.6 |
281.2 |
335 |
37 |
|
41 |
298.6 |
276.8 |
326.4 |
35 |
|
46 |
290.8 |
268.4 |
327.2 |
38.2 |
|
51 |
297.8 |
272.6 |
328.8 |
39.6 |
|
56 |
271.8 |
241.6 |
304.2 |
34 |
|
60 |
259.4 |
236.8 |
301 |
47.8 |
-
Fig. 4. Average Peak Current Variation
As shown in table 1 and figure 4., the analysis was done for an hour with the highest peak current on blue phase recorded as 341 Amperes, on Yellow Phase was 281.2 Amperes and on Red Phase was 301.6 Amperes for a time interval of five minutes. This disparity of peak current readings between the phases resulted in peak current on the Neutral. Therefore, to drastically reduce the flow of current on the Neutral, there is need for load balancing on the DT.
Table 2. Chart 2: Peak Voltage for Mansard Place 1000kVA
|
Time |
Peak Voltage Red N Avg |
Peak Voltage Yellow N Avg |
Peak Voltage Blue N Avg |
Peak Voltage NG Avg |
|
1. |
306.6 |
311.6 |
308.2 |
3 |
|
6. |
306.6 |
311.9 |
307.6 |
3.1 |
|
11. |
306.6 |
312 |
307.7 |
3.3 |
|
16. |
306.7 |
311.7 |
307.8 |
3.3 |
|
21. |
307.8 |
313.2 |
309.2 |
3.3 |
|
26. |
307.4 |
312.6 |
308.2 |
3.5 |
|
31. |
307.5 |
312.5 |
308.1 |
3.4 |
|
36. |
307.8 |
312.6 |
308.5 |
3.4 |
|
41. |
308.9 |
313.3 |
309.6 |
3 |
|
46. |
307.7 |
312.5 |
309 |
3 |
|
51. |
308.2 |
313.1 |
309.1 |
3 |
|
56. |
306.5 |
311.9 |
307.9 |
3 |
|
60. |
309.6 |
315.4 |
310.9 |
3.1 |
-
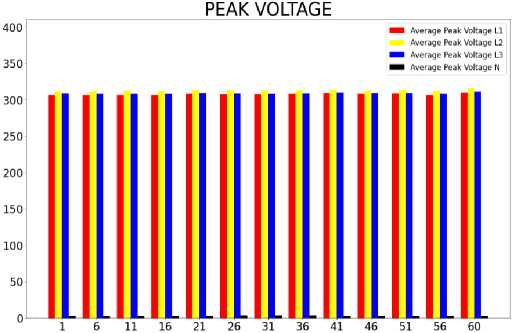
Fig. 5. Average Peak Voltage Variation.
Table 2 and figure 5 represented the average peak voltage on the DT and the voltage in the system should be 311.08 Volts. It is seen from the chart that the peak voltage across the three phases falls around the system peak voltage value, which shows that the DT is not overloaded. This can be established from the percentage loading of the transformer when calculated by first getting the average phase peak current resulted in a value of 329.6A, which shows that the actual percentage loading value is 24.80%. From the percentage loading value obtained and information deduced in figure 5, it is on a good note to say that the Mansard Place 1000KVA DT is not overloaded at its existing state.
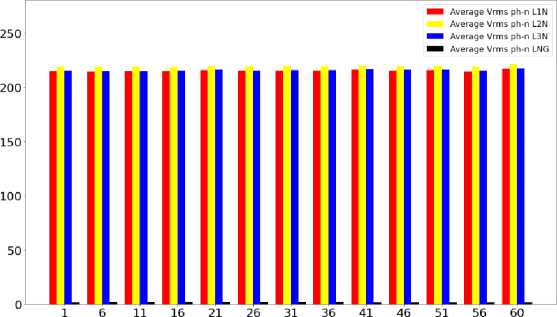
Table 3 and figure 6 represented the average phase to neutral voltage on the DT and the value for this voltage in the system should be 220 Volts. After a careful analysis review of the table values, the yellow phase is in close with this value, but the red and blue phases slightly deviate. However, it is seen from the chart that the phase to neutral voltage across the three phases are in consonance with the system peak voltage value, which further reassures that the DT is not overloaded.
Table 3. Chart 3: Phase to Neutral Voltage
|
Time |
Vrms ph-n Red N Avg |
Vrms ph-n Yellow N Avg |
Vrms ph-n Blue N Avg |
Vrms ph-n NG Avg |
|
1. |
214.8 |
218.86 |
215.44 |
1.8 |
|
6. |
214.74 |
218.98 |
215.12 |
1.88 |
|
11. |
214.76 |
219.08 |
215.1 |
1.98 |
|
16. |
214.82 |
218.92 |
215.22 |
1.98 |
|
21. |
215.7 |
219.76 |
216.14 |
1.98 |
|
26. |
215.24 |
219.58 |
215.58 |
2.14 |
|
31. |
215.24 |
219.68 |
215.74 |
2.08 |
|
36. |
215.5 |
219.58 |
215.94 |
2.02 |
|
41. |
216.28 |
220.06 |
216.58 |
1.78 |
|
46. |
215.6 |
219.6 |
216.28 |
1.8 |
|
51. |
215.78 |
219.84 |
216.32 |
1.82 |
|
56. |
214.7 |
218.92 |
215.5 |
1.8 |
|
60. |
217.08 |
221.3 |
217.72 |
1.82 |
PHASE TO NEUTRAL VOLTAGE
-
Fig. 6. Average Phase to Neutral Voltage Variation
Table 4. Chart 4: Phase to Phase Voltage
|
Time |
Vrms ph-ph Red 2 Avg |
Vrms ph-ph Yellow 3 Avg |
Vrms ph-ph Blue Avg |
|
1. |
373.98 |
377.38 |
372.92 |
|
6. |
374.1 |
377.18 |
372.54 |
|
11. |
374.06 |
377.26 |
372.66 |
|
16. |
373.94 |
377.1 |
372.96 |
|
21. |
375.36 |
378.68 |
374.54 |
|
26. |
374.8 |
377.98 |
373.72 |
|
31. |
375.02 |
378.06 |
373.9 |
|
36. |
375.18 |
378.06 |
374.34 |
|
41. |
376.38 |
379.24 |
375.24 |
|
46. |
375.4 |
378.5 |
374.5 |
|
51. |
375.88 |
378.68 |
374.62 |
|
56. |
374.04 |
377.26 |
373 |
|
60. |
378.22 |
381.3 |
376.88 |
PHASE TO PHASE VOLTAGE
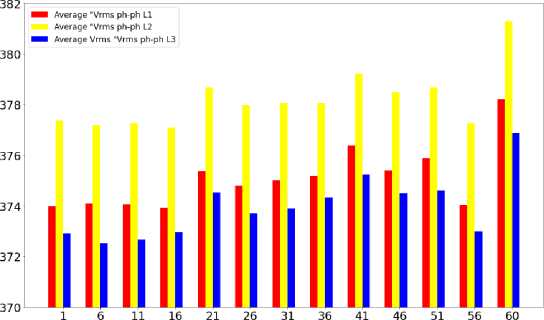
Fig. 7. Average Phase-to-Phase Voltage Variation
4. Conclusions
Lastly, as observed in table 4 and figure 7 the average phase-to-phase Vrms range from 373 to 378, 377 to 381, and 372 to 376 for the red, yellow, and blue phases respectively which is close to the standard 400V for a 3-phase supply. From the foregoing analysis, the range of all the average phase-to-phase Vrms falls below Nigerian standard and specification, hence maintenance of the transformer is required.
The reliability analysis assessment was successfully carried out on the Mansard Place, 1000KVA distribution transformer using (Fluke 435 series II) Power Quality and Energy Analyzer. The experimental procedure involved the collection of the on-load DT indices. The analysis was carried out for 60 minutes at an interval of 5 minute and the readings obtained showed the DT was not overloaded but requires load balancing. One of the implications of having an imbalance load on a transformer is that it decreases the DT life expectancy. Hence, the effective monitoring of the DTs' performance should be often put into consideration for several power utility companies and other related services. This paper has presented a comprehensive approach with detailed information for researchers in the power utility industry as a means to address the difficulties in identifying imbalance or overloaded DT to improve power distribution system effectiveness.
The significance of this research is to make recommendations for the maintenance and operational engineers in order to assist them in identifying and carrying out corrective measures regarding overloaded or imbalanced distribution transformers in the network.
References Analysis of an Actively Energized 11/0.415 kV Distribution Transformer Using Power Quality and Energy Analyzer
- [1]A. et al., “A review on fault detection and condition monitoring of power transformer,” International Journal of ADVANCED AND APPLIED SCIENCES, vol. 6, no. 8, pp. 100–110, Aug. 2019, doi: 10.21833/ijaas.2019.08.014.
- R. Lucas, “Historical Development of the Transformer.” [Online]. Available: https://www.researchgate.net/publication/238088967
- K. Rauff, A. Rilwan, U. Farouk, and D. Joshua, “Construction of a Simple Transformer to Illustrate Faraday’s Law of Electromagnetic Induction along Side Mutual Inductance,” Physical Science International Journal, vol. 12, no. 1, pp. 1–5, Jan. 2016, doi: 10.9734/psij/2016/28280.
- O. S. Olusola, “DESIGN OF 500kVA, 11/0.415kV SUBSTATION.”
- P. R. Kareem, “TRANSFORMER: Working principle of transformer Fuel Cells Powered Cascaded Multilevel Converter View project Modelling and Simulation of three phase inverter feed from Wind Turbine based Matlab/Simulink View project,” 2019. [Online]. Available: https://www.researchgate.net/publication/332874982
- N. E. Mastorakis, M.-C. Popescu, and N. Mastorakis, “Modelling and simulation of step-up and step-down transformers Analysis and Synthesis of perturbed Duffing oscillators’ View project Library Science View project Modelling and Simulation of Step-Up and Step-Down Transformers.” [Online]. Available: https://www.researchgate.net/publication/289878978
- P. Shil and T. Anderson, “Distribution Transformer Health Monitoring and Predictive Asset Maintenance SAS ® Enterprise Guide ® , SAS ® Enterprise MinerTM, and SAS ® Visual Analytics were used to efficiently produce the information necessary for operational decision-making from gigabytes of smart meter data.” [Online]. Available: www.EPRI.com
- A. Airoboman, “Reliability of Telecommunication Industries View project Power Systems Analysis View project.” [Online]. Available: http://uniabuja.ujet.ng
- T. K. Bala, “Performance Test of Faulty Distribution Transformers along the Streets and Roads of Port Harcourt.” [Online]. Available: www.iosrjournals.orgwww.iosrjournals.org
- C. Ndungu, J. Nderu, L. Ngoo, and P. Hinga, “A Study of the Root Causes of High Failure Rate of Distribution Transformer - A Case Study,” Int J Eng Sci (Ghaziabad), vol. 6, no. 2, pp. 14–18, Feb. 2017, doi: 10.9790/1813-0602021418.
- B. A. Ahmad, H. H. Elsheikh, and A. Fadoun, “Review of Power Quality Monitoring Systems.”
- S. D. Fabiyi, A. J. Falade, S. D. Fabiyi, and A. Abdulkarim, “Reliability Assessment of Power Transformers for Oshogbo Area Control Center in Nigeria,” 2016. [Online]. Available: https://www.researchgate.net/publication/323541718
- S. Tenbohlen, F. Vahidi, J. Gebauer, M. Krüger, and P. Müller, “ASSESSMENT OF POWER TRANSFORMER RELIABILITY.”
- H. Liu, Z. Zhang, J. Zhang, X. Huang, Z. Wang, and L. Zhao, “Study on winding looseness of power transformer based on vibration,” in IOP Conference Series: Materials Science and Engineering, 2019, vol. 486, no. 1. doi: 10.1088/1757-899X/486/1/012032.
- M. Herman bin Jamaluddin and M. Sulaiman, “Motion And Energy Optimization Of Vision Guided Manipulator For Optimal Dynamic Performance Study the impacts of penetration of Double Feed Induction Generators (DFIG) wind farm on reactive Power flow in an Isolated Grid System-a 50 MW wind farm case study View project A New Adaptive Simplified Fuzzy Logic Controller For Depth Control Of Underwater Remotely Operated Vehicle In The Presence Of Uncertainties View Project.” [Online]. Available: https://www.researchgate.net/publication/242492443
