Analysis of Experimental Research Results Focused on Improving Student Psychological Health

Author: Akhrorov Voris Yunusovich, Farruh Ahmedov, Komiljon Norboyev, Farrukh Zakirov
Journal: International Journal of Modern Education and Computer Science @ijmecs
Article in issue: 2 vol.14, 2022.
Free access
The students' psychological health in high education is still being a problematic issue. This article describes the importance of ensuring students' psychological health in higher education today and related empirical research results. The aim of this paper is exploring and analysis research results focused on students' psychological health. To determine the students' psychological health there were used special psychodiagnostic methods. The components of the psychological health were divided as 1) satisfaction level; 2) perceptions of a healthy lifestyle; 3) emotional stability; 4) psychoemotional state; and 5) attitude towards themselves. Obtained results on students' psychological health indicate specific conclusions about various psychological health indicators and the relationship between behaviour and internal health, including in emotional, cognitive and behavioural areas. The results of this research work showed that one of the important indicators of students' psychological health is a decrease in the level of emotional distress and emotional instability (neuroticism, nervousness), a positive change in students' internal state, and an increase in students' satisfaction with their educational environment. The results could be used in the high education system, especially measuring and monitoring students' psychological health.
Student, psychological health, neuroticism, anxiety, stability, instability, self-esteem, learning environment
Short address: https://sciup.org/15018374
IDR: 15018374 | DOI: 10.5815/ijmecs.2022.02.02
Text of the scientific article Analysis of Experimental Research Results Focused on Improving Student Psychological Health
Today, globalisation processes, the rapid development of "mass culture", the issue of youth spiritual development in adolescence and adulthood, factors affecting the psyche of such individuals, and mental health are considered scientific research priorities in psychology. In particular, research in medicine, psychology and pedagogy has considered how higher education institutions inform students' positive attitudes towards health as a sustainable value, including helping ensure and strengthen health; the urgency of these issues is reflected in the “Comprehensive action plan in mental health for 2013-2020” approved in 2013 by the World Health Assembly [1].
The following are being researched on an international scale: one’s attitude towards one's own health as a value, conceptions of the theoretical and research field of social health psychology, specific health treatments as a social phenomenon, social psychological models of healthy behaviour, education and training programs that can change such behaviour, attitude towards and components of health. At the same time, there is a need to identify psychological and pedagogical factors in ensuring students’ psychological health in higher education.
In the Republic of Uzbekistan, comprehensive support for young people and decisions on healthy lifestyles among the population have increased people’s welfare by achieving high economic growth and ongoing reforms to address problems of daily life to ensure students’ psychological health in higher education institutions, thus expanding their capabilities. The urgency of this problem is determined by the fact that the theoretical and practical aspects of the psychological and pedagogical factors of ensuring the students’ psychological health in higher education institutions are insufficiently developed. Most university students are at an age when they have developed certain psychological health patterns, and in stressful environments, some disorders develop, and they begin to lose a clear understanding of the value of their health. Therefore, the issue of providing psychological support is urgent.
A number of foreign scholars were described some particular characteristics of psychological conditions of person in dfferent age and sex categories. Also, historical remarks of the psychological state of personality were studied by the authors [2, 3, 4]. While, it is important to indicate that psychological health of students who studiy in high education have not been studied. Therefore, a number of authors emphasize the psychological health of the sudents. Good psychological and metal health is esseential for students to manage the challenges that university life presents. Furthermore, as it was noted by the authors that good psychological conditions impact to improving learning different field of knowlede such computer technologies [5]. Also, it is important to indicate that good mental and psychological helth of human is effective during the COVID 19 pandemic situation [6]. For this reason it is worth to explore the human mental and psychological health as well as students psychological state [7].
The problem of the psychological health and it is importance have been studied by the other authors such as Brekhman, Gurvich and Fengrui [8, 9, 10]. They have conducted scientific research on psychological health problems of personality. However, the psychological health of students and it’s scientific bases in high education is still staying one of the problematic issues. This approach offers the teachers and students to effective measure and monitor students’ psychological health in high education. For this reason, this paper focuses the exploring the psychological health in the context of high education.
The literature analysis showed that till this time there were no deeply research works that focused to study students’ psychological condition in high education. The large number of scholars interested in this line of investigation indicates its relevance and importance in the field of psychology. Research on this psychological condition of the students has involved by the authors. For example, there is research on the mental health, the health and personality, community and psychological stress and others [11, 12, 13]. Nevertheless, available researches and obtained results do not the meet the demands current trends of the problem. The fact that the scientific research and experimental results on this research topic are not unanimous once again confirms the relevance of the research topic.
The results of other studies has shown that the some negative aspects did not only lead to physical, technological, and economical challenges to education for students, but also psychosocial challenges (such as hopelessness and high level of distrust for the existing educational systems) that may affect the way student engage and commit to their education in the post-pandemic world. This provides educational stakeholders including policy makers the adequate data needed to understand how exactly students have been affected and supportive measure to implement as tertiary institutions reopen for learning [14, 15]. It should be noted that according to the research analysis, the psychological and pedagogical factors involved in ensuring students’ psychological health in higher education are poorly studied using systematic approaches. Thus the aim of this paper is exploring and analysis research results focused on students’ psychological health.
2. Materials and methods
To determine students’ psychological health, in this experiment, we used a set of psychodiagnostic methods that allowed us to identify some components of psychological health. Thus, we studied the following:
1) Students’ satisfaction with the educational environment of the higher education institution (using the developed by us "Questionnaire to study the students’ satisfaction level with the educational environment of higher education"); Students' perceptions of a healthy lifestyle (using the developed by us "Questionnaire to study students' perceptions of a healthy lifestyle"); 2. Students’ emotional stability – their level of emotional imbalance (neuroticism, anxiety) (using the “Neuroticism” scale of Eysenck personality inventory, ЕРI); 3. Students’ psychoemotional state (using B. Phillips’s method, “Determining the anxiety level in the learning environment”); 4. Students’ attitude towards themselves (using Dembo-Rubinstein’s self-assessment methodology).
3. Results and Discussion
The experimental work was carried out in three stages (Fig. 1): First (determinant) stage (first section – the initial condition until the experimental effect was applied) – Experimental (n-217) and control (n-203) groups were formed on the basis of a selection group (n-420) consisting of higher education institutions students. With the help of psychodiagnostic methods included in the diagnostic complex, we studied the socio-psychological features of the students’ psychological health and analysed the frequency and correlation of the interaction level (or difference) in their intermediates, by comparison the correlation between the groups’ indicators in the initial state, i.e., before the experimental effect, with the indicators later in the experiment. Second (formative) stage (experimental effect) – I experimental group of students (n-217) carried out the activities specified in the "Experimental program for students’ psychological health in higher education environments" developed by the author, i.e., the experimental exposure of this group. Third (control) stage (second section – the final condition after the experimental effect was applied) – This stage determined the effectiveness of the experimental activities, that is, of the "Experimental program to ensure students’ psychological health in higher education environments" developed by the author on the basis of mathematical statistical methods. In this stage, we examined the socio-psychological characteristics of psychological health by comparing the experimental (n-217) and control (n-203) groups’ results in the initial state; that is, an analysis of the correlation (or differentiation) between the pre-experimental effects and the final, post-experimental effects was performed. Additionally, at this stage, the effectiveness of the author's program was determined, conclusions were drawn from the scientific research results, and implementation recommendations were developed.
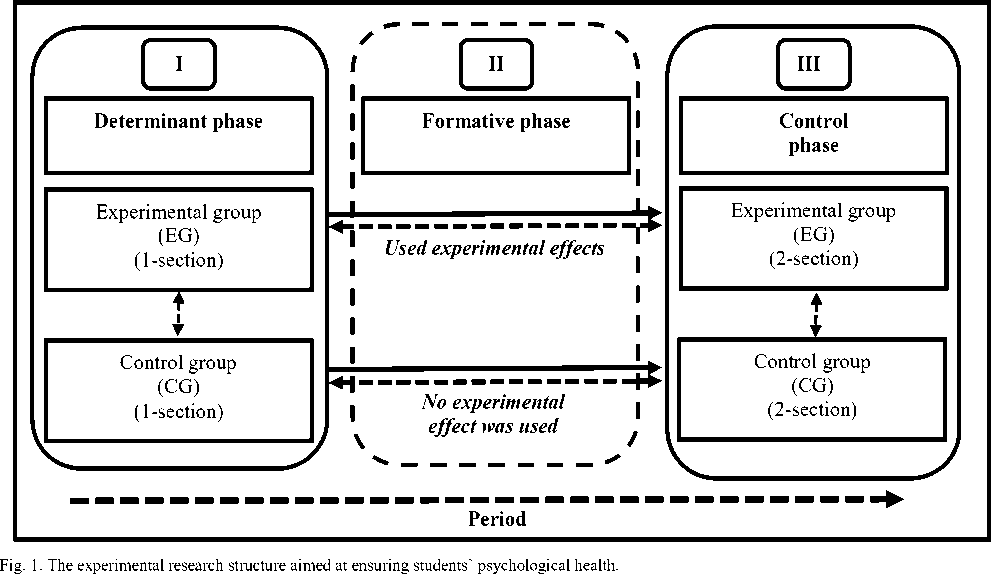
Experimental work with the competition group was conducted in the following ways: with the experimental group (n-217): in the determinant stage (the first section, before the experimental effect occurred), in the formative stage (when the experimental effect occurred), and in the control stage (the second section, after the experimental effect occurred); with the control group (n-203): in the determinant and control stages (no experimental effect was observed in students of this group). In this experimental study, we set out to test the following hypotheses: First hypothesis – Regarding the indicators of the experimental (n-217) and control (n-203) groups included in the selection group determined in the initial state, i.e., before the experimental effect occurred (first section): H0 – There is no correlation between the indicators before and after the experimental effect occurred; H1 – There is such a correlation, and it is statistically significant. Second hypothesis – Regarding the experimental group indicators (n-217) included in the selection group in the initial state, i.e., before the experimental effect (first section) and in the final state, i.e., after the experimental effect (second section): H 0 – There is no difference (or it is not statistically reliable, and it exhibits a random character that is not related to the experimental effect); H 1 – There is a difference (it is statistically reliable and an experimental effect result that is not random). Third hypothesis – Regarding between the first (first section) and second (second section) control indicators (n-203) of the two groups: H 0 – There is no correlation; H 1 – A correlation exists and is statistically reliable. Fourth hypothesis – Regarding the difference between the experimental (n-217) and control (n-203) groups included in the sample group in the final state, i.e., in the second section after the experimental effect: H0 – The difference is not considered statistically reliable, and it exhibits a random character unrelated to the experimental effect; H1 – The difference is the result of the experimental effect, and it does not have a statistically reliable or random character.
The educational environment in higher education institutions is an indicator of mental and emotional status and an integral part of psychological health. Thus, we examined students’ level of satisfaction with the learning environment based on 11 structural descriptions and a student satisfaction index regarding the learning environment. A description of the level of satisfaction with the learning environment is presented in Table 1.
Table 1. Indicator of the level of satisfaction with the educational environment of higher education institutions (based on the average value of points, n-420)
|
Descriptions |
Measurement units |
||
|
Average value |
Satisfaction level |
Rank |
|
|
1) Interaction with professors and teachers |
1.47 |
Intermediate |
I |
|
2) Interaction with groupmates |
1.39 |
Intermediate |
II |
|
3) Attention to requests and suggestions |
1.33 |
Intermediate |
III |
|
4) Ability to maintain self-esteem |
1.25 |
Intermediate |
IV |
|
5) Emotional comfort |
1.24 |
Intermediate |
V |
|
6) Self-respect |
1.23 |
Intermediate |
VI |
|
7) Access to assistance |
1.22 |
Intermediate |
VII |
|
8) Opportunity to express one’s views |
1.18 |
Intermediate |
VIII |
|
9) Opportunity to take the initiative in activities |
1.15 |
Intermediate |
IX |
|
10) Understanding of one’s personal problems and difficulties |
1.00 |
Intermediate |
X |
|
11) Help available for making decisions |
1.00 |
Intermediate |
X |
The analysis results showed that the students' satisfaction with the learning environment was at an intermediate level. Additionally, the following indicators were identified in descending order of importance on these criteria: Criteria such as “interaction with professors and teachers” (first place), “interaction with groupmates” (second place), and “attention to requests and suggestions” (third place) were important indicators related to the educational environment; Criteria such as “ability to maintain self-esteem” (fourth place), “emotional comfort” (fifth place), and “self-respect” (sixth place) were indicators of intermediate importance in the educational environment.
“Access to assistance” (seventh place), “the opportunity to express one’s views” (eighth place), “opportunity to take the initiative in activities” (ninth place), “understanding of one’s personal problems and difficulties” and “help available for making decisions” (tied for tenth place) were insignificant indicators related to the learning environment.
Thus, a study of the level of satisfaction with the learning environment in higher education institutions shows that the majority of participants find the learning environment insufficient. “Ability to maintain self-esteem”, “emotional comfort”, “self-esteem”, “access to assistance”, “opportunity to express one’s views”, “opportunity to take the initiative in activities” and “understanding of one’s personal problems and difficulties”, and “help available for making decisions” indicate that students struggle to develop an awareness of mental and emotional status as an integral part of psychological health. Students’ perceptions of a healthy lifestyle were identified through our “Questionnaire to study students’ perceptions of a healthy lifestyle”. The experimental results on what students considered a healthy lifestyle to comprise are reflected in Table 2.
Table 2. Results of the “Questionnaire to study students' perceptions of a healthy lifestyle” (n-420)
|
Descriptions |
Measurement units |
||
|
Number |
Percent |
Rank |
|
|
1) Be free from drug addiction |
102 |
24.3 |
I |
|
2) Play sports |
66 |
15.7 |
II |
|
3) Not be addicted to alcohol, not smoking |
48 |
11.4 |
III |
|
4) Have a responsible sex life |
41 |
9.8 |
IV |
|
5) Have a healthy spiritual life |
37 |
8.8 |
V |
|
6) Have healthy and proper nutrition |
31 |
7.4 |
VI |
|
7) Live a meaningful life |
29 |
6.9 |
VII |
|
8) Have a positive attitude towards oneself |
25 |
6.0 |
VIII |
|
9) Engage in self-development, improvement |
21 |
5.0 |
IX |
|
10) Maintain family relationships |
20 |
4.8 |
X |
The analysis of the experimental results allowed us to draw a number of conclusions regarding the students’ conception of what constitutes a healthy lifestyle. In particular, according to respondents, the most important criteria are as follows: be free from drug addiction – 24,3% (first place); play sports – 15,7% (second place); not be addicted to alcohol and not smoking – 11,4% (third place); have a responsible sex life – 9,8% (fourth place); have a healthy spiritual life – 8,8% (fifth place); have healthy and proper nutrition – 7,4% (sixth place); live a meaningful life – 6,9%
(seventh place); have a positive attitude towards oneself – 6,0% (eighth place); engage in self-development or improvement – 5,0% (ninth place); and maintain family relationships – 4,8% (tenth place).
Thus, the students’ perception of what a healthy lifestyle comprises includes only abstinence from negative habits, playing sports, and healthy and proper nutrition. “Live a meaningful life” (seventh place), “have a positive attitude towards oneself” (eighth place), “engage in self-development, improvement” (ninth place), and "maintain family relationships" (tenth place), which are important factors of a healthy lifestyle, were also mentioned; while these factors alone are not sufficient, this finding indicates that the students understand the need to understand and address their psychological health. This is in line with modern views on healthy living (e.g., that health is not limited to physical health).
It is obvious that the most important part of maintaining and ensuring one’s health is achieving internal harmony: among one’s lifestyle, values, and inner world and with one’s environment. Therefore, understanding certain actions and consequences as a psychological health indicator is important in shaping students' perceptions of what constitutes a healthy lifestyle. Another component of students’ psychological health is their psycho-emotional status, which can be expressed as anxiety, emotional stability, resilience and satisfaction with the educational environment of higher education institutions. We considered the frequency analysis results of the experimental and control group indicators included in the selection group in the initial state, i.e., before the experimental effect occurred (first section). According to Eisenk's personality inventory, among the group, 20.5% of students showed a high level of emotional instability, 62.4% showed an intermediate level of emotional instability and 17.1% showed a low of emotional instability. There were no significant differences between the experimental and control groups (low level – EG-17,1%, CG-17,2%; intermediate level – EG-63,6%, CG-61,1%; high level – EG-19,4%, CG-21,7%). The results obtained are reflected in Table 3.
Table 3. Emotional stability (stagnation) in students – an indicator of instability manifestation (instability, anxiety)
|
Group |
Low level (0-10 score) |
Intermediate level (11-14 score) |
High level (15-24 score) |
|||
|
Number |
Percent |
Number |
Percent |
Number |
Percent |
|
|
1) Neuroticism scale |
||||||
|
EG(n-217) |
37 |
17.1 |
138 |
63.6 |
42 |
19.4 |
|
CG (n-203) |
35 |
17.2 |
124 |
61.1 |
44 |
21.7 |
|
Total (n-420) |
72 |
17.1 |
262 |
62.4 |
86 |
20.5 |
Notes: EG-experimental Group; CG-Control Group.
An examination of students’ emotional states suggests that levels of nervousness and emotional instability were high. This suggests that such students may experience emotional-affective behaviours in life (both positive and negative) and may have difficulty adapting to their circumstances. This indicator confirms that students may experience discomfort and a state of imbalance. This can lead to negative consequences and various psychosomatic problems. An analysis of students' emotional stability – (neuroticism, anxiety) – confirmed that in some students, the presence of an unpleasant internal emotional state can lead to a decrease in their psychological health.
Phillips's method for determining the anxiety level in the learning environment was used to analyse the students’ scores as a percentage; that is, the scales were converted to a 100% system. This methodology allows the interpretation of results at three levels: up to 50% (intermediate), 51-75% (above intermediate) and 76-100% (Table 4). This, in turn, makes it possible to perform statistical analysis on the basis of the frequency (occurrence, repetition of a particular sign) with which the scales provide different levels of confirmation (answer research questions). When this methodology was applied to examine the manifestation of anxiety in the learning environment (n-420), the following was found: high-level indicators included “weak physiological resistance to stress” (45,7%), “fear of not meeting the expectations of others” (43,6%), “fear of self-expression” and “fear of testing knowledge” (each 32,6%). Indicators with above intermediate levels– were “frustration with the need to work for success” (42,4%), “general anxiety” (42,1%), “social stress” (35%), and “problems and fears in relationships with professors” (33,6%). There were no found significant differences between the experimental and control groups.
Table 4. An indicator of the level of anxiety manifestation in the learning environment among students
|
Selection group |
Intermediate (0-50%) |
Above intermediate (51-75%) |
High (76-100%) |
||||||
|
Number |
Percent |
Number |
Percent |
Number |
Percent |
||||
|
1) General anxiety scale |
|||||||||
|
EG (n-217) |
107 |
49.3 |
92 |
42.4 |
18 |
8.3 |
|||
|
CG (n-203) |
101 |
49.8 |
85 |
41.9 |
17 |
8.4 |
|||
|
Total (n-420) |
208 |
49.5 |
177 |
42.1 |
35 |
8.3 |
|||
|
2) Social stress scale |
|||||||||
|
EG (n-217) |
120 |
55.3 |
74 |
34.1 |
23 |
10.6 |
|||
|
CG (n-203) |
110 |
54.2 |
73 |
36.0 |
20 |
9.9 |
|||
|
Total (n-420) |
230 |
54.8 |
147 |
35.0 |
43 |
10.2 |
|
3) Frustration with the need to dig for success scale |
||||||
|
EG (n-217) |
80 |
36.9 |
93 |
42.9 |
44 |
20.3 |
|
CG (n-203) |
74 |
36.5 |
85 |
41.9 |
44 |
21.7 |
|
Total (n-420) |
154 |
36.7 |
178 |
42.4 |
88 |
21.0 |
|
4) Fear of self-expression scale |
||||||
|
EG (n-217) |
102 |
47.0 |
44 |
20.3 |
71 |
32.7 |
|
CG (n-203) |
94 |
46.3 |
43 |
21.2 |
66 |
32.5 |
|
Total (n-420) |
196 |
46.7 |
87 |
20.7 |
137 |
32.6 |
|
5) Fear of testing knowledge scale |
||||||
|
EG (n-217) |
101 |
46.5 |
45 |
20.7 |
71 |
32.7 |
|
CG (n-203) |
96 |
47.3 |
41 |
20.2 |
66 |
32.5 |
|
Total (n-420) |
197 |
46.9 |
86 |
20.5 |
137 |
32.6 |
|
6) Fear of not meeting the expectations of others scale |
||||||
|
EG (n-217) |
94 |
43.3 |
28 |
12,9 |
95 |
43,8 |
|
CG (n-203) |
89 |
43.8 |
26 |
12,8 |
88 |
43,3 |
|
Total (n-420) |
183 |
43.6 |
54 |
12,9 |
183 |
43,6 |
|
7) Weak physiological resistance to stress scale |
||||||
|
EG (n-217) |
79 |
36.4 |
39 |
18,0 |
99 |
45,6 |
|
CG (n-203) |
75 |
36.9 |
35 |
17,2 |
93 |
45,8 |
|
Total (n-420) |
154 |
36.7 |
74 |
17,6 |
192 |
45,7 |
|
8) Problems and fear in the relationship with professors scale |
||||||
|
EG (n-217) |
115 |
53.0 |
73 |
33.6 |
29 |
13.4 |
|
CG (n-203) |
107 |
52.7 |
68 |
33.5 |
28 |
13.8 |
|
Total (n-420) |
222 |
52.9 |
141 |
33.6 |
57 |
13.6 |
Notes: EG-experimental Group; CG-Control Group.
This, in turn, suggests that almost half of the students who participated in the study had an internal mental health disorder. From this, it is possible to form a generalised picture of anxiety manifestation in students on the basis of their results using this method (those found to have “above intermediate” or "high" scores on these scales).
It can be observed that weak physiological resistance to stress manifests in students as anxiety in the learning environment, a history of anxiety, certain developments in social relations (primarily with peers), fear of not meeting the expectations of others (conformity, that is, the importance of others in evaluating one’s performance, actions, and opinions), fear of self-expression (negative experience with situations related to self-disclosure and the demonstration of one’s capabilities), knowledge, success, capability testing (especially in public) while showing a negative attitude, anxiety, the development of a need for success, the achievement of high results, an uncomfortable history that does not allow one to open up to others, the inability to resist stress, a reduction in resilience to stressogenic situations, a specific trait that manifests as increasing inadequacy, and a destructive response to environmental concerns.
Studies show that during adolescence, the volume and depth of a person’s perception changes rapidly, and selfawareness and reflection on personal "I" become the main states of mental development [16]. Based on this idea, Dembo-Rubinstein's self-assessment methodology was used. This method allows researchers to study characteristics of people's self-esteem, how they perceive themselves, their mood and level of maturity, the presence of problems, their critical thinking skills, their self-assertion abilities, and their life satisfaction. The results of Dembo-Rubinstein’s selfassessment methodology are presented in Table 5. When this methodology was applied to examine the students’ selfassessments (n-420), the following was found: low-level indicators included “self-confidence” (67,1%), “appearance” (69,3%), “being able to do many things on your own, skilfulness” (69,0%) and “health” (52,4%); high-level indicators included “character” (32,1%) and “mind, ability” (31,2%). There were no found significant differences between the experimental and control groups.
Table 5. Indicators of students’ self-assessment based on the Dembo-Rubinstein method
|
Selection group |
Low level |
Adequate assessment level |
High level |
|||
|
Number |
Percent |
Number |
Percent |
Number |
Percent |
|
|
1) Health scale |
||||||
|
EG (n-217) |
114 |
52.5 |
44 |
20.3 |
59 |
27.2 |
|
CG (n-203) |
106 |
52.2 |
41 |
20.2 |
56 |
27.6 |
|
Total (n-420) |
220 |
52.4 |
85 |
20.2 |
115 |
27.4 |
|
2) Mind, ability scale |
||||||
|
EG (n-217) |
101 |
46.5 |
49 |
22.6 |
67 |
30.9 |
|
CG (n-203) |
94 |
46.3 |
45 |
22.2 |
64 |
31.5 |
|
Total (n-420) |
195 |
46.4 |
94 |
22.4 |
131 |
31.2 |
|
3) Character scale |
||||||
|
EG (n-217) |
104 |
47.9 |
44 |
20.3 |
69 |
31.8 |
|
CG (n-203) |
96 |
47.3 |
41 |
20.2 |
66 |
32.5 |
|
Total (n-420) |
200 |
47.6 |
85 |
20.2 |
135 |
32.1 |
|
4) Respect from peers scale |
||||||
|
EG (n-217) |
133 |
61.3 |
32 |
14.7 |
52 |
24.0 |
|
CG (n-203) |
123 |
60.6 |
29 |
14.3 |
51 |
25.1 |
|
Total (n-420) |
256 |
61.0 |
61 |
14.5 |
103 |
24.5 |
|
5) Being able to do many things on your own, skilfulness |
||||||
|
EG (n-217) |
150 |
69.1 |
30 |
13.8 |
37 |
17.1 |
|
CG (n-203) |
140 |
69.0 |
28 |
13.8 |
35 |
17.2 |
|
Total (n-420) |
290 |
69.0 |
58 |
13.8 |
72 |
17.1 |
|
6) Appearance scale |
||||||
|
EG (n-217) |
151 |
69.6 |
34 |
15.7 |
32 |
14.7 |
|
CG (n-203) |
140 |
69.0 |
32 |
15.8 |
31 |
15.3 |
|
Total (n-420) |
291 |
69.3 |
66 |
15.7 |
63 |
15.0 |
|
7) Self-confidence scale |
||||||
|
EG (n-217) |
145 |
66.8 |
34 |
15.7 |
38 |
17,5 |
|
CG (n-203) |
137 |
67.5 |
31 |
15.3 |
35 |
17.2 |
|
Total (n-420) |
282 |
67.1 |
65 |
15.5 |
73 |
17.4 |
Notes: EG-experimental Group; CG-Control Group.
As seen from the table, more than half of the students (intermediate 49.4%) had low self-esteem, while 21% had high self-esteem (extremely high self-esteem). There were no significant differences between the experimental and control groups. Having a high level of self-esteem indicates that there may be self-esteem overestimation, and there may be certain deviations in personality formation. Excessive self-esteem can prove that a person is immature, unable to properly evaluate his or her performance, and unable to compare him or herself with others; such a self-esteem level may indicate significant disturbances in personality formation (indifference to one’s own mistakes, failure, risk). Underestimation of one's own abilities indicates the individual’s unhealthy development. In such an assessment, two different psychological phenomena can be observed: real self-doubt and the use of a “protective shell”.
From the data in the above tables regarding the frequency analysis, it can be seen that the experimental and control groups did not differ significantly from each other in the initial state, i.e., before the experimental effect occurred (first section), which shows that the psychological features studied were manifested to almost the same extent. To confirm this conclusion reliability, the interrelation of the experimental and control groups in the initial state, i.e., before the experimental effect occurred (first section), was considered on the basis of Pearson's correlation coefficient and Student's t-test, which aim to assess differences in intermediate indicator values (Table 6).
Table 6. Description of the correlation analysis of the experimental and control group interaction before the experimental effect occurred (in the first stage)
|
Methods and scales |
Correlation index (EG & CG) |
|
Eysenck's personality inventory methodology |
|
|
1) Neuroticism |
0.820** |
|
Phillips's method for determining the anxiety level in the learning environment |
|
|
1) General anxiety |
0.949** |
|
2) Experiencing social stress |
0.484** |
|
3) Frustration with the need to work for success |
0.299** |
|
4) Fear of self-expression |
0.488** |
|
5) Fear of testing knowledge |
0.581** |
|
6) Fear of not meeting the expectations of others |
0.640** |
|
7) Weak physiological resistance to stress |
0.546** |
|
8) Problems and fear in the relationship with professors |
0.438** |
|
Dembo-Rubinstein's self-assessment methodology |
|
|
1) Health |
0.243** |
|
2) Mind, ability |
0.276** |
|
3) Character |
0.211** |
|
4) Respect from peers |
0.188** |
|
5) Being able to do many things on your own, skilful hands |
0.237** |
|
6) Appearance |
0.245** |
|
7) Self-confidence |
0.197** |
Notes: EG-experimental Group; CG-Control Group; *р<0.05 – r= 0.14, **р<0.01 – r= 0.18.
The results of the Pearson's correlation analysis show that the experimental and control groups had similar initial states, i.e., before the experimental effect occurred (first section), which allowed us to conclude that there was a mutually significant correlation between the groups (r emp >r cr (0,18) when the statistical significance is р<0,01). To ensure more reliable data, the differences in the performances of the two groups were also analysed on the basis of Student’s t-test (Table 7).
Table 7. Analysis of the difference between the experimental and control group indicators before the experimental effect occurred (in the first stage)
|
Methods and Scales |
Selection group |
||||
|
EG |
CG |
Student’s t-test |
|||
|
M |
σ |
M |
σ |
||
|
Eysenck’s personality inventory methodology |
|||||
|
1) Neuroticism |
12.94 |
3.14 |
12.97 |
2.38 |
0.233 |
|
Phillips’s method for determining the anxiety level in the learning environment |
|||||
|
1) General anxiety |
11.11 |
4.18 |
11.22 |
3.66 |
1.189 |
|
2) Experiencing social stress |
5.71 |
1.87 |
5.79 |
1.80 |
0.638 |
|
3) Frustration with the need to work for success |
7.50 |
2.23 |
7.51 |
2.18 |
0.081 |
|
4) Fear of self-expression |
3.69 |
1.62 |
3.61 |
1.57 |
0.695 |
|
5) Fear of testing knowledge |
3.71 |
1.59 |
3.77 |
1.45 |
0.602 |
|
6) Fear of not meeting the expectations of others |
2.96 |
1.47 |
2.89 |
1.43 |
0.800 |
|
7) Weak physiological resistance to stress |
3.12 |
1.34 |
3.14 |
1.33 |
0.277 |
|
8) Problems and fear in the relationship with professors |
4.68 |
1.23 |
4.74 |
1.18 |
0.602 |
|
Dembo-Rubinstein’s self-assessment methodology |
|||||
|
1) Health |
4.93 |
1.81 |
5.00 |
1.91 |
0.459 |
|
2) Mind, ability |
5.08 |
1.83 |
5.22 |
1.95 |
0.892 |
|
3) Character |
4.93 |
1.86 |
4.89 |
1.94 |
0.236 |
|
4) Respect from peers |
4.49 |
1.76 |
4.34 |
1.74 |
0.978 |
|
5) Be able to do many things on his own, skilfulness |
4.33 |
1.83 |
4.22 |
1.81 |
0.717 |
|
6) Appearance |
4.64 |
1.87 |
4.50 |
1.79 |
0.905 |
|
7) Self-confidence |
4.75 |
1.78 |
4.61 |
1.66 |
0.902 |
Notes: EG-experimental Group; CG-Control Group *р<0.05, t=1.96, **р<0.01, t=2.58, ***р<0.001, t=3.29.
Student’s t-test showed that the data were statistically reliable (р<0,001), allowing us to conclude that there was no significant difference between the initial indicators of the experimental and control groups, i.e., pre-experimental exposure (first section). Additionally, H1 (alternative) for our hypothesis about the existence of a correlation (and no significant differences) between the experimental and control groups’ indicators in the initial and intermediate stages, i.e., before the experimental effect occurred (first section) was confirmed, and the result was statistically valid. Thus, the analysis examined the structural components of the psychological health of university students in the sample (psychoemotional position, anxiety, self-esteem); the results indicated which activities should be included in the experimental program to ensure students’ psychological health in the higher education environment developed by the author—that is, there was reliable confirmation that the experimental effect was minimal.
The structural components of the psychological health of university students (psychoemotional position, anxiety, self-esteem) that were assessed above informed the activities of the experimental program to ensure the students’ psychological health in higher education institution environment developed by the author. That is, to study the situation after the experimental effect occurred, the results were used to determine the effectiveness of the program on two indicators: the interrelationships between the indicators in the first section (before the experimental effect occurred) and second section (after experimental effect occurred) were assessed using frequency analysis, Pearson's correlation coefficient, and Student's t-test, which aimed to assess differences in the values of the intermediate indicators. Lowda states that an analysis of data should follow the methodologies listed above.
Let us look at the data obtained using the frequency of neuroticism from Eisenk's personality inventory. The first section (before the experimental effect occurred) and second section indicators (after the experimental effect occurred) on this scale showed intermediate differences, an increase in low indicators of neuroticism in the EG (+39.2%) and a decrease in the intermediate (-19.8%) and high (-19.4%) indicators (Table 8). There were also insignificant changes in the CG (decreases in the low and intermediate indexes (-1.9% and -1.5%, respectively) and a + 3.4% increase in the high index).
Table 8. A description of indicators of neurotic features in students in the experimental stages
|
Scales |
Selection group |
Experimental stage |
Low level |
Intermediate level |
High level |
|||
|
Number |
Percent |
Number |
Percent |
Number |
Percent |
|||
|
Neuroticism |
EG |
Section 1 |
37 |
17.1 |
138 |
63.6 |
42 |
19.4 |
|
Section 2 |
122 |
56.2 |
95 |
43.8 |
0 |
0.0 |
||
|
Shift |
+85 |
+39.2 |
-43 |
-19.8 |
-42 |
-19.4 |
||
|
CG |
Section 1 |
35 |
17.2 |
124 |
61.1 |
44 |
21.7 |
|
|
Section 2 |
31 |
15.3 |
121 |
59.6 |
51 |
25.1 |
||
|
Shift |
-4 |
-1.9 |
-3 |
-1.5 |
7 |
3.4 |
||
Notes: EG-experimental Group; CG-Control Group.
Thus, these data indicate that emotional stability in the experimental group underwent a significant change during the experiment, suggesting that this indicator of students' psychological health developed in a positive direction. The measure application outlined in the experimental program above has shown a positive effect on the students’ personality of the experimental group. Next, we review the data obtained using Phillips’s method of determining the anxiety level in the learning environment by occurrence frequency (Table 9).
Table 9. Description of indicators of anxiety level manifestation in the learning environment in the experimental stages
|
Scales |
Selection group |
Experimental stage |
Intermediate |
Above intermediate |
High |
|||
|
Number |
Percent |
Number |
Percent |
Number |
Percent |
|||
|
1) General anxiety |
EG |
Section 1 |
107 |
49.3 |
92 |
42.4 |
18 |
8.3 |
|
Section 2 |
196 |
90.3 |
21 |
9.7 |
0 |
0.0 |
||
|
Shift |
+89 |
+41.0 |
-71 |
-32.7 |
-18 |
-8.3 |
||
|
CG |
Section 1 |
101 |
49.8 |
85 |
41.9 |
17 |
8.4 |
|
|
Section 2 |
87 |
42,9 |
82 |
40.4 |
34 |
16.7 |
||
|
Shift |
-14 |
-6.9 |
-3 |
-1.5 |
17 |
8.3 |
||
|
2) Social stress |
EG |
Section 1 |
120 |
55.3 |
74 |
34.1 |
23 |
10.6 |
|
Section 2 |
202 |
93.1 |
9 |
4.1 |
6 |
2.8 |
||
|
Shift |
+82 |
+37.8 |
-65 |
-30.0 |
-17 |
-7.8 |
||
|
CG |
Section 1 |
110 |
54.2 |
73 |
36.0 |
20 |
9.9 |
|
|
Section 2 |
97 |
47.8 |
69 |
34.0 |
37 |
18.2 |
||
|
Shift |
-13 |
-6.4 |
-4 |
-2.0 |
17 |
8.3 |
||
|
3) Frustration with the need to work for success |
EG |
Section 1 |
80 |
36.9 |
93 |
42.9 |
44 |
20.3 |
|
Section 2 |
177 |
81.6 |
40 |
18.4 |
0 |
0.0 |
||
|
Shift |
+97 |
+44.7 |
-53 |
-24.5 |
-44 |
-20.3 |
||
|
CG |
Section 1 |
74 |
36.5 |
85 |
41.9 |
44 |
21.7 |
|
|
Section 2 |
71 |
35.0 |
75 |
36.9 |
57 |
28.1 |
||
|
Shift |
-3 |
-1.5 |
-10 |
-5.0 |
13 |
6.4 |
||
|
4) Fear of self-expression |
EG |
Section 1 |
102 |
47.0 |
44 |
20.3 |
71 |
32.7 |
|
Section 2 |
137 |
63.1 |
45 |
20.7 |
35 |
16.1 |
||
|
Shift |
+35 |
+16.1 |
+1 |
+0.4 |
-36 |
-16.6 |
||
|
CG |
Section 1 |
94 |
46.3 |
43 |
21.2 |
66 |
32.5 |
|
|
Section 2 |
90 |
44.3 |
39 |
19.2 |
74 |
36.5 |
||
|
Shift |
-4 |
-2.0 |
-4 |
-2.0 |
8 |
4.0 |
||
|
5) Fear of testing knowledge |
EG |
Section 1 |
101 |
46.5 |
45 |
20.7 |
71 |
32.7 |
|
Section 2 |
140 |
64.5 |
43 |
19.8 |
34 |
15.7 |
||
|
Shift |
+39 |
+18.0 |
-2 |
-0.9 |
-37 |
-17 |
||
|
CG |
Section 1 |
96 |
47.3 |
41 |
20.2 |
66 |
32.5 |
|
|
Section 2 |
90 |
44.3 |
38 |
18.7 |
75 |
36.9 |
||
|
Shift |
-6 |
-3.0 |
-3 |
-1.5 |
9 |
4.4 |
||
|
6) Fear of not meeting the expectations of others |
EG |
Section 1 |
94 |
43.3 |
28 |
12.9 |
95 |
43.8 |
|
Section 2 |
146 |
67.3 |
57 |
26.3 |
14 |
6.5 |
||
|
Shift |
+52 |
+24.0 |
+29 |
+13.4 |
-81 |
-37.3 |
||
|
CG |
Section 1 |
94 |
43.3 |
28 |
12.9 |
95 |
43.8 |
|
|
Section 2 |
85 |
41.9 |
23 |
11.3 |
102 |
50.2 |
||
|
Shift |
-9 |
-1.4 |
-5 |
-1.6 |
7 |
6.4 |
||
|
7) Weak physiological resistance to stress |
EG |
Section 1 |
79 |
36.4 |
39 |
18.0 |
99 |
45.6 |
|
Section 2 |
146 |
67.3 |
57 |
26.3 |
14 |
6.5 |
||
|
Shift |
+67 |
+30.9 |
+18 |
+8.3 |
-85 |
-39.1 |
||
|
CG |
Section 1 |
75 |
36.9 |
35 |
17.2 |
93 |
45.8 |
|
|
Section 2 |
71 |
35.0 |
31 |
15.3 |
101 |
49.8 |
||
|
Shift |
-4 |
-1.9 |
-4 |
-1.9 |
8 |
4.0 |
||
|
8) Problems and fear in the relationship with professors |
EG |
Section 1 |
115 |
53.0 |
73 |
33.6 |
29 |
13.4 |
|
Section 2 |
136 |
62.7 |
67 |
30.9 |
14 |
6.5 |
||
|
Shift |
+21 |
+9.7 |
-6 |
-2.7 |
-15 |
-6.9 |
||
|
CG |
Section 1 |
107 |
52.7 |
68 |
33.5 |
28 |
13.8 |
|
|
Section 2 |
99 |
48.8 |
61 |
30.0 |
43 |
21.2 |
||
|
Shift |
-8 |
-3.9 |
-7 |
-3.5 |
15 |
7.4 |
Notes: EG-experimental Group; CG-Control Group.
As seen from the table, after the experimental effect occurred (second section), certain changes (shifts) in the indicators can be seen: 1) There were decreases in the “high” (-8.3%) and “above intermediate” (-32.7%) indicators of the EG in the first section of the “general anxiety” scale, and growth in the “intermediate” (+41) indicator and changes in the CG indicators were also observed (the "intermediate" and "above intermediate" indicator decreased by 6.9% and 1.5%, respectively, and the "high" indicator increased by 8.3%). 2) There were insignificant decreases in the “high” (7.8%) and “above intermediate” (-30%) indicators of TG in the first section of the “experiencing social stress” scale, and growth in the “intermediate” (+37.8) indicator and changes in CG were also observed (the "intermediate" and "above intermediate" indicators decreased by 6.4% and 2%, respectively, and the "high" indicator increased by 8.3%).
-
3) There were decreases in the “high” (-20.3%) and “above intermediate” (-24.5%) EG indicators in the first section of the “frustration with the need to work for success” scale, and growth in the “intermediate” (+44.7%) indicator and insignificant changes in the CG were also observed (the "intermediate" indicator decreased by 1.5%, the "above intermediate" indicator decreased by 5%, and the "high" indicator increased by 6.4%).
-
4) There were decreases in the “high” (-16.6%) EG indicators in the first section for the “fear of self-expression” scale, and growth in the “intermediate” (+16.1%) indicator and insignificant changes in the CG were also observed (the "intermediate" and "above intermediate" indicators decreased by 2%, and the "high" indicator increased by 4%).
-
5) There was a significant decrease in the “high” (-17%) EG indicators in the first section of the “fear of testing knowledge” scale, and significant growth of the “intermediate” (+18%) indicator and insignificant changes in the CG indicators were found (the "intermediate" and "above intermediate" indicators decreased by 3% and 1.5%, respectively, and the "high" indicator increased by 4.4%).
-
6) There was a decrease in the “high” (-37.3%) EG indicator in the first section of the “fear of not meeting the expectations of others” scale, and the "above intermediate" (+13.4%) and "intermediate" indicators decreased by 1.6%,; the "high" indicator increased by 6.4%).
-
7) Decreases in the “high” (-39.1%), “above intermediate” (+ 8.3%) and “intermediate” (+ 30.9%) EG indicators in the first section of the “weak physiological resistance to stress” scale were observed, and insignificant changes in the CG indicators were observed (the "intermediate" and "above intermediate" indicators decreased by 1.9% and 1.9%, and the "high" indicator increased by 4%).
-
8) A decrease in the “high” (-6.9%) and “above intermediate” (+2.7%) EG indicators in the first section of the “problems and fears in relationships with professors” scale was observed, and an increase in the “intermediate” (+9.7%) indicators and insignificant changes in CG indicators were found (the "intermediate" indicator and "above intermediate" indicators decreased by 3.9% and 3.5%, respectively, and the "high" indicator increased by 7.4%).
According to the results for all scales, which reflect the factors influencing the manifestation of anxiety in the learning environment, it was possible to observe a decrease in the "high-level" indicators and thus an increase in "intermediate level" indicators. This indicates that the students’ adaptation to their environment and the ability to overcome problems and control the feeling of anxiety increased due to the experiment. In the end, a significant decrease in anxiety levels was found among the experimental group, indicating an improvement in students’ internal feelings. This shows an improvement in the general emotional state of students in their educational environment and a decrease in students’ uncomfortable mental conditions that prevent them from succeeding, achieving high results, demonstrating their capabilities; this also shows a reduction in negative emotions among students in situations related to the need to express themselves, the expression of anxiety during tests and similar opportunities to achieve success and a reduction of factors that reduce students’ adaptability to stressogenic situations and increase the likelihood of inadequate, destructive responses to environmental concerns.
As a result of this experiment, students saw positive changes in their characteristics that reflect their anxiety level (general anxiety, experiencing social stress, frustration with the need to work for success, fear of self-expression, fear of testing of their knowledge, fear of not meeting the expectations of others, weak physiological resistance to stress, and problems and fears in relationships with professors) in the learning environment, and the above description of the indicators of the manifestation of such anxiety is considered reliable. Thus, these data suggest that the anxiety level in the learning environment in the experimental group changed significantly during the experiment, indicating that students' psychological health indicators developed in a positive direction. Thus, the experimental program to ensure the students’ psychological health in higher education environments developed by the author had a positive effect on the personality of students in the experimental group.
The changes in the students' self-assessment indicators before and after the experimental effect occurred were assessed by analysing the frequency data obtained using Dembo-Rubinstein's self-assessment methodology (Table 10).
Table 10. Description of the changes in the students’ self-assessment indicators based on Dembo-Rubinstein’s methodology
|
Scales |
Selection group |
Experimental stage |
Low level |
Intermediate (adequate) level |
High level |
|||
|
Number |
Percent |
Number |
Percent |
Number |
Percent |
|||
|
1) Health |
EG |
Section 1 |
114 |
52.6 |
44 |
20.3 |
59 |
27.1 |
|
Section 2 |
88 |
40.6 |
108 |
49.8 |
21 |
9.6 |
||
|
Shift |
-26 |
- 12.0 |
+64 |
+29.5 |
-38 |
-17.5 |
||
|
CG |
Section 1 |
106 |
52.2 |
41 |
20.2 |
56 |
27.6 |
|
|
Section 2 |
104 |
51.2 |
43 |
21.2 |
56 |
27.6 |
||
|
Shift |
-2 |
-1.0 |
2 |
1.0 |
0 |
0.0 |
||
|
2) Mind, ability |
EG |
Section 1 |
101 |
46.5 |
49 |
22.6 |
67 |
30.9 |
|
Section 2 |
84 |
38.8 |
106 |
48.8 |
27 |
12.4 |
||
|
Shift |
-17 |
-7.7 |
+57 |
+26.2 |
-40 |
-18.5 |
||
|
CG |
Section 1 |
94 |
46.3 |
45 |
22.2 |
64 |
31.5 |
|
|
Section 2 |
99 |
48.8 |
41 |
20.2 |
65 |
32.0 |
||
|
Shift |
5 |
2.5 |
-4 |
-2.0 |
1 |
0.5 |
||
|
3) Character |
EG |
Section 1 |
104 |
47.9 |
44 |
20.3 |
69 |
31.8 |
|
Section 2 |
93 |
42.8 |
103 |
47.5 |
21 |
9.7 |
||
|
Shift |
-11 |
-5.1 |
+59 |
+27.2 |
-48 |
-22.1 |
||
|
CG |
Section 1 |
96 |
47.3 |
41 |
20.2 |
66 |
32.5 |
|
|
Section 2 |
97 |
47.8 |
39 |
19.2 |
67 |
33.0 |
||
|
Shift |
1 |
0.5 |
-2 |
-1.0 |
1 |
0.5 |
||
|
4) Respect from peers |
EG |
Section 1 |
133 |
61.3 |
32 |
14.7 |
52 |
24.0 |
|
Section 2 |
89 |
41.0 |
112 |
51.6 |
16 |
7.4 |
||
|
Shift |
-44 |
-20.3 |
+80 |
+36.9 |
-36 |
-16.6 |
||
|
CG |
Section 1 |
123 |
60.6 |
29 |
14.3 |
51 |
25.1 |
|
|
Section 2 |
129 |
63.5 |
22 |
10.8 |
52 |
25.6 |
||
|
Shift |
6 |
2.9 |
-7 |
-3.5 |
1 |
0.5 |
||
|
5) Being able to do many things on your own, skilfulness |
EG |
Section 1 |
150 |
69.1 |
30 |
13.8 |
37 |
17.1 |
|
Section 2 |
88 |
40.6 |
114 |
52.5 |
15 |
6.9 |
||
|
Shift |
-62 |
- 28.5 |
+84 |
+38.7 |
-22 |
-10.2 |
||
|
CG |
Section 1 |
140 |
69.0 |
28 |
13.8 |
35 |
17.2 |
|
|
Section 2 |
137 |
67.5 |
28 |
13.8 |
38 |
18.7 |
||
|
Shift |
-3 |
-1.5 |
0 |
0.0 |
3 |
1.5 |
||
|
6) Appearance |
EG |
Section 1 |
151 |
69.6 |
34 |
15.7 |
32 |
14.7 |
|
Section 2 |
95 |
43.8 |
100 |
46.1 |
22 |
10.1 |
||
|
Shift |
-56 |
- 25.8 |
+66 |
+30.4 |
-10 |
-4.6 |
||
|
CG |
Section 1 |
140 |
69.0 |
32 |
15.8 |
31 |
15.3 |
|
|
Section 2 |
141 |
69.5 |
32 |
15.8 |
30 |
14.8 |
||
|
Shift |
1 |
0.5 |
0 |
0.0 |
-1 |
-0.5 |
||
|
7) Self-confidence |
EG |
Section 1 |
145 |
66.8 |
34 |
15.7 |
38 |
17.5 |
|
Section 2 |
88 |
40.6 |
108 |
49.8 |
21 |
9.7 |
||
|
Shift |
-57 |
-26.3 |
+74 |
+34.1 |
-17 |
-7.8 |
||
|
CG |
Section 1 |
137 |
67.5 |
31 |
15.3 |
35 |
17.2 |
|
|
Section 2 |
131 |
64.5 |
26 |
12.8 |
46 |
22.7 |
||
|
Shift |
-6 |
-3.0 |
-5 |
-2.5 |
11 |
5.5 |
||
Notes: EG-experimental Group; CG-Control Group.
As seen from the table above, the following changes (shifts) occurred in the indicators between the first and second section of the experiment: 1) On the “health” scale, the “high” (-17.5%) and “low” (-12%) indicators decreased and the “intermediate” indicators increased (+29.5%); there were insignificant changes in the CG indicators (the "low" indicator decreased by 1%, the "intermediate" indicator increased by + 1%, and the "high" indicator remained unchanged).
-
2) The “high” (-18.5%) and “low” (-7.7%) EG indicators in the “mental ability” scale decreased, and the “intermediate” indicator grew (+26.2%); there were insignificant changes in the CG indicators (the "low" indicator increased by 2.5%, the "high" indicator increased by 0.5%, and "intermediate" indicator decreased by 2%).
-
3) The “high” (-22.1%) and “low” (-5.1%) indicators of EG in the “character” scale decreased, and the “intermediate” indicator grew (+27.2%); there were insignificant changes in CG indicators (the "low" indicator increased by 0.5%, the "high" indicator increased by 0.5%, and the "intermediate" indicator decreased by 0.5%).
-
4) On the “respect from peers” scale, the “high” (-16.6%) and “low” (-20.3%) indicators decreased, and the “intermediate” indicator grew (+ 36.9%); there were insignificant changes in the CG indicators (the "low" indicator increased by 2.9%, the "high" indicator increased by 0.5%, and the "intermediate" indicator decreased by 3.5%).
-
5) The “high” (-10.2%) and “low” (-28.5%) EG indicators on the “being able to do many things on your own, skilfulness” scale decreased, and the “intermediate” indicator grew (+38.7%); there were insignificant changes in the CG indicators (the "low" indicator decreased by 1.5, the "high" indicator increased by 1.5%, and the "intermediate" indicator did not change).
-
6) The “high” (-4.6%) and “low” (-25.8%) EG indicators in the “appearance” scale decreased, and the “intermediate” indicator grew (+30.4%); there were insignificant changes in the CG indicators (the "low" indicator increased by 0.5%, the "high" indicator decreased by 0.5%, and the "intermediate" indicator remained unchanged).
-
7) The “high” (-7.8%) and “low” (-26.3%) EG indicators for the “self-confidence” scale decreased, and the “intermediate” indicator grew (+34.1%); there were insignificant changes in the CG indicators (the "low" indicator decreased by 3%, the "intermediate" indicator decreased by 2.5%, and the "high" indicator increased by 5.5%).
According to the data, self-esteem level, self-acceptance, mood, maturity, the presence or absence of problems, critical thinking, and the ability to adequately assess oneself saw decreases in the "low" and "high” indicators on all Dembo-Rubinstein scales; additionally, having a realistic attitude, self-reliance, and satisfaction with life saw an increase in "intermediate” indicators. This means that students’ adaptation to their environment improved as a result of the experiment, adequate self-acceptance, the perception and understanding of mistakes, indifference to criticism and comments, correct evaluations of the results of their activities, comparisons of themselves with others and, as a result, the overcoming of problematic situations are evidence of the students’ formation of skills to control their own behaviour and respond adequately to events.
An important result of the student psychological health implementation program is, in our opinion, the increase in the EG students’ self-assessment by an average of 30%; i.e., there were a significant number of students whose selfassessment changed. From this, it can be concluded that the experiment had a certain effect on the students' personality formation in the following areas: self-analysis, the establishment of a good relationship with others, the ability to accurately evaluate the results of one’s activities, comparisons with others, and changes in the adequate assessment of a given situation. Thus, as a result of this experiment, students saw positive changes in characteristics such as selfanalysis, the correct assessment of their activities, the adequate assessment of a given situation, and reliable description of related manifestations.
From the data in the above frequency analysis tables, the following can be said about the indicators for the experimental and control groups in the first and second sections of the study: there were significant changes (shifts) in the performance of the experimental group (the second H 1 (alternative) hypothesis is accepted); the indicators in the control group did not differ significantly before and after the experiment (the third H 1 (alternative) hypothesis is accepted); there were differences in the performance of the experimental and control groups in the second (after the experimental effect occurred) section (the fourth H1 (alternative) hypothesis is accepted).
To confirm these conclusions and the reliability of the correlation (or difference) of the studied indicators, the indicator correlations in the first and second sections of the experimental and control groups were examined using Pearson's correlation analysis and Student's t-test. The experimental and control groups in the first (before the experimental effect) and second (after the experimental effect) sections were analysed by Pearson's correlation analysis, as shown in Tables 11 and 12.
Table 11. Description of the analysis of the correlation between the experimental and control group indicators identified in the first and second sections
|
Methods and scales |
EG (n-217) |
CG (n-203) |
|
Eysenck’s personality inventory methodology |
||
|
1) Neuroticism |
0.071 |
0.931** |
|
Phillips's methodology for determining anxiety levels in the learning environment |
||
|
1) General anxiety |
0.043 |
0.979** |
|
2) Experiencing social stress |
0.093 |
0.572** |
|
3) Frustration with the need to work for success |
0.051 |
0.797** |
|
4) Fear of self-expression |
-0.235** |
0.805** |
|
5) Fear of testing knowledge |
-0.203** |
0.678** |
|
6) Fear of not meeting the expectations of others |
-0.261** |
0.451** |
|
7) Weak physiological resistance to stress |
-0.288** |
0.549** |
|
8) Problems and fear in the relationship with professors |
0.014 |
0.869** |
|
Dembo-Rubinstein’s self-assessment methodology |
||
|
1) Health |
-0.167* |
0.463** |
|
2) Mind, ability |
-0.108 |
0.983** |
|
3) Character |
-0.139* |
0.976** |
|
4) Respect from peers |
-0.097 |
0.973** |
|
5) Being able to do many things on your own, skilful hands |
-0.020 |
0.940** |
|
6) Appearance |
0.054 |
0.973** |
|
7) Self-confidence |
-0.016 |
0.984** |
Notes: EG-experimental Group; CG-Control Group; *р<0.05, r= 0.14, **р<0.01, r = 0.18.
Table 12. Description of the analysis of the experimental and control group correlations after the experimental exposure (second section)
|
Methods and scales |
(EG & CG) |
|
Eysenck's personality inventory methodology |
|
|
1) Neuroticism |
0.035 |
|
Phillips's methodology for determining the anxiety level in the learning environment |
|
|
1) General anxiety |
0.016 |
|
2) Experiencing social stress |
0.058 |
|
3) Frustration with the need to work for success |
-0.045 |
|
4) Fear of self-expression |
-0.035 |
|
5) Fear of testing knowledge |
0.007 |
|
6) Fear of not meeting the expectations of others |
0.021 |
|
7) Weak physiological resistance to stress |
0.043 |
|
8) Problems and fear in the relationship with professors |
0.150* |
|
Dembo-Rubinstein's self-assessment method |
|
|
1) Health |
0.008 |
|
2) Mind, ability |
-0.081 |
|
3) Character |
-0.110 |
|
4) Respect from peers |
-0.075 |
|
5) Be able to do many things on his own, skilful hands |
-0.057 |
|
6) Appearance |
-0.131 |
|
7) Self-confidence |
-0.130 |
Notes: EG-experimental Group; CG-Control Group; *р<0.05, r= 0.14, **р<0.01, r= 0.18.
The results obtained from the above tables are based on Pearson's correlation analysis (remp> rcr0,14 with statistical significance р<0,01 and remp>rcr0,18 with significance at р<0,001). The following were found for the EG indicators in the first and second section: the methodology for determining the level of anxiety in the learning environment" produced negative correlations for the “fear of self-expression” (r=-0,235**), “fear of testing knowledge” (r=-0,203**), “fear of not meeting the expectations of others” (r=-0,261**), and “weak physiological resistance to stress” (r=-0,288**) scales; Dembo-Rubinstein's self-assessment methodology produced negative correlations for the “health” (r= -0,167*) and “character” (r=-0,139*) scales. The other scales had an absence of a significant correlation (the second H 1 (alternative) hypothesis is accepted). The control group (n-203) indicators in the first and second sections have a mutually significant correlation (the third H1 (alternative) hypothesis is accepted).
Methodology “Determining the level of anxiety in the learning environment” in the second section (after the experimental effect) of the experimental and control groups “Problems and fear in the relationship with professors” (r<0.05, r=0.150*) only showed the presence of a positive mutually significant correlation, in the remaining cases there was no correlation (the fourth N1 (alternative) assumption is accepted).
To determine the reliability of these changes (the changes that occurred were not random and were a result of the experiment), the averages of the “first” and “second section” indicators from the experimental and control groups were analysed based on Student's t-test (Table 13 and 14).
Table 13. Description of the dynamic analysis (differentiation) of the experimental and control group indicators in the cross section of the experimental stages
|
Scales |
Selection group |
Experimental stages |
||||
|
The first section |
The second section |
Student t-test |
||||
|
M |
σ |
M |
σ |
|||
|
Eysenck's personality inventory |
||||||
|
1) Neuroticism |
EG |
12.90 |
3.10 |
10.40 |
1.55 |
10.938*** |
|
CG |
12.97 |
2.38 |
13.05 |
2.46 |
- 1.326 |
|
|
Phillips's “Determining Anxiety in the Learning Environment” |
methodology |
|||||
|
1) General anxiety |
EG |
11.15 |
4.10 |
7.60 |
3.05 |
10.427*** |
|
CG |
11.22 |
3.66 |
11.26 |
3.61 |
-0.755 |
|
|
2) Experiencing social stress |
EG |
5.67 |
1.84 |
3.48 |
1.48 |
14.268*** |
|
CG |
5.79 |
1.80 |
5.84 |
1.88 |
-0.370 |
|
|
3) Frustration with the need to work for success |
EG |
7.47 |
2.22 |
4.53 |
1.98 |
14.936*** |
|
CG |
7.51 |
2.18 |
7.60 |
2.28 |
-0.838 |
|
|
4) Fear of self-expression |
EG |
3.67 |
1.63 |
2.80 |
1.41 |
5.328*** |
|
CG |
3.61 |
1.57 |
3.68 |
1.58 |
-1.000 |
|
|
5) Fear of testing knowledge |
EG |
3.69 |
1.60 |
2.77 |
1.40 |
5.774*** |
|
CG |
3.77 |
1.45 |
3.87 |
1.57 |
-1.152 |
|
|
6) Fear of not meeting the expectations of others |
EG |
2.94 |
1.46 |
1.78 |
1.34 |
7.646*** |
|
CG |
2.89 |
1.43 |
2.94 |
1.40 |
-0.475 |
|
|
7) Weak physiological resistance to stress |
EG |
3.12 |
1.321 |
1.96 |
1.23 |
8.356*** |
|
CG |
3.14 |
1.33 |
3.11 |
1.26 |
-0.400 |
|
|
8) Problems and fear in the relationship with professors |
EG |
4.67 |
1.22 |
3.65 |
1.51 |
7.767*** |
|
CG |
4.74 |
1.18 |
4.73 |
1.21 |
0.229 |
|
|
Dembo-Rubinstein’s self-assessment methodology |
||||||
|
1) Health |
EG |
4.90 |
1.80 |
6.62 |
1.54 |
-9.911*** |
|
CG |
4.99 |
1.92 |
5.23 |
3.49 |
-1.106 |
|
|
2) Mental ability |
EG |
5.11 |
1.85 |
6.74 |
1.52 |
-9,.519*** |
|
CG |
5.18 |
1.94 |
5.19 |
1.90 |
-0.391 |
|
|
3) Character |
EG |
4.82 |
1.85 |
6.73 |
1.60 |
-10.765*** |
|
CG |
4.89 |
1.96 |
4.87 |
1.89 |
0.821 |
|
|
4) Respect from peers |
EG |
4.50 |
1.77 |
6.48 |
1.50 |
-12.066*** |
|
CG |
4.34 |
1.74 |
4.33 |
1.70 |
0.521 |
|
|
5) Being able to do many things on your own, skilful hands |
EG |
4.33 |
1.83 |
6.16 |
1.46 |
-11.380*** |
|
CG |
4.16 |
1.80 |
4.19 |
1.74 |
-0.797 |
|
|
6) Appearance |
EG |
4.63 |
1.86 |
5.95 |
1.48 |
-8.353*** |
|
CG |
4.41 |
1.84 |
4.36 |
1.85 |
1.629 |
|
|
7) Self-confidence |
EG |
4.75 |
1.76 |
6.19 |
1.42 |
-9.308*** |
|
CG |
4.57 |
1.73 |
4.58 |
1.72 |
-0.229 |
|
Notes : EG-experimental Group; CG-Control Group; *р<0.05, t=1.96; **р<0.01, t=2.58; ***р<0.001, t=3.29.
Table 14. Description of the difference analysis between the experimental and control groups after the experimental exposure (in the second section)
|
Methods and scales |
Selection group |
||||
|
EG |
CG |
Student t-test |
|||
|
M |
σ |
M |
σ |
||
|
Eysenck's personality inventory |
|||||
|
1) Neuroticism |
10.41 |
1.55 |
13.05 |
2.46 |
-13.144*** |
|
B. Phillips's methodology for determining anxiety in the learning environment |
|||||
|
1) General anxiety |
7.61 |
3.12 |
11.26 |
3.61 |
-10.990*** |
|
2) Experiencing social stress |
3.53 |
1.51 |
5.84 |
1.88 |
-14.046*** |
|
3) Frustration with the need to work for success |
4.54 |
1.97 |
7.60 |
2.28 |
-14.147*** |
|
4) Fear of self-expression |
2.82 |
1.42 |
3.68 |
1.58 |
-5.687*** |
|
5) Fear of testing knowledge |
2.78 |
1.41 |
3.87 |
1.57 |
-7.333*** |
|
6) Fear of not meeting the expectations of others |
1.77 |
1.33 |
2.94 |
1.40 |
-8.724*** |
|
7) Physiological resistance to stress |
1.95 |
1.21 |
3.11 |
1.26 |
-9.695*** |
|
8) Problems and fear in the relationship with professors |
3.70 |
1.52 |
4.73 |
1.21 |
-8.133*** |
|
Dembo-Rubinstein’s self-assessment methodology |
|||||
|
1) Health |
6.61 |
1.55 |
5.23 |
3.49 |
5.160*** |
|
2) Mind, ability |
6.73 |
1.54 |
5.19 |
1.90 |
8.645*** |
|
3) Character |
6.72 |
1.62 |
4.87 |
1.89 |
10.084*** |
|
4) Respect from peers |
6.48 |
1.50 |
4.33 |
1.70 |
13.050*** |
|
5) Being able to do many things on your own, skilful hands |
6.14 |
1.47 |
4.19 |
1.74 |
11.870*** |
|
6) Appearance |
5.95 |
1.50 |
4.36 |
1.85 |
8.967*** |
|
7) Self-confidence |
6.21 |
1.44 |
4.58 |
1.72 |
9.796*** |
Notes: EG-experimental Group; CG-Control Group; *р<0.05, t=1.96; **р<0.0, t=2.58; ***р <0.001, t=3.29
The results from the tables above are based on Student’s t-test (temp> tcr (3.29) with a statistical significance of р<0,001). The second hypothesis concerns the experimental group in the initial state, i.e., before the experimental effect (first section), and in the final state, that is, after the experimental effect occurred (second section); a significant difference was found between the later indicators (calculated as a result of an experimental effect without statistical significance and with random character) (H 1 (alternative) is accepted); H 1 (alternative) assumes that there is no statistically significant difference between the control group indicators in the first and second sections, as proposed in phase 3 of our study. The experimental and control groups proposed in phase 4 of our experimental study, that is, the presence of a difference between the end indicators from the second section), were statistically reliable, and this confirmed that the changes were the result of the experiment and were not random (H1 (alternative) is accepted). Thus, the analysis performed on the control and experimental groups revealed the structural components of the students’ psychological health (psychoemotional position, anxiety, self-esteem), thus informing the activities outlined in the author's experimental program to ensure students’ psychological health in the higher education environment; significant changes occurred after the experiment. The reliability of these changes was confirmed on the basis of the frequency methods in statistics: Pearson's correlation analysis and Student's t-test. This, in turn, allowed us to draw conclusions about the effectiveness of the experimental program to ensure students’ psychological health in the higher education environment developed by the author.
The limitation of this work is followings: The main contribution of this manuscript is the proposed model that consists of two stages and series of activities. This model is described with steps on how it should be implemented and benefited. In this paper have been discussed students in high education.
4. Conclusion
In conclusion, the research produced results on students’ psychological health in terms of various psychological health indicators, as well as the relationship between behaviour and internal health, including emotional, cognitive and behavioural areas. It was found that one important indicator of students' psychological health is a decrease in the level of emotional distress and emotional instability (neuroticism, nervousness), a positive change in students' internal state, and an increase in students’ satisfaction with their educational environment.
After the experiment, it was found that the anxiety level in the experimental group decreased: there was a decrease in factors that improve students’ general emotional state in the learning environment, a decrease in the uncomfortable mental state that prevents them from succeeding, achieving high results, and demonstrating their abilities; this also shows a reduction in the negative emotions among students in situations related to the need to express themselves the expression of anxiety during tests and similar opportunities to achieve success, and a reduction in factors that reduce students adaptability to stressogenic situations and increase the likelihood of inadequate, destructive response to environmental stressors, reducing their resilience in stressful situations.
Excessive self-esteem can prove that a student is not mature, cannot evaluate the results of his or her activities correctly, and cannot accurately compare him or herself with others. Low self-esteem, on the other hand, is a sign of poor personal development. In such an assessment, two different psychological phenomena can be observed: real selfdoubt and the use of a "protective shell". The experiment had a certain effect on the students' personality formation: changes were manifested in their self-analysis, good relationships with others, ability to accurately evaluate the results of their activities, self-comparison with others, and adequate situation assessment.
A comparative analysis of the qualitative and quantitative data obtained during the experiment shows the effectiveness of the program in ensuring the university students’ health. The results could be used in the high education system, especially measuring and monitoring students’ psychological health.
5. Future Researches
We would like to explore deeply researches belonging to this research field. For example, in preschool and primary school children.
References Analysis of Experimental Research Results Focused on Improving Student Psychological Health
- World Health Organization. https://www.who.int/topics/mental_health/ru/, https://www.who.int/topics/mental_health/mental-health-final.pdf?ua=1
- Adler A. Individual psychology // History of foreign psychology. 30-60s of XX century (Texts) /Under reduct. P.Ya. Galperin, A.N. Jan. – М.: Publishing house of Moscow University, 1986. p. 131-140.
- Maslow A. Self-actualization // Psychology of personality: Texts. – М., 1982. – p. 108-117.
- Ananiev V.A. Introduction to Health Psychology: Textbook - St. Petersburg: Baltic Pedagogical Academy, 1998.– р.158
- Fargana J. Abdullayeva, Sabira S. Ojagverdiyeva, "Multicriteria Decision Making using Analytic Hierarchy Process for Child Protection from Malicious Content on the Internet", International Journal of Computer Network and Information Security (IJCNIS), Vol.13, No.3, pp.52-61, 2021. DOI: 10.5815/ijcnis.2021.03.05
- Imrus Salehin, Sadia Tamim Dip, Iftakhar Mohammad Talha, Ibrahim Rayhan, Kanij Fatema Nammi, "Impact on Human Mental Behavior after Pass through a Long Time Home Quarantine Using Machine Learning", International Journal of Education and Management Engineering (IJEME), Vol.11, No.1, pp. 41-50, 2021. DOI: 10.5815/ijeme.2021.01.05
- W. Cao et al., “The psychological impact of the COVID-19 epidemic on college students in China,” Psychiatry Research, 2020, doi: 10.1016/j.psychres.2020.1129
- Brekhman I.I. Valeology - the science of health. – М., 1996. – р.206
- Gurvich I.N. Social psychology of health. Dis. Dr. psychol. Sciences:19.00.05.– St.Petrb, 1998.
- Fengrui W.,"Analysis of Social Psychology of Higher Single Recruit Students", IJEME, vol.2, no.8, pp.53-57, 2012.
- Nor S.M.S., Sofianita M. "Prediction of Mental Health Problems among Higher Education Student Using Machine Learning", International Journal of Education and Management Engineering (IJEME), Vol.10, No.6, pp.1-9, 2020. DOI: 10.5815/ijeme.2020.06.01
- Antonovsky A. Personality and health: Testing the sense of coherence model / A. Antonovsky. – New York: John Wiley & Sons, 1990. – 562 p.
- Hobfoll S.E. The Influence of Culture, Community, and the Nested- Self in the Stress Process: Advancing Conservation of Resources Theory / S.E. Hobfoll // Applied Psychology: An International Review. –2001. – № 50(3). – P. 337-421.
- Aderonke B. Sakpere, Ayomiposi G. Oluwadebi, Oluwatoyin H. Ajilore, Lauretta E. Malaka, " The Impact of COVID-19 on the Academic Performance of Students: A Psychosocial Study Using Association and Regression Model", International Journal of Education and Management Engineering (IJEME), Vol.11, No.5, pp. 32-45, 2021. DOI: 10.5815/ijeme.2021.05.0
- Maxwell Kontor Owusu, Bakari Yusuf Dramanu, Mark Owusu Amponsah, "Classroom Management Strategies and Academic Performance of Junior High School Students", International Journal of Education and Management Engineering (IJEME), Vol.11, No.6, pp. 29-38, 2021. DOI: 10.5815/ijeme.2021.06.04
- Umarov B. The role of education in ensuring the psychological protection of the individual // Psychological health in the XXI century: problems and solutions: Proceedings of the Republican scientific-practical conference (May 15, 2017).– Fergana: 2017. – р. 225-228.
