Analysis of structure of intraventricular blood flow based on studies of architectonics of trabecular layer in left ventricle

Author: Bockeria Leo A., Kiknadze Gennady I., Gachechiladze Ivan A., Gabidullina Rosalia F., Makarenko Vladimir N., Gorodkov Alexander Yu.
Journal: Cardiometry @cardiometry
Section: Original research
Article in issue: 3, 2013.
Free access
Aims To overcome numerous contradictions in the knowledge of the blood transportation, a hypothesis was supposed asserting the swirling pattern of blood flow in the heart and main vessels which resembles tornado-like flows and which is widespread in nature. These flows can be exhaustively described by the exact solutions of the nonstationary hydrodynamic Navier-Stokes equations and the continuity equations for the class of viscous swirling flows offered by Kiknadze - Krasnov. Materials and methods Using morphometric studies of human and canine left ventricular casts and Multislice Computed Tomography it has been shown that the trabeculae in the ventricular cavity are oriented along the streamlines of the tornado-like flow of appropriate dimension. Moreover, this principle covers both the diastolic trabeculae of the inlet part of the left ventricle and the systolic trabeculae of the outlet part of the left ventricle. Results It is concluded that the main trabeculae function consists in the structural organization of the intraventricular tornado-like swirling flow of Kiknadze – Krasnov type. Conclusion The hydrodynamic analysis of the blood flow laws is indispensable for the development of new diagnostics criteria in cardiology, cardiac surgery optimization, the design of new implantable and paracorporal devices contacting with blood flow and mathematical and physical modeling of circulation.
Intraventricular blood flow, left ventricle, tornado-like swirling flows
Short address: https://sciup.org/148308741
IDR: 148308741
Text of the scientific article Analysis of structure of intraventricular blood flow based on studies of architectonics of trabecular layer in left ventricle
Aims To overcome numerous contradictions in the knowledge of the blood transportation, a hypothesis was supposed asserting the swirling pattern of blood flow in the heart and main vessels which resembles tornado-like flows and which is widespread in nature. These flows can be exhaustively described by the exact solutions of the nonstationary hydrodynamic Navier-Stokes equations and the continuity equations for the class of viscous swirling flows offered by Kiknadze -Krasnov. Materials and methods Using morphometric studies of human and canine left ventricular casts and Multislice Computed Tomography it has been shown that the trabeculae in the ventricular cavity are oriented along the streamlines of the tornado-like flow of appropriate dimension. Moreover, this principle covers both the diastolic trabeculae of the inlet part of the left ventricle and the systolic trabeculae of the outlet part of the left ventricle. Results It is concluded that the main trabeculae function consists in the structural organization of the intraventricular tornado-like swirling flow of Kiknadze – Krasnov type. Conclusion The hydrodynamic analysis of the blood flow laws is indispensable for the development of new diagnostics criteria in cardiology, cardiac surgery optimization, the design of new implantable and paracorporal devices contacting with blood flow and mathematical and physical modeling of circulation. Keywords Tornado-like swirling flows • Intraventricular blood flow • Left ventricle Imprint Leo A. Bockeria, Gennady I. Kiknadze, Ivan A. Gachechiladze, Rosalia F. Gabidullina, Vladimir N. Makarenko, Alexander Yu. Gorodkov. Analysis of structure of intraventricular blood flow based on studies of architectonics of trabecular layer in left ventricle; Cardiometry; No.3; November 2013; p.5-30; doi: 10.12710/cardiometry.2013.3.530 Available from:
Hydrodynamics of blood flow and mechanisms of blood transportation in the heart and the main blood vessels are poorly known in circulation physiology. In this case, the flow is the only factor of the effect of force acting on the wall of the heart and blood vessel flowing channel. The effect takes place due to stresses arising in the boundary layer of the flow [1]. The structure of the boundary layer and the nature of the stresses occurring therein are closely associated with the pattern of the flow in itself. The mode of organization of the blood stream determines the level of energy losses along the stream, the value of hydrodynamic resistance and the value of the force required for fluid transportation that is of importance for an assessment of the blood circulation efficiency [2]. A structurally organized flow, i.e., a flow where all fluid elements move along certain streamlines, provides continuous flowing of fluid free of stagnation and separation zones. On the one hand, this condition points to the fact that we deal with a high energy efficiency of blood circulation, where energy losses for local turbulences are not available. On the other hand, flows of this sort do not give rise to conditions for activation or damage of biologically active components of blood or endothelium [3].
It should be mentioned that much research is devoted to issues on blood flow hydrodynamics [1, 4]. Some surveys show that the mode of the blood flow in the heart and the aorta is of turbulent nature partially or in full within a cardiac cycle. This assumption cannot be true because the turbulent flow is always associated with a considerable energy use, chaotic in its nature and shows an irregular field of velocities and shear stresses. The turbulent flow of blood implies a high risk of spontaneous thrombus formation. The hydrodynamic resistance of this flow type is high, and the boundary layer, which is formed between the core of the flow and the wall of the flowing channel, is increasing in its thickness along the stream that contributes to an even greater increase in the resistance [5].
It is customary to analyze the blood flow in the heart and the main blood vessels based on the assumption that it is laminar [1]. But a laminar flow in such a complex-shaped configuration channel that is the case with the heart-aorta flowing system is difficult to imagine, not to mention a degree of flow unsteadiness which is always present in the pulsating blood flow. Moreover, this is inconsistent with the criteria of the flow laminarity accepted by the conventional hydrodynamics: with the maximum blood flow velocities, a Reynolds number in the aorta achieves 12000, while the transition from laminarity to turbulence takes place at a Reynolds number Re=1960±160 [6].
In the course of the experimental and clinical work, significant factual evidence has been accumulated in favor of our assumption that the flow of blood in the heart and the main blood vessels is of swirling type [11, 12, 13, 14, 15]. Based on the studies with corrosive preparation of casts of the heart cavities carried out by N.B. Kuzmina as early as 1976, it was suggested that the intracardiac and intraaortic flow should demonstrate its swirling structure, but the said hypothesis could not be unambiguously confirmed at that time because of lack of adequate measuring equipment and the absence of an adequate hydrodynamic concept to properly describe the flow [11]. According to data obtained in magnetic resonance and echocardiographic researches, it has been demonstrated as well that the spiral orientation of intracardiac trabeculae together with the effect of aligning by trabeculae, tendinous cords and papillary muscles during the cardiac contraction assists in formation of the diastolic and systolic intracardiac blood flow swirling clockwise along the stream direction [16].
The present-day instrumentation methods furnish adequate tooling for visualization and measurements of velocity fields in the swirling blood flow. The fact that the intracardiac blood flow is of swirling type has been confirmed with the use of MRI [13] and color flow Doppler echocardiography [12]. But an analysis of the velocity field and blood quantification for obtaining the proper data, which could be used for an assessment of the state of the actual blood flow, is possible only when an adequate hydrodynamic model is available that is capable of properly reflecting mechanisms of generation and evolution of flows of this sort.
Such model was proposed upon publishing of the exact solutions of the unsteady equations in hydrodynamics (the Navier – Stokes equations and the continuity equations) in 1986 for the class of tornado-like swirling flows of viscous fluid [17].
The properties of the flows of this class are in many ways similar to those well-known for the blood flow. The tornado-like swirling flows are twisted, axially symmetric self-organizing streams featuring minor energy losses, high efficiency of mass transfer at the expense of extra gradients formed due to response lags in rotational motion of a swirling jet [18]. To provide stability of flows of this type, their boundary layer should be organized in the manner other than it is the case with the axially symmetrical turbulent or laminar fluid flow. The boundary layer is a three-dimensional structure where the core of the flow contacts the wall via a number of smaller vortex jets which provide the proper conditions for the stream to move lengthwise of the wall, as it were sliding. In this case, at the wall, the condition of fluid zero velocity is met, and the shear stresses are substituted by those resulting from rolling.
Medium in flows of this class moves along the streamlines directed to the convergent spiral with respect to the flow axis, i.e., a radius of the stream decreases always with the longitudinal coordinate Z increasing. If we deal with a flow in a channel having elastic walls or walls capable of intensively following the structure of the swirling jet, then the exact solutions of the above mentioned equations make possible to link the spatial configuration of the flowing channel with the field velocity of such type of the flow (s. relationship 1) (Fig. 1).
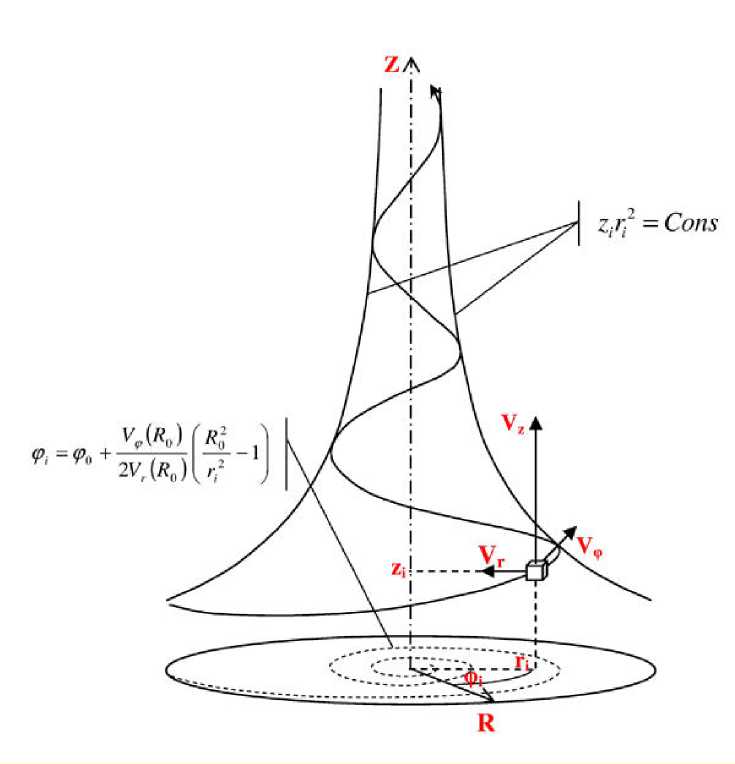
Figure 1. Schematic representation of the swirling jet with indication of the directions of the coordinate axes and the velocity components vectors. Noted is the formula of the longitudinal radial (left) and azimuthally radial (right) projections of the streamlines.
A small dissipation of energy of this flow class is attributed to the fact that a longitudinal and a radial component of velocity in such fields are independent of viscosity. Viscosity has influence on the value of azimuthal component of the velocity at small radii only, i.e., in the vicinity of the swirling flow, as it follows from the exact solutions (1):
<
V r =- C o ( t ) r
V z = 2 C o ( t) z
V = £ o( t ) ф 2 n r
1 - e
c o ( t ) r 2 ) 2 v
J
where (V z ) is a longitudinal component of velocity, (V r ) is a radial component of velocity, and (V φ ) is an azimuthal component of velocity, С 0 I is a radial gradient of velocity [sec-1], Г 0 is a circulation of jet [m2/sec.]; С 0 (t) and Г 0 (t) are independent time functions changing by virtue of flow unsteadiness, and ν is kinematical viscosity of medium [m2/s]. Therefore, it can be concluded that the flows under discussion are quasi-potential swirling ones showing a structure similar to that found in swirls of natural occurrence (like whirlpools, tornados, etc).
It is well known that the streamlines can be obtained from the solution of differential equations (2), if velocity values in three directions of the cylindrical coordinate system are given, as follows:
dR _ dZ _ Rd ^
V ~ V ~ V r z ^
The computed paths of the streamlines correspond to relation (3) in the longitudinal-radial projection and relation (4) in the azimuthal-radial projection, accordingly, cons
zi = 2
r i
Ф i = ф 0 +
V ф ( R 0 ) 2Vr ( R 0 )
f R4 к ri
^
- 1
where z i is the current value of the longitudinal coordinate determined according to its distance from the origin of the cylindrical system of coordinates of the swirling jet, r i is the value of a flow radius corresponding to the value of the longitudinal coordinate z i , φ 0 is an angular coordinate chosen arbitrarily that defines an initial angle of flow swirling, and R 0 is the greatest external radius of the flow within the area of its onset.
For a jet of a relatively large diameter (a diameter that an exponent in the equation for V φ (1) is close to 1), the relation between the longitudinal component and the radial component of velocity can be described through relationship С 0 (t)/Г 0 (t) (5) as follows:
V ( Z ) V v ( R )
C ^ ^t) • 4 n Rt ( Zt + Z o).
Г o (t) i i 0
In connection with the fact that the value of longitudinal coordinate z i from relationship (3) cannot be measured from the origin of the coordinate system because of continuous change of the position of the above coordinate with the phase of evolution of the flow, a point along the longitudinal axis of the flow is chosen as the reference for measuring a distance to the measuring point of the relation С 0 /Г 0 . With a knowledge of the fact that the instantaneous value of the product z i r i 2 along the stream direction is constant, and assuming that the value z i is said to be equal to Z i +Z 0 , where Z i is the measured value of the longitudinal coordinate referred to this point, it becomes possible to compute the value of Z 0 , and, consequently, the instantaneous position of the origin of the coordinates at least by two values of Z i . Following this way, it should be stated that Z 0 is a free parameter determined by results of measuring, which corresponds to the instantaneous value of the distance from the moving origin of the coordinates to the point from where measuring of longitudinal coordinate Z i is started. For the sake of convenience, radial coordinate r i from relationships (3, 4) in relationship (5) is denoted by R i .
From the above relationships (3,4,5), which stem from the exact solutions, we notice that the direction of a resultant vector of the flow velocity and the relation between the flow components V r /V φ and V z /V φ at any point of the swirling jet can be calculated if the streamlines in the longitudinal-radial and azimuth-radial projections are given. To provide such computation, it would suffice to know the values or magnitudes of time-related parameters С 0 (t)/Г 0 (t), Z 0 (t) and Q(t) (corresponding to value of Cons in relation (3)).
The physical meaning of these parameters results from the exact solution of the equations, and the physiological interpretation of their value or magnitude can be presented as given below.
A change in Г 0 for the cardiac jet reflects the process of accumulation and consumption of the jet energy. Therefore, by virtue of unsteadiness of the flow and due to a change in the orientation by flow-aligning anatomic structures in the left ventricle cavity, Г 0 can be increased with diastolic filling of the cavity (accumulation of energy) and decreased with systolic ejection into the aorta (consumption of energy).
An analysis of the dynamics of parameter С 0, or the radial gradient of velocity, makes possible, on the one hand, to assess intensity of cardiac contractility that is reflected in imparting of the velocity radial component to the flow, when the cavity walls are approaching each other. On the other hand, this parameter shows a degree of longitudinal acceleration or retardation of the jet due to changing in the radius of the flowing channel, and, correspondingly, a degree of convergence of the swirl tornado-like flow.
Z 0 is a distance from the instantaneous position of the cylindrical coordinate origin to a chosen anatomic reference point in the “left ventricle – aorta” channel used to determine longitudinal coordinate Z i . The Z 0 coordinate is computed by the results of measurements based on relation (3). If the system of guiding elements (trabeculae and papillary muscles) changes dynamically its orientation in the flow, effecting on the swirling flow and controlling in such a manner its development, the origin of the coordinates will move with the flow according to the phase of the jet evolution [19, 20, 21, 22, 23].
A correlation made in previous reports [19, 20, 21, 22, 23] between the theoretical lines of tornado-like streams and the actual configuration of the flowing channel of the left ventricle and the aorta according to the corrosive preparation data has shown that there all conditions for existence of the swirling flow of the above mentioned class are available [19].
It is well known that the internal surface of the left ventricle cavity is lined with a muscle structure net, namely, with the trabeculae and papillary muscles immediately exposed to blood flow. These structures being projected into the cavity of the left ventricle have inevitably their influence on the flow pattern due to viscous interactions, by acting as guiding blades in the flow. An expression of different trabeculae groups within a cardiac cycle depends on a sequence of excitement propagation in the left ventricular myocardium. In such a manner, at the beginning of the systolic contraction, the long-sized longitudinal trabeculae of the anterior interventricular septum and the papillar muscles are most highly expressed. With the heart relaxation, these structures show a decrease in their volume and take up little space in the inflow portion of the left ventricle. A leading role in the organization of the flow entering the cavity of the left ventricle after passing through the atrium in the diastole should be assigned to the trabeculae of the free wall in the left ventricle which form the boundaries of the cavity inflow portion in the immediate vicinity of the mitral valve. An alternative blood flow exposure to diastolic and systolic trabecular structures in the left ventricle cavity leads necessarily to the fact that the main directions of the blood flow conform to the orientation of the intracardiac topology.
In actual practice, the morphometric studies of left ventricular casts representing the diastole made it apparent that the space orientation of the trabeculae in the inflow portion of the left ventricle follows to a high degree of accuracy the direction of the streamlines of the flow described by the exact solutions of the equations and features the formation and evolution of the intracardiac flow within the phase of diastolic filling of the left ventricle. With the use of the left ventricular cavity casts representing the systole, it has been demonstrated that the space orientation of the trabeculae on the outflow pathway of the left ventricle and the papillary muscles is consistent with the streamlines of the same flow and features the appropriate stage of the intracardiac flow evolution corresponding to ejection and acceleration of the blood jet, when blood is moving from the left ventricle into the aorta [21].
Hence it has been proven in our earlier papers stating that the blood flow in the left ventricle of the heart and the aorta can be quantified with the use of the exact solutions of the of the hydrodynamic unsteadiness equations by Kiknadze – Krasnov and that the structural parameters of the flow are embodied in the spatial configuration of the flowing channel and the guiding trabecular topology in the left ventricle of the heart.
In the previous papers, the calculation of parameters С 0 /Г 0 , Q and Z 0 on the basis of the casts was carried out by tracing of point-by-point lines of the trabeculae in the cast, 3D reconstruction of the said lines and identifying correlations between the actually detected lines of the trabeculae orientation on the left ventricular cast surface and the theoretical streamlines of a vortex-type flow. For an analysis some individual specimens were prepared which provided a good visualization of the intracardiac topology and which were capable to minimize errors due to well-known flaws of anatomic methods, namely, postmortem changes in anatomy and casting irregularities.
For collection of statically significant data on the said parameters with sufficient anatomical material, it became necessary to develop a method of measuring and calculation of flow parameters С 0 /Г 0 , Q and Z 0 differing from that used in previous papers [19] that is the objective hereof.
Materials and methods
A geometrical configuration of the left ventricle cavity was studied with the use of postmortem corrosive preparations or heart cavity casts. The casts were made according to the standard procedure [19]. For this purpose, employed was cannulation of the pulmonary veins and the aorta followed by their washing with water and filling with the Protacryl-M material of semi-sold consistency at a pressure under 150 mm Hg. The filling material was supplied into the cavity through the pulmonary veins as long as the material appeared in the aorta, whereupon the aorta was clamped. Previously, the right compartments of the heart had been filled with water with the clamped empty veins and pulmonary arteries in order to avoid bulging of the left ventricle to the right. Upon completion of the Protacryl polymerization, the heart was immersed in the 5N potassium hydroxid solution to provide etching of biological tissues. 2 days later, the finished cast was removed from the alkaline solution, washed with a substantial amount of running water and dried.
Measurements were made on 12 human and 12 canine left ventricular casts.
The methodology of measuring of structural parameters of blood developed for the cast measuring was employed for an analysis of dynamic images of the left ventricular cavity produced with the multi-spiral computed tomography (MSCT) (Siemens Definition AS 128). For this purpose, two patients showing insignificant changes in cardiac dynamics were enrolled into the above studies.
Methods of calculation of parameters
Since the swirling flow is symmetrical about the axis, any point in the flow can be analyzed with a velocity hodograph (s.Fig.2) in such a manner that it is located on the plane of the jet axis perpendicular to the viewing plan.
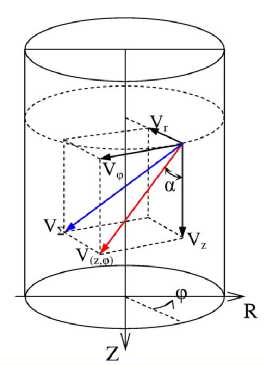
Figure 2. Hodograph of the axially symmetrical swirling flow in the cylindrical coordinate system {Z, R, φ} (see the notations in the text of the paper).
In this case, the projection of the radial component of the velocity reduces to 0, and the projection of the resultant vector of the velocity becomes a sum of the longitudinal and tangential components, or:
V ( z , ф )
= 4 V . 1 + V ^
which is a tangent line to the respective guiding trabecula governing the direction of the flow at the given point and at the given time within the cardiac cycle. Therefore, from relationships (3,5) deduced can be formulas to compute parameters Z 0 , Q and С 0 /Г 0 for the guiding trabeculae identified on the cast.
^ _ Ctg Ct 2 • /?, • Z| Ctg tZ| • /?2 ' Z2 ° ctg ax - RT- ctg аг • Rx co _ Ctgax. C„_ _ Ctg a, Го 4 • я • R, • (Z, + Zo) Го 4 ■ S’■ R2 • (Z2 + Zo)
Here, Z 1 and Z 2 are two values of the longitudinal coordinate along the flow axis determined with reference to the characteristic anatomical mark on the cast; R 1 and R 2 are values of the cavity radius corresponding to the values of the longitudinal coordinate Z 1 and Z 2 , and α 1 and α 2 are angles of inclination of the trabeculae with respect to the flow axis at points located in the plane containing the axis of the flow.
As evident from the exact solutions, the instantaneous status of the flow structure (direction of the resultant vector of the velocity) can be definitely characterized by values С 0 /Г 0 , Q and Z 0 , when the flow is considered at a given time as a stationary one.
Measurement of parameters
The postmortem left ventricular internal surface cast reflects to a certain degree the respective cardiac cycle phase at the time of death, and consequently, the corresponding phase of the flow evolution.
An identification of the heart contraction phase was carried out on the basis of certain criteria as proposed before [19, 21]. For this purpose, volumes of the left ventricular cavity and papillary muscles, general configuration of the cavity, the nature of trabecular topology expression were utilized as criteria. The set of the said criteria allows determining the corresponding heart contraction phase engraved in the postmortem left ventricular cast. However not every cast shows the required combination of the signs that is attributed to some terminal and postmortem changes in heart anatomy, like the type of asystole, the degree of progression or release due to cadaveric rigidity as well as technical artefacts related to heart cavity filling.
On the basis of the previous publications it may be considered to be proven that the flow in the left ventricle refers to the class of tornado-like swirling flows being described by the exact solutions of the unsteady hydrodynamic equations by Kiknadze-Krasnov, and the lines of the orientation of the trabeculae follow the streamlines of the flow under discussion. Therefore, the principles of the structural organization of the flow resulting from the exact solutions of the above equations have been applied to the analysis of trabecular topology as stated below.
-
1. The flow is convergent over its whole length, i.e., the flow radius always decreases with increasing in value Z.
-
2. An angle of inclination of the resultant vector of the longitudinal and azimuthal components of velocity relative to the longitudinal axis of the flow always decreases with increasing in value Z.
It makes possible to correspondingly correct the selection and the position of the axis, along which the analysis of the mutual arrangement of the trabeculae is carried out, on the one hand, and to correct a number of measurement errors unavoidable when spatial orientation of the trabeculae is registered without reference to the flow, on the other hand. Thus, limitations which allow selecting of those topology elements which form the blood flow pattern within the corresponding cardiac cycle phase in the complicated structure of the trabecular layer have been formulated.
In general, these limitations can be formulated in the following way: the axis of the helically oriented trabecular system should be arranged in such a way that everywhere along the axis, with the same value of Z, the angle of inclination of all the trabeculae under consideration relative to the axis should be the same; at points Z
1
and Z
2
>Z
1
the following conditions should be fulfilled: R
2
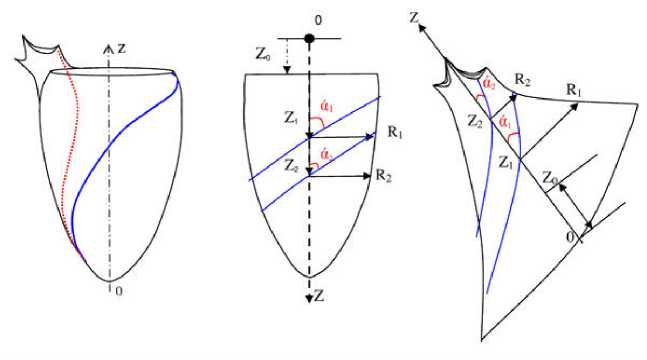
Figure 3. Scheme of systolic (red) and diastolic (blue) trabecular groups on the left ventricle cast (a); the principle of selecting the trabecular topology lines for the calculation of the structural intracardiac blood flow parameters in compliance with the Kiknadze-Krasnov exact solutions for diastolic (b) and systolic (c) trabecular systems.
The groups of trabecular structures which form the regular helices relative to the expected directions of the blood flow were selected on the cast. At the places where a trabecular line was interrupted or terminated, its direction was extrapolated according to the above limitations and color-coded on the cast surface. The direction of the symmetry axis of the selected trabecular group was approximately determined, and it was marked on the cast surface in such a way so that it would be possible to draw a line corresponding to the projection of the axis on the cast surface at any position of the cast (Fig. 4). Values of the cavity radii in the plane perpendicular to the jet axis and values of the angles of inclination of the trabeculae relative to that axis with two longitudinal coordinate values, which were determined from the characteristic anatomical reference mark on the cast, were measured.
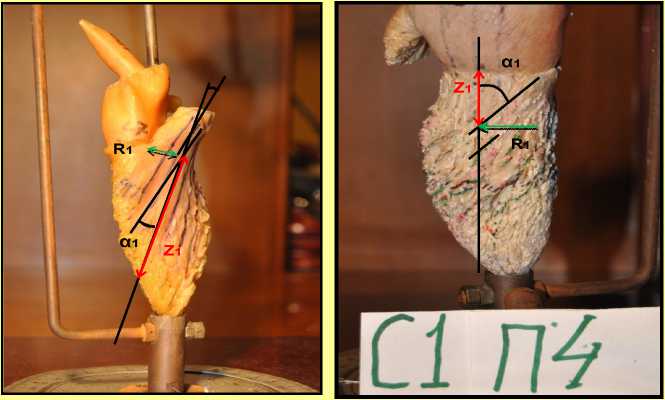
Figure 4. Casts of the left ventricular cavity. The measured parameters are shown, namely: the α1 and α2 angles, radii of the R 1 and R 2 channel, the lengths of Z 1 and Z 2 for systolic (left) and diastolic (right) trabecular systems.
The mitral valve fibrous ring plane was such a reference mark for the diastolic trabeculae, and the boundary between the middle and lower third of the free left ventricle wall was the reference mark for those systolic. The trabecular radii and the angles of inclination values were recorded by turning the cast through 360 degrees in steps of 30 to 60 degrees, depending on an the availability of the trabecular lines, so that at least two trabecular lines crossed the axis of the flow. The cast was photographed in each position to obtain flat images (Fig. 4,5). The angles of inclination of the available trabecular pairs with the fixed Z values along the selected axis at the point of intersection of trabecula and the projection of the axis on the cast surface and the cavity radii at those points were measured with a protractor and a ruler on the photos (Fig. 5). Those measurements were repeated several times for different positions of the axis, and the least error in the angle of inclination measurement with the same Z value was achieved. Upon identifying the best possible position of the axis followed by the respective measuring, the measurement data were utilized for calculating the values of blood flow structural parameters С0/Г0, Q and Z according to the relations (9-11) derived from the exact solutions by Kiknadze-Krasnov.
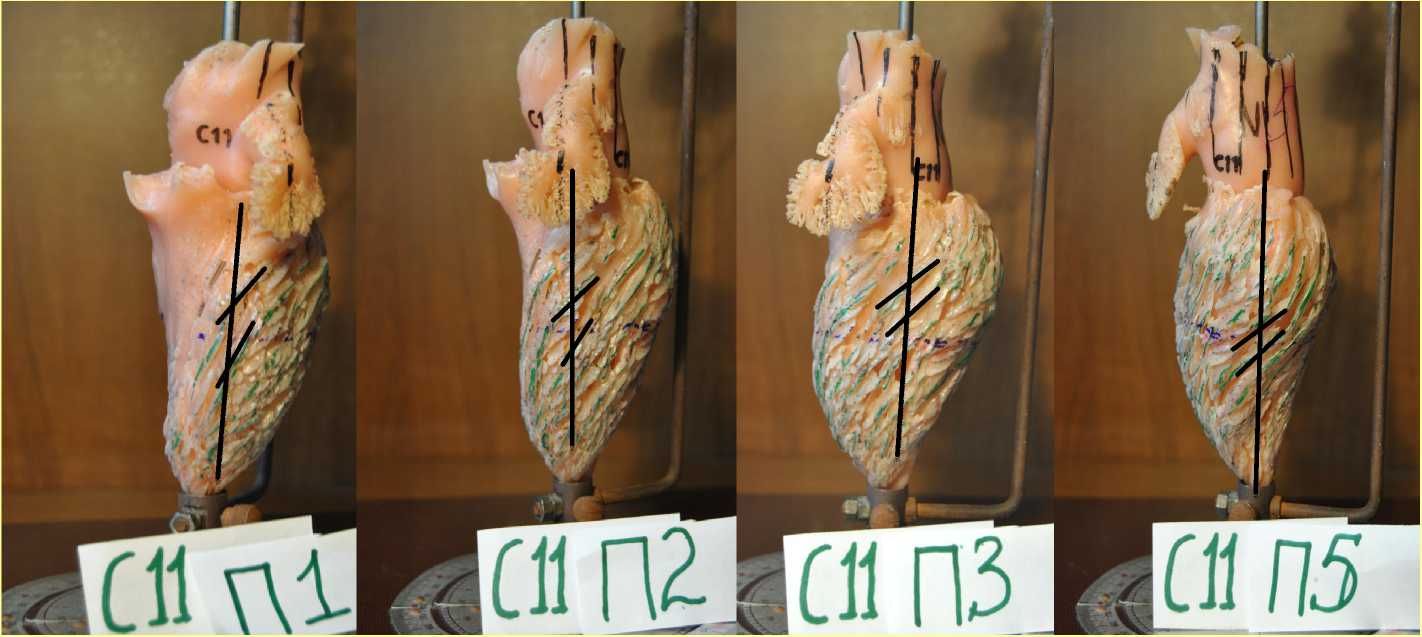
Figure 5. The cast of the human LV. The directions of the diastolic trabeculae and the projection axis of the flow filling the LV cavity at different positions of the cast are shown.
The studies of canine left ventricular casts and dynamic images of the left ventricular cavity produced by MSCT were carried out according to the same methodology.
The data were processed with IBM PC using Microsoft Excel.
Results
The measurement data of trabecular topology of the human left ventricular cast at different angular positions of the cast turned with a rotator are presented in Table 1 below. There were no cases recorded when a measuring error was under 10%. Nevertheless the error was in all cases less than the inaccuracy of measurements taken with the methods described in the earlier publications [21].
Table 1. Values of structural parameters of flow calculated for each projection for one left ventricular cast
|
Heart No. 13 |
С 0 /Г 0 , 1/m2 |
Z 0 , m |
Q, m3 |
|
Projection1 |
20,26 |
1,34•10-02 |
3,25•10-05 |
|
Projection 2 |
22,01 |
1,15•10-02 |
3,6•10-05 |
|
Projection 3 |
17,88 |
1,31•10-02 |
4,01•10-05 |
|
Projection 4 |
15,95 |
1,05•10-02 |
2,85•10-05 |
|
Projection 5 |
21,96 |
9,12•10-03 |
3,91•10-05 |
|
Projection 6 |
18,39 |
1,22•10-02 |
3,62•10-05 |
|
Average value |
19,41 |
1,16•10-02 |
3,54•10-05 |
|
Standard deviation |
2,42 |
1,64•10-03 |
4,27•10-06 |
|
Error |
12,49% |
14,05% |
12,08% |
A significant measurement error in a cast geometry analysis of this sort is quite explicable. First the intracardiac flow evolution occurs along a curved axis which is approximated as a straight line for the purpose of measurement. Second all parameters (position of the axis, turning angle for the cast, values of radii and longitudinal coordinates) are sensitive to positioning of the cast in space. The reproducibility of all measurements carried out with this method is a very important factor in this case.
The exact solutions establish unique functional relations between the parameters. Thus the С 0 /Г 0 value depends on the Q value in accordance with hyperbolic function of the first order:
C 0 = ctg α 1 ⋅ R 1
Г 0 4 π ⋅ Q
The Q parameter is linearly dependent on the longitudinal coordinate (Zi+Z0).
Constructing the plots showing the given dependences for human left ventricular casts has demonstrated that there is a high correlation between the measured values and the expected regularities (Fig. 6). This fact bears witness to the minor role of errors in measuring results.
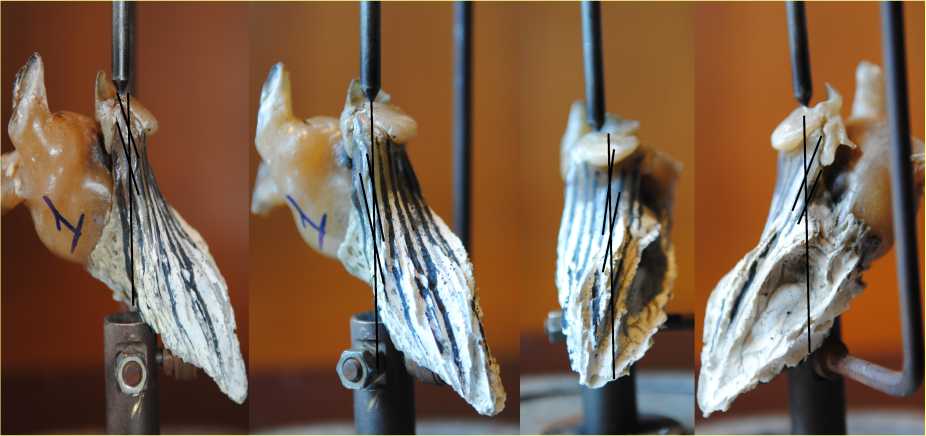
Figure 6. The cast of the canine LV. The directions of the systolic trabeculae and the projection axis of the flow ejected from the LV into the aorta at different positions of the cast are shown.
Similar measurements made on canine left ventricular casts confirmed the obtained regularity (Fig. 6). The only difference was in absolute values of the measured parameters that could be explained by differences in left ventricular cavity dimensions and the arterial bed length.
Measurement of the structural parameters of intracardiac blood flow according to the left ventricular trabeculae orientation on the dynamic images of the cavity produced with the MSCT showed the same dependence as it is the case with the human left ventricular casts (Fig. 6). It was considered as a criterion for the correctness of the conducted measurements. As a result, a plot С0/Г0 and Q parameters vs. time during a heart cycle was constructed (Fig. 7). This plotted dependence illustrates the nature of the evolution of swirling blood flow in the left ventricular cavity. The curve consists of two phases: the first phase corresponds to the diastole and is characterized by an increasing prevalence of azimuthal component of the velocity in the overall flow structure; the second one represents the left ventricular systole and exhibits the significant prevalence of the longitudinal and radial components of the velocity that reflects the processes of contraction and ejection of blood into the aorta. The Q parameter reflects the dynamics of change in the swirling flow volume in the left ventricular cavity.
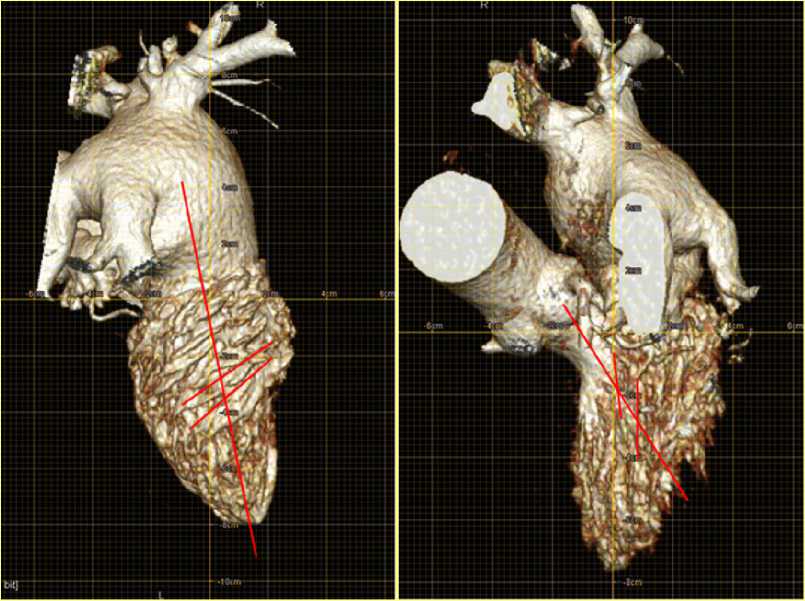
Figure 7. Images of the LV cavity produced by MSCT. The directions of the diastolic (left) and the systolic (right) trabeculae and the projections of the filling and the ejected flows.
The detected phenomenon reveals the mechanisms of the formation and the evolution of the blood flow in the left ventricular cavity with attributing the specific blood flow pattern to the relevant anatomic structures responsible for its formation. Actually, contrary to the existing concept that the trabeculae undertake primarily a structural function in the left ventricular cavity, it has been detected that their alignment, orientation and coordinated contraction play the decisive role in the formation of the tornado-like swirling flow in the heart. And the internal surface topology is structured in such a way that as much blood volume in the left ventricular cavity as possible is involved in the main dominant swirling where kinetic energy is accumulated owing to its rotation.
The trabecular topology structure changes its orientation during the isometric contraction phase. The contracted trabeculae of the anterior septal area and the papillary muscles, which reorganize the flow in the direction of the aortic valve, are protruding into the cavity lumen, and at the time of the opening of the cusps the flow is being ejected with a considerable acceleration consuming the energy accumulated in the left ventricle.
The fact that both systolic and diastolic trabeculae orientation provides continuity of the hyperbolic function indicates that a single dominant swirling is formed and evolved in the left ventricular cavity.
Its structure is formed owing to the guiding activity of the trabeculae, and the point of origin of coordinates moves together with the swirl passing two valves during the flow evolution. Due to the above motion the curvature of the swirling flow axis always exceeds the swirl flow radius, on the one hand, and the condition of axial symmetry is fulfilled, on the other hand. A theoretical analysis of the experimental data allows concluding that the velocity field of intraventricular swirling flow corresponds to the quasipotential radial convergence swirl described by exact solutions (1), that is the cause of the least hydraulic losses in case of the norm. Loss increase takes place under any discoordination in the heart contraction.
Along the whole length of channel “left ventricle – aorta” the blood flow follows the concave curvilinear surface. In this connection, mass forces of inertia act on the flow which transform the boundary layer into the three-dimensional one formed by surface swirls of Görtler type [2]. Such a boundary layer shows friction-related stresses being significantly less than it is the case with the Prandtl boundary layer [2] owing to the fact that shear stresses are replaced by stresses resulting from rolling of the flow when following the surface curvature. In this case the mechanism of hydraulic loss reduction is identical to that found in some aquatic animals, or to that found on streamlined surfaces modified with special hollows, the topology of which also generates the tornado-like quasipotential jets [24].
Due to necessary existence of the three-dimensional boundary layer organized by swirl types showing smaller sizes, as compared with the main flow, the secondary swirl flows providing the contact between the cavity wall and the main swirling flow can appear in the cavity. These secondary flows can be clearly seen on the intracardiac flow images obtained with MRI or colour Doppler echocardiography, and they might hinder the proper identification of the main swirled jet.
The swirling flow formed in the left ventricular cavity is organized in such a way that no stagnation and separations in the flow are available. A flow of this sort can exist in a wide range of states within the norm. The flow pattern will change in case of pathologies, like contraction abnormalities, or an increase in ventricular and aortic wall stiffness. At the same time, the secondary swirl flows should gain a greater partial weight. In case of severe abnormalities in the cavity geometry, for instance, in case of the left ventricular aneurysm formation, a considerable stagnation area appears in the cavity of aneurysm that, as a rule, leads to thrombosis. It is well-known that the nature of trabeculation may alter due to a pathologic change in the anatomy of the left ventricular cavity. Actually, in pathologic remodeling, the flow in the changed cavity should move along other trajectories than it is the case under the normal conditions. In its turn, it requires other modes of the performance for trabeculae. The trabeculae interacting dynamically with the flow change their orientation and expression. Therefore, the nature and the direction of the trabecular topology are very important diagnostic marker allowing assessing the intracardiac blood flow state.
It is possible to evaluate the main trabeculation features with the use of modern diagnostic methods, e.g., MSCT. Images produced with MSCT are sufficiently informative and may be utilized to take the required measurements and determine the peculiarities of the intracardiac blood flow (Fig. 8,9).
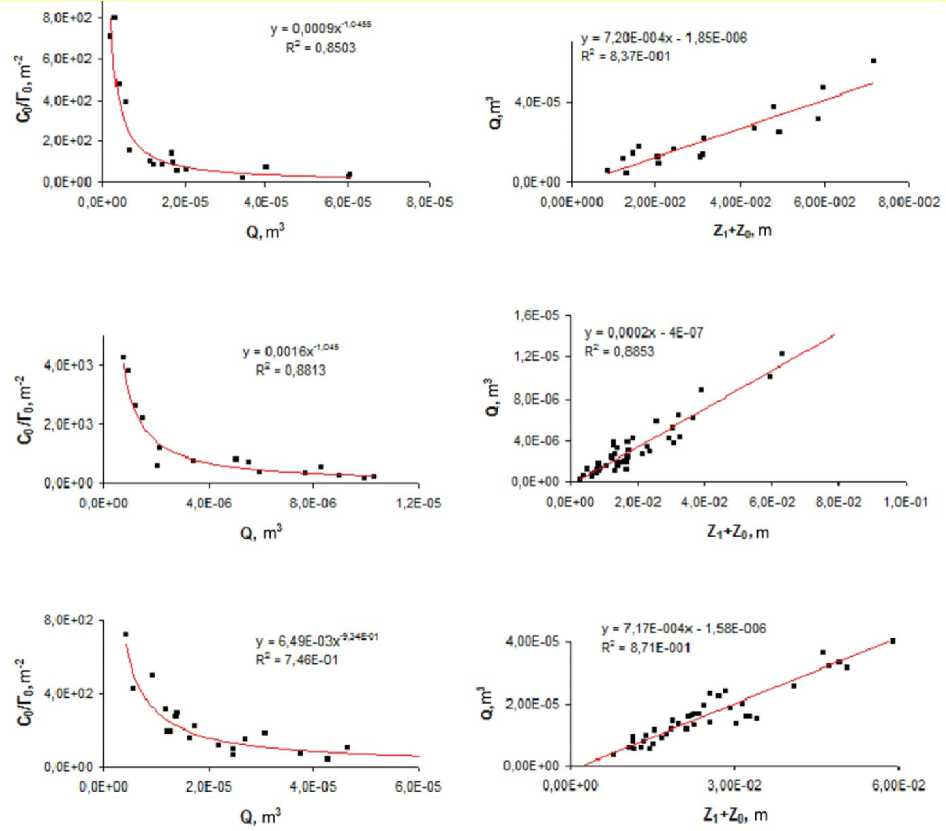
Figure 8. Dependences of the structural parameters C 0 /Г 0 , Q and Z i + Z 0 of the flow obtained on the images of the left ventricle in two patients (the top plots show the human LV casts, the middle plots show the MSCT images, and the lower plots show the canine LV casts, respectively).
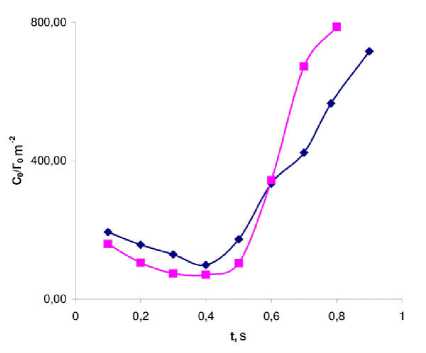
Figure 9. The dynamics of the change in the C 0 /Г 0 parameter during the cardiac cycle in two patients with no significant changes in the cardiodynamics according to MSCT (beginning of the ejection 0.5 s.).
References Analysis of structure of intraventricular blood flow based on studies of architectonics of trabecular layer in left ventricle
- Bockeria LA, Gorodkov AY, Kiknadze GI, Sokolov MV. Analysis of blood flow pattern in the left ventricle and aorta on the basis of exact solutions of non-stationary hydrodynamic equations in viscous fluid. Bulletin of Bakoulev CCVS RAMS for Cardiovascular Surgery. 2002;3(7):99.
- Bockeria LA, Gorodkov AY, Nikolayev DA, Kiknadze GI, Gachechiladze IA. An Analysis of the Velocity Field of a Swirled Blood Flow in the Aorta on the Basis of Three-Dimensional Mapping by MP Velosymmetry. Bulletin of Bakoulev CCVS RAMS for Cardiovascular Surgery. 2003;4(9):70-74.
- Burakovsky VI, Dobrova NB, Kuzmina NB, Agafonov AV, Royeva LA, Drogaitsev D, et al. Blood flow mode in the heart left ventricle. Experimental surgery and anaesthesiology.1976(3):13-16. ISSN: 0201-7563.
- Batchelor GK. An Introduction to Fluid Dynamics. Cambridge University Press; 28 févr.2000.
- Gorodkov AY. Analysis of the intracardiac swirled blood flow based on morphometry of the left ventricle trabecular relief. Bulletin of Bakoulev CCVS RAMS for Cardiovascular Surgery. 2003;4(9):61-66.
- Gorodkov AY, Nikolayev DA. An Analysis of the Dynamic Characteristics of a Swirled Blood Flow on the Basis of Measurement of the Geometric Parameters of a Flow Channel by MP Tomography. Bulletin of Bakoulev CCVS RAMS for Cardiovascular Surgery. 2003;4(9):67-69.
- Gupta A, Lilli D, Saired V. Swirled Flows [in Russian]. Moscow: Mir; 1987.
- Kiknadze GI, Gachechiladze IA, Alekseev VV. Tornado-like Jet Self-organization in Viscous Continuum Flows and Heat and Mass Transfer Intensification During This Phenomenon. Moscow: Izdatelstvo MEI; 2005.
- Kiknadze GI, Krasnov YuK. Evolution of a spout-like flow of a viscous fluid. Sov Phys Dokl. 1986;31:799-801.
- Pedley TJ. The fluid mechanics of large blood vessels. Cambridge: Cambridge University Press; 1980.
- Khalatov AA. Theory and practice of swirled flows [in Russian]. Kiev: Naukova Dumka; 1989.
- Schlichting G. Boundary Layer Theory. Moscow: Nauka; 1969.
- Colman RW, Marder VJ, Clowes AB, George JN, Goldhaber SZ. Hemostasis and Thrombosis: Basic Principles and Clinical Practice. Philadelphia: Lippincott Williams & Wilkins; 2006.
- Coulter NAJ, Pappenheimer JR. Development of turbulence in flowing blood. Am.J.Physiol. 1949;159(2):401-408.
- Frazin LG, Vonesh MJ, Chandran KB, Shipkowitz T, Yaacub AS, McPherson DD. Confirmation and initial documentation of thoracic and abdominal aortic helical flow. An ultrasound study. ASAIO J. 1996 Nov-Dec;42(6):951-956. PMID:8959268.
- Gray J. Studies in animal locomotion VI. The propulsive powers of dolphin. J. Exp. Biol. 1936;13:192-199.
- Irisawa H, Wilson MF, Rushmer RF. Left ventricle as a mixing chamber. Circulation Res. 1960 Jan;VIII:183-187. PMID: 13852999.
- Kiknadze GI, Gachechiladze IA, Gorodkov AJ, Baquey C, Barat JL. 3D quantitative analysis of flow velocity field inside the aorta during one cardiac contraction. CIMTEC 2002 -3rd Forum on new materials 6th Int. Conf “Materials in Clinical Applications”; 2003.
- Kilner PJ, Yang GZ, Mohiaddin RH, Firmin DN, Longmore DB. Helical and retrograde secondary flow patterns in the aortic arch studied by three-directional magnetic resonance velocity mapping. Circulation. 1993;88 (part 1) DOI: 10.1161/01.CIR.88.5.2235
- McDonald DA. Blood Flow in Arteries. London: Arnold; 1974.
- Morbiducci U, Ponzini R, Rizzo G, Cadioli M, Esposito A, De Cobelli F, et al. In vivo quantification of helical blood flow in human aorta by time-resolved three-dimensional cine phase contrast magnetic resonance imaging. Ann. Biomed. Eng. 2009;37(3):516-531. PMID:19142728 DOI: 10.1007/s10439-008-9609-6
- Singupta PP, Korinek J, Bolohlavek M, Narula J, Vannan MA, Jahangir A, et al. Left ventricular structure and function: basic science for cardiac imaging. J. Am. Coll. Cardiol. 2006;48(10):1988-2001. PMID: 17112989.
- Stonebridge PA, Hoskins PR, Allan PL, Belch JF. Spiral laminar flow in vivo. Clin Sci (Lond). 1996;91:17-22.
- Taylor DEM, Wade JD. Pattern of blood flow within the heart: a stable system. Cardiovasc. Res. 1973 Jan;7(1):14-21. PMID: 4694955.
