Analysis of the development differences in Hungarian LAU1 districts

Author: Lrinc Balzs, Kposzta Jzsef
Journal: Региональная экономика. Юг России @re-volsu
Section: Фундаментальные исследования пространственной экономики
Article in issue: 2 т.10, 2022.
Free access
The complex analysis of different territorial units, regions or micro-regions is a very topical issue today, both globally and in Hungary. As we know, it is the continuity of changes at the spatial level that causes spatial inequalities, so it can be said that no two spatial units on Earth have the same characteristics. These changes have an impact on the economic growth, competitiveness and spatial development of a given territory, as well as on the living conditions and living standards of its inhabitants. As a result of the continuous changes in social, economic and infrastructural factors, we will examine a very complex issue, the main focus of which will be on the developmental differences and trends in the Hungarian districts (LAU1). In Hungary, the district system, which is the territorial level between settlements and counties, has a long history, since the earliest districts were established in the 13th century as administrative formations. Nowadays, districts (LAU1) are also located between the administrative level of counties and municipalities, as the lowest territorial and organisational level of state administration. The establishment of districts and the amendment of the related legislation is provided for in Act XCIII of 2012. In total, there are 197 districts, 23 of which are in the capital city.
Regional economy, complex development index, social factors, economic factors, infrastructural factors, centrum, periphery, lau1 districts
Short address: https://sciup.org/149140617
IDR: 149140617 | UDC: 336.1 | DOI: 10.15688/re.volsu.2022.2.8
Анализ региональных различий развития в районе LAU1 Венгрии
Комплексный анализ различных территориальных единиц, регионов или микрорегионов является сегодня важным вопросом для исследователей как в международном масштабе, так и в Венгрии. Как мы знаем, именно продолжительность преобразований на пространственном уровне вызывает пространственные неравенства, поэтому можно сказать, что никакие две пространственные единицы на Земле не имеют одинаковых характеристик. Данные изменения влияют на экономический рост, конкурентоспособность и пространственное развитие на данной территории, так же как и на условия жизни населения. В связи с постоянными изменениями в социальных, экономических и инфраструктурных факторах, авторами был исследован очень сложный вопрос, связанный с увеличением разрывов в развитии между регионами Венгрии (LAU1). В Венгрии система районов c территориальным уровнем организации поселков и округов имеет долгую историю, поскольку самые первые регионы были основаны еще в XIII в. как административные единицы. Сегодня районы (LAU1) также расположены на уровне округов и муниципалитетов, как наименьший территориальный и организационный уровень государственного территориального управления. Организация районов и корректировка имеющегося законодательства прописана в законе Act XCIII 2012 года. В целом в стране насчитывается 197 районов, 23 из которых расположены в крупных городах.
Text of the scientific article Analysis of the development differences in Hungarian LAU1 districts
DOI:
The starting point for the analysis is the Hungarian Government Decree 290/2014 [290/2014. Hungarian Government Decree ... , 2014] on the classification of beneficiary districts. A comparison of the development of each district was carried out using a set of 24 indicators. The indicator values of the districts are produced by aggregating the data of the municipalities. The beneficiary is the district whose calculated complex indicator is below the average of the complex indicators of all districts. Using this threshold, the government decree in force since January 1, 2015 has classified 109 districts as beneficiaries, of which 18 are classified as “developable” and 36 as “developable by a complex programme”. In our opinion, the period since 2015 has brought major changes in economic, social and infrastructural indicators, including the level of development of each district. Based on these findings, we believe that it is worthwhile to examine the current level of development of the Hungarian districts and to explain the changes in the perspective of the period.
In Hungary, territorial disparities can be described in a fine structure, mainly at the district level. In the case of underdeveloped LAU1 districts, there is a high degree of simplification at county or regional level. For there are underdeveloped settlements or groups of settlements in the central region as well, and dynamically developing parts can be found in less developed counties and regions [Enyedi, 2004; Péli, Neszmélyi, 2015].
Looking at the territorial aspects of development, the aim cannot be other than to create successful regions. However, success is not just a one-dimensional factor. In addition to the competitiveness criterion, environmental sustainability and social progress must also be taken into account [Bodnár, 2020; Bonifert, 2003].
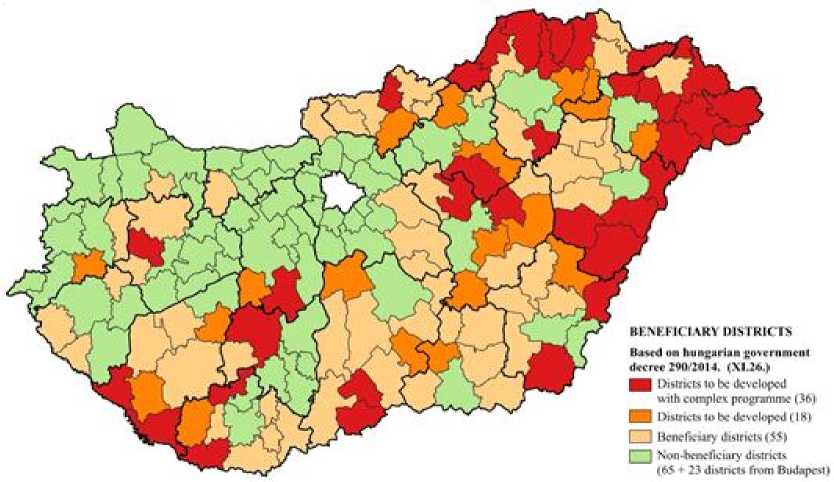
Fig. 1. Beneficiary districts (without Budapest’s districts)
Note. Source. Edited by the Authors, based on [Hungarian (LAU1) districts ... , 2012; 290/2014. Hungarian Government Decree ... , 2014].
But the question may arise: what are the factors that lead to success? In prosperous regions incomes are rising. If a significant proportion of this income is invested and used locally, then a wide range of the local population can benefit, so that a rise in local living standards can be described as an expected consequence. Ideally, development should affect all settlements in a given region, so that territorial disparities can be reduced by, among other things, developing the local economy and endogenous resources [Enyedi, 1998; Kassai, Molnár, 2016; Nagy Molnár, Lendvay, 2018].
International and national experience shows that endogenous resource development can provide new impulses to the target area, such as:
– growth can be triggered by rethinking the natural, environmental, economic and human potential of the area;
– economic development trends can be developed that are capable of attracting external resources to the area, building on its internal potential;
– the wealth generated by the new jobs created will concentrate disposable income in the region, thus reducing the risk of social crisis (emigration, ageing population) and economic and infrastructural decline;
– in addition to the integration of these factors, the cultural traditions of the areas concerned and the growing participation of the population in social decisionmaking can trigger community development, which can bring untapped resources to the area [Káposzta, 2014].
On this basis, territorial potential is the sum of the endogenous resources of a region. Their interconnections, overlaps and networks can offer new dimensions for economic development, so that spatial renewal can shape a new development path [Lengyel, 2003].
Based on the basic theses of territorial inequalities and endogenous development in Hungary, it is also necessary to discuss the centre-periphery model. In this system, there is an unequal dependence between the centre and the periphery, where the centre, playing a central role, has an influential and dominant role over the periphery. The centre-periphery model is a multilevel relationship, where a place or an entity or a social group or institution that is the centre at one level may be peripheral in another [Csatári, 2006].
Territorial disparities are largely rooted in the unequal geographical distribution of economic factors. The structure of the economy and technological change, the range of economic factors has been fundamentally changed. The spatial location of the economy has become highly elastic in the 21st century [Enyedi, 2004; Nemes Nagy, 2005].
In the case of the centre-periphery model, it is necessary to consider the social, behavioural and political contexts in addition to the economic perspective. Development in the spatial context is shaped by human actions and their social interactions, while at the same time the characteristics of the territories determine these actions.
On the one hand, development shapes the spatial structure, and on the other, the system of territorial relations influences the development process. Development can be understood as a series of innovations and thus as a comprehensive system of innovations. On this basis, development can be distinguished from growth [Camagni, 2009; Lengyel, 2021].
Territorial development, including the improvement of the quality of rural life, can only be achieved if the drive for qualitative change is not only driven by top-down regulation, but also if the society and businesses in the area are open to development. It is also necessary to mention the role and responsibility of those involved in local economic development, who must set short-, medium- and long-term objectives, choose the right priorities and the right means of implementation and the right people involved. In line with the subsidiarity principle of the European Union, local economic development can be an initiative with a wealth of opportunities, but also with considerable risks [Cohen, 2015; Nagy, 2018].
The development of rural areas is primarily aimed at exploiting and activating endogenous resources and territorial potential. The theoretical foundations for this development can be derived from local development performance and its development capacity, and can even generate growth in the larger territorial unit, so that the sum of economic development based on comparative local advantages can provide the basis for regional development [Faragó, 2016; Káposzta, Ritter, Nagy, 2016].
In summary, territorial development varies according to economic and social development. Other important factors are the shortening of distances, the development of the mobility of human capital and the enhancement of local values and traditions, and thus the need to use endogenous resources that have not yet been exploited.
Method
The research was based on the delimitation according to the 290/2014. Hungarian Government Decree [290/2014. Hungarian Government Decree ... , 2014] and the same methodology applied there.
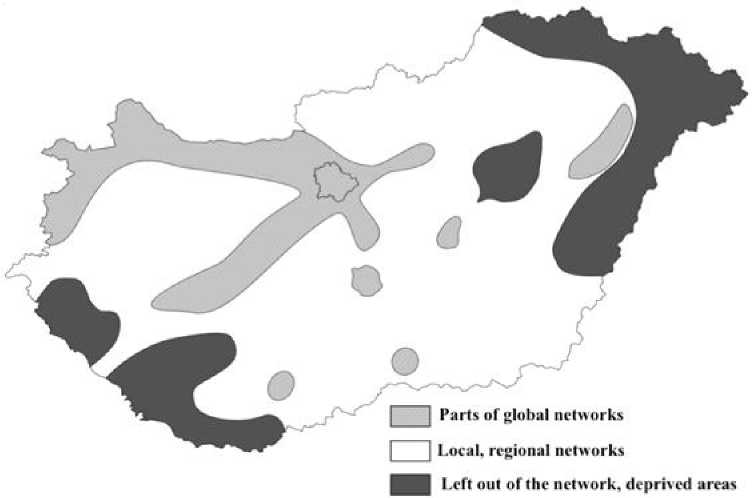
Fig. 2. The triple spatial structure of Hungary
Note. Source. Edited by the Authors, based on [Enyedi, 2004].
In terms of the indicators used, however, we have deviated from the indicators defined in the Government Decree, since for some indicators there are no recent data available, and we believe that the 14 basic indicators we used can be used to identify the differences in development of the Hungarian (LAU1) districts. The 14 indicators are presented in Table 1.
However, we feel it is necessary to extend the set of indicators, for which the 2022 Hungarian census will provide complete data. We also feel it necessary to mention that our study covers the 174 Hungarian (LAU1) districts, the values of the 23 districts of Budapest were not included in the analysis.
Table 1
Basic indicators used for the study
|
NAME OF INDICATOR |
UNIT OF MEASUREMENT |
|
DEMOGRAPHIC GROUP |
|
|
Population density |
persons per square kilometre |
|
Ageing index |
% |
|
Depend ency index |
% |
|
Natural rcproduction/decrcasc |
%. |
|
Migration balance |
|
|
ECONOMIC GROUP |
|
|
Annual net income per resident |
HuF/persons |
|
Share of high and low income earners |
% |
|
Unempl oyment rate |
% |
|
Number of jobseekers registered for more than 180 days as a percentage of all jobseekers |
% |
|
INFRASTRUCTURAL GROUP |
|
|
Population per 100 dwellings |
persons |
|
Utility scissors |
% |
|
Number of cars per 1000 inhabitants |
%. |
|
Number of Internet subscriptions per 1000 inhabitants |
%= |
|
Number of nursery places per 1000 inhabitants aged 0-2 |
|
Note. Source. Edited by the Authors, based on [Hungarian Central Statistical Office ... , 2020].
The methodology used consists of three main steps:
-
1. Normalisation of basic indicators (N = 14/LAU1 districts):
-
2. Calculation of group indicators (N = 3/LAU1 districts):
-
3. Calculation of the complex development index (N = 1/LAU1 districts):
,j max(fai, j) –min(fai, j) , where fai, j = normalised basic indicator; min (fai, j) = minimum value of the basic indicators; max (fai, j) = maximum value of the basic indicators.
fa- = j Z ■ = 1 K,, (2)
where fai = group indicator; fai, j = normalised basic indicator; n = number of indicators in group.
fi =1 Z "/a. (3)
m 1
where fa = group indicator; f = complex indicator (complex development index); m = number of group indicators.
The classification of (LAU1) districts into 4 groups (according to the complex development index) was done by double averaging.
First, taking the overall average (N = 174), we divided the districts into two groups (below average and above average), then, taking the average of those below the overall average and the average of those above the overall average, we further divided the districts into 2-2 groups, thus forming the 4 development groups (Table 2).
Table 2
The classification of the LAU1 districts
|
The name of the group |
|
|
Below average |
Deprived districts |
|
Lagging districts |
|
|
Above average |
Emerging districts |
|
Flagship districts |
Note. Source. Edited by the Authors.
QGIS 3.14 software was used for graphical representation and map editing.
Results
This part of the paper presents our own research findings. The spatial structure of Hungary was analysed at LAU1 district level in 2015 and 2019. However, we can define the writing of this article as a first step in our research, which will serve as a starting point for a comprehensive and complete study in the future, and to identify the development potential of Hungarian districts and the catching-up target areas for underperforming LAU1 districts. Figure 3 and Figure 4 shows the values of the complex development index for 2015.
Based on the classification, 97 LAU1 districts have below average values (55.75% of all LAU1 districts), of which 45 are classified as deprived districts and 52 as lagging districts. These districts perform below the national average in terms of population, economy and infrastructure. These LAU1 districts are typically located in the northern, northeastern and eastern border regions (Slovak, Ukrainian and Romanian borders) and in the NUTS 2 South Transdanubian region, but there are also so-called inner peripheries (e.g. in Bács-Kiskun county or in the Central Tisza region).
There are 77 more developed LAU1 districts (44.25% of all LAU1 districts) with above average performance in Hungary. From the 77 districts: 47 belong to the emerging group and 30 to the flagship group. The more developed districts along the highways are striking, and both the Budapest agglomeration ring and the Budapest-Vienna axis are clearly visible. In addition, the development of districts with rural regional centres can be observed (e.g. Nyíregyháza, Debrecen, Szeged) (Fig. 3, 4).
Figure 5 and Figure 6 shows the values of the complex development index for 2019.
In 2019, there are spatial changes compared to the 2015 level of development. The number of districts in the most deprived group has decreased by 6 (N = 39), which may represent an improvement.
At the same time, the number of districts in the below average group shows an increase, as the number of lagging districts increased by 11 (N = 63). Overall, the number of below average districts has increased by 5 (from 97 to 102) in 5 years (58.62% of all LAU1 districts are in the below average group).
The number of districts performing above average decreased from 77 to 72 (41.38% of all LAU1 districts), with the number of flagship districts increasing by 1.
The spatial distribution clearly shows that it is not just 1 to 1 district that has changed. The Budapest agglomeration and the districts along highways (e.g. the M5 highway to Kecskemét) have followed a developing path over the 5-year-period.
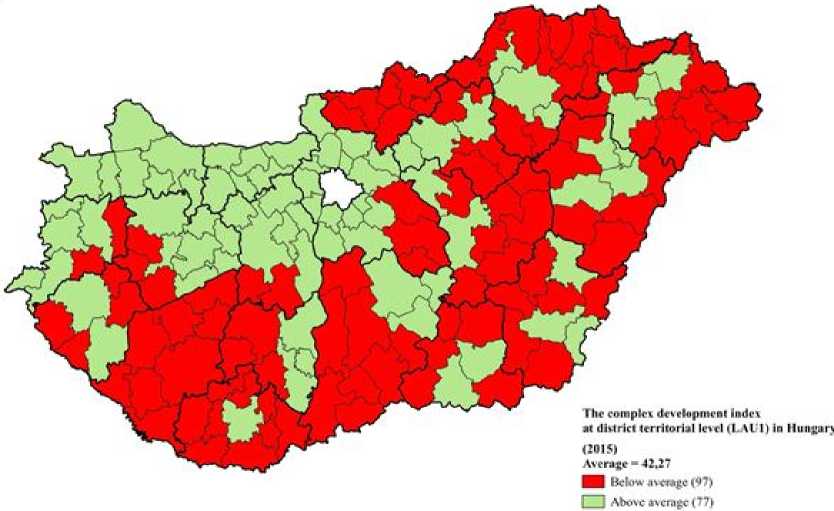
Fig. 3. The complex development index at district territorial level (LAU1) in Hungary in 2015 (Vol. 1) Note. Source. Edited by the Authors, based on [Hungarian Central Statistical Office ... , 2020].
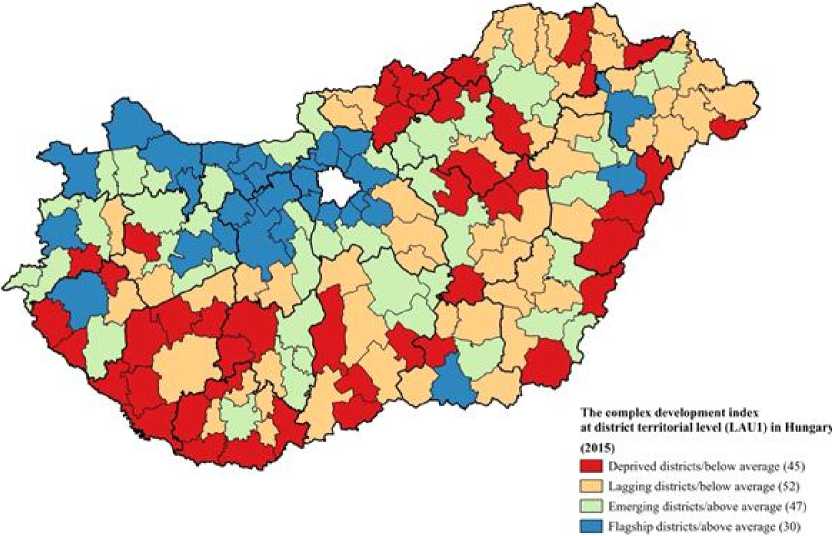
Fig. 4. The complex development index at district territorial level (LAU1) in Hungary in 2015 (Vol. 2) Note. Source. Edited by the Authors, based on [Hungarian Central Statistical Office ... , 2020].
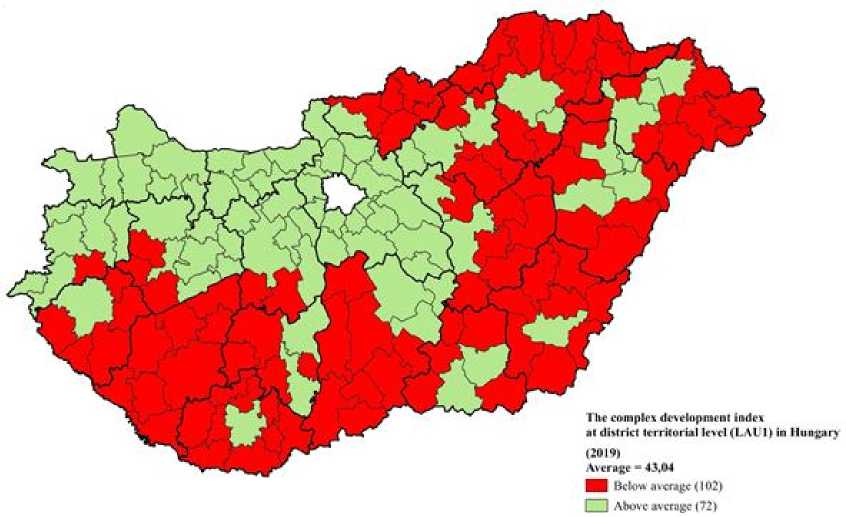
Fig. 5. The complex development index at district territorial level (LAU1) in Hungary in 2019 (Vol. 1) Note. Source. Edited by the Authors, based on [Hungarian Central Statistical Office ... , 2020].
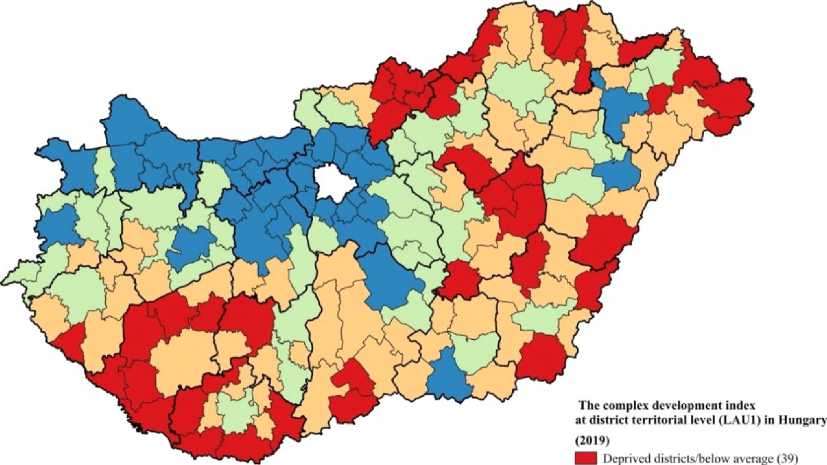
I I Lagging districts/below average (63)
I | Emerging districts/abovc average (41) ■ Flagship districts/abovc average (31)
Fig. 6. The complex development index at district territorial level (LAU1) in Hungary in 2019 (Vol. 2) Note. Source. Edited by the authors, based on [Hungarian Central Statistical Office ... , 2020].
The growth in the values of districts close to the centre (e.g. Pest county, Fejér county) shows a strong centre effect, so that the level of development of these districts increases steadily with their proximity to Budapest.
On the other hand, there is also an increase in the number of below-average performing districts and their “conquest”, as the declining level of development of border districts is very pronounced, and the deprivation region extending to the Central Tisza region is also strongly present (Fig. 5, 6).
Conclusion
In conclusion, regional level studies will prove to be very important for Hungary in the future, for the design and implementation of development strategies. Our study clearly shows the more developed and less developed or backward regions of the country.
The centrality of Budapest, and thus the development of the Budapest agglomeration ring, is very striking. In addition, the Budapest-Győr axis (M1 highway line) is the most competitive economic region in the country. In addition, the level of development of the other areas along the highway corridors (M3 [Budapest-Gyöngyös], M4 [Budapest-Szolnok], M5 [Budapest-Kecskemét], M6 [Budapest-Szekszárd], M7 [Budapest-Székesfehérvár]) is well above the national average.
The districts with rural regional centres (e.g. Nyíregyháza, Debrecen, Szeged) show outliers in their own region in the period under review. At the same time, the set of districts in the periphery of the border region (Slovakia-Ukraine-Romania) and the set of districts with below-average values reaching as far as the Central Tisza region are also of decisive importance in determining Hungary’s development.
In order to develop some of the more backward districts, we believe that it is necessary to exploit endogenous resources and to develop well-designed development strategies. In our opinion, the catching-up of underdeveloped districts will be indispensable in the near future (e.g. local economic development, infrastructure development or human resources development). If the currently underperforming districts cannot keep pace with the centre regions in the future, the spatial structure of Hungary will drift towards a bipolar division (developed – underdeveloped) in terms of regional development and welfare indicators. This process could lead to the creation of internal peripheries, income inequalities and a radical reduction of the so-called “social middle class” in the future.
In our further research, we will seek to address these issues by expanding our set of indicators, by methodological developments and by drawing on international practices and experiences.
NOTE
1 Supported by the ÚNKP-21-3-I-MATE/41. New National Excellence Program of the Ministry for Innovation and Technology from the source of the National Research, Development and Innovation Fund.

Uj Nemzeti innovacios Es Technologiai
Kivaldsag Program miniszterium
References Analysis of the development differences in Hungarian LAU1 districts
- Bodnár G., 2020. Analysis of Endogenous Development Factors in Rural Areas. Szeged, JATEPress. URL: http://eco.u-szeged.hu/download.php?docID=111217 (accessed 17 November 2021).
- Bonifert D., 2003. The Role of Small Regions in the Countries of the European Union and in Hungary. Village-City-Region, no. 5, pp. 6-11. URL: https://regionalispolitika.kormany.hu/falu-varos-regio (accessed 19 November 2021).
- Camagni R., 2009. Territorial Capital and Regional Competitiveness: Theory and Evidence. Capello R., Nijkamp P., eds. Handbook of Regional Dynamics and Growth: Advances in Regional Economics, pp. 118-132.
- Csatári B., 2006. Small Towns and Suburbs. URL: https://mrtt.hu (accessed 18 November 2021).
- Cohen B., 2015. The Smartest Cities in The World 2015: Methodology. URL: https://www.fastcompany.com/3038818/the-smartest-cities-in-the-world-2015-methodology (accessed 12 November 2021).
- Enyedi G., 1998. Successful Regions. Enyedi G., Varga K., Scharle P., Borvendég B., Szaló P., Fejerédy T., Kolundzsija G. Book of Facts: Regions. Budapest, Greger-Delacroix, pp. 409-411.
- Enyedi G., 2004. Regional Processes in Post-Socialist Hungary. Magyar Tudomány (2004/9), HU, pp. 935-941. URL: www.matud.iif.hu/2004-09.pdf (accessed 20 November 2021).
- Faragó L., 2016. Socio-Spatial Inequalities. Space and Society, no. 30 (3), pp. 118-123. DOI: 10.17649/TET.30.3.2803
- Hungarian (LAU1) Districts Based on Act XCIII of 2012, 2012. URL: https://www.ksh.hu/teruletiatlasz_jarasok (accessed 11 May 2021).
- Hungarian Central Statistical Office: KSH-TSTAR Data Tables (TeIR) (2015–2019), 2020. URL: https://teir.hu (accessed 17 November 2021).
- Káposzta J., 2014. Major Coherences of the Creation of Territorial Inequalities. Scientific Journal on Agricultural Economics, vol. 58, iss. 5, pp. 399-412. URL: http://www.gazdalkodas.hu/index.php?l=hu&p=cikk&cikk_id=1076
- Káposzta J., Ritter K., Nagy H., 2016. Local Economic Development in Transition Economies: A Tool for Sustainable Development of Rural Areas. Erokhin V. Global Perspectives on Trade Integration and Economies in Transition. Hershey, IGI Global, pp. 281-298.
- Kassai Zs., Molnár M., 2016. The Social Success Factors of Local Rural Development. Ritter K., ed. Economic and Local Aspects of Rural Development. Gödöllő, Szent István Egyetemi Kiadó, pp. 108-117.
- Lengyel I., 2003. Competition and Territorial Development: Competitiveness of Regions in Hungary. Szeged, JATEPress. URL: https://eco.uszeged.hu/download. php?docID=40089 (accessed 21 November 2021).
- Lengyel I., 2021. Regional and Urban Economics. Szeged, Szegedi Egyetemi Kiadó. URL: http://eco.uszeged. hu/download.php?docID=122513 (accessed 30 November 2021).
- Nagy H., 2018. Cooperation Opportunities for Local Economic Actors to Enhance the Competitiveness of Rural Areas. Studia Mundi – Economica, no. 5 (1), pp. 24-32. DOI: 10.18531/Studia.Mundi.2018. 05.01.24-32
- Nagy Molnár M., Lendvay E., 2018. New Method to Support Decision Making Process in the Local Economic Development of Hungary. Regional Statistics, vol. 8, no. 2, pp. 69-91. DOI: 10.15196/RS080207. URL: https://www.ksh.hu/docs/hun/xftp/terstat/2018/rs080207.pdf
- Nemes Nagy J., 2005. Waiting for a Turn – Waves of Regional Disparities. Dövényi Z., Schweitzer F. Dimensions of Geography. Hungary, MTA FKI, pp. 141-158. URL: http://geogr.elte.hu/REF/PDF/nnjhullamok.pdf (accessed 29 November 2021).
- Péli L., Neszmélyi Gy.I., 2015. Territorial Differences of Rural Cities and the Development of Transport Infrastructure in Hungary. Romanian Review of Regional Studies: Journal of the Centre for Regional Geography, vol. 11, no. 2, pp. 69-84.
- 290/2014. Hungarian Government Decree on the Classification of the Beneficiary Districts, 2014. URL: https://net.jogtar.hu/jogszabaly?docid=a1400290.kor (accessed 12 May 2021).
