Analyzing Student Evaluations of Teaching in a Completely Online Environment

Author: Nyme Ahmed, Dip Nandi, A.G.M. Zaman
Journal: International Journal of Modern Education and Computer Science @ijmecs
Article in issue: 6 vol.14, 2022.
Free access
Almost all educational institutions have shifted their academic activities to digital platforms due to the recent COVID-19 epidemic. Because of this, it is very important to assess how well teachers are performing with this new way of online teaching. Educational Data Mining (EDM) is a new field that emerged from using data mining techniques to analyze educational data and making decision based on findings. EDM can be utilized to gain better understanding about students and their learning processes, assist teachers do their academic tasks, and make judgments about how to manage educational system. The primary objective of this study is to uncover the key factors that influence the quality of teaching in a virtual classroom environment. Data is gathered from the students’ evaluation of teaching from computer science students of three online semesters at X University. In total, 27622 students participated in these survey. Weka, sentimental analysis, and word cloud generator are applied in the process of carrying out the research. The decision tree classifies the factors affecting the performance of the teachers, and we find that student-faculty relation is the most prominent factor for improving the teaching quality. The sentimental analysis reveals that around 78% of opinions are positive and “good” is the most frequently used word in the opinions. If the education system is moved online in the future, this research will help figure out what needs to be changed to improve teachers’ overall performance and the quality of their teaching.
Decision Tree, Educational Data Mining, Faculty performance evaluation, Online educational environment, Sentimental analysis, Teaching quality, Word cloud
Short address: https://sciup.org/15019093
IDR: 15019093 | DOI: 10.5815/ijmecs.2022.06.02
Text of the scientific article Analyzing Student Evaluations of Teaching in a Completely Online Environment
Student evaluations of teaching, also known as SET, is an integral aspect of universities' programs for selfimprovement. SET has three primary purposes: (a) to improve teaching quality, (b) to inform tenure/promotion choices, and (c) to demonstrate an institution's accountability [6]. Improving teaching quality is a major academic objective for all universities. Most people see the university as just another business, and every company's primary goal is to meet the requirements of its clients. In this instance, university clients are students. Because of this, it is important to think about how students feel in order to improve the quality of teaching. At the end of semester SET are typically given out anonymously. Students are asked to evaluate various aspects of the course and the teacher on a Likert scale. In addition to specific course details, such as course structure or grading policies, many SET give an overall assessment of the teacher and the course. SET may also include open-ended questions, in which students are invited to provide opinions on the course and the teaching methods of the teacher [7].
The aim of this study is to provide an extensive analysis of student evaluations of teaching in a completely online environment by using educational data mining. Educational Data Mining (EDM) is a technique used by educational institutions to locate usable data that can aid in the improvement of their educational activities. Thirty-five course evaluations of teaching were gathered from three fully online semesters to analyze, where computer science students at X University were participated anonymously. This study will assist in identifying the factors that play a significant role in improving teaching quality. If the need arises to move from an online to a traditional classroom setting, this research can serve as a guide for improving teaching quality. Moreover, it can also be used as a guide to make major educational decisions, particularly for computing students.
The study is comprised of five sections, which are structured as follows, an introduction is found in section 1, followed by a summary of the overall situation of student evaluations of teaching in section 2. The methodology is stated in section 3. Section 4 includes the analysis of the obtained data and findings. Lastly, section 5 consists of the conclusion and discussion.
2. Background Study 2.1. Classification and analysis of Likert scale questions
The educational environment often uses data mining techniques to explore and evaluate teaching performance in order to improve the quality of teaching. There are various educational data mining techniques such as Naive Bayes, K-Nearest Neighbors, Decision Tree, Association Rules Mining, Regression, and many more for identifying the main factors of SET and classifying the courses based on the rating of SET. This study [7] employed decision tree analysis to predict high overall teaching and course scores on a SET instrument. There were 98,525 SET records for 2,870 instructors across 5,076 course sections. Both the “teaching effectiveness” decision tree and the “course effectiveness” tree utilized a total of 96,385 and 95,780 SETs, respectively. SET was comprised of 16 evaluation elements. Results showed that helping students grasp course material and offering an intellectually exciting class were most predictive of a student's overall teacher evaluation. On the other hand, helping the student better grasp the course material and assignments that helped students learn the topic were the two factors that were most predictive of a student's overall rating of the course. This paper [8] applied data mining to evaluate teaching quality. As for test data, they extracted 3000 records, which included information on teachers' qualities, teaching duties, and evaluations. They constructed two data mining models (Association Analysis and Decision Tree) to describe how instructor and course quality affected evaluations. The investigated data revealed several hidden correlations between the teacher's features and the results of in-class teaching quality evaluations. They also showed how course features such as property, credit, week-hour, and number of students affected teaching quality evaluation outcomes. The goal of this study [9] was to make and test a measuring tool that could be used to rate university professors. The original sample contained a total of 1297 students' ratings. Using the Evaluation of Teaching Performance (ETP) questionnaire, 28 items were categorized into three factors: planning; development; and result. Items were scored on a Likert scale from 1 to 5. These three factors had an average value of 3.95, 3.77, and 3.74, respectively. This study [10] aims to examine the elements affecting student views of instructional effectiveness. The data came from a Course Evaluation Survey (CES) where around 3798 students responded where 2159 were female and 1639 were male. The survey was comprised of 26 specific questions regrouped under five factors, such as the instructor's personality characteristics, their behavior in marking and grading, their knowledge and teaching skills, the course attributes, and the course learning outcomes. Results showed a strong association between student evaluation of teaching effectiveness and each of the five criteria. The instructor's personality was the most important factor for both male and female students. Then came the course's characteristics, the instructor's knowledge and teaching skills, the course's learning outcomes, and finally, the instructor's methods for marking and grading. In the article [11], the impacts of perceived course efficiency on multiple SET measures were studied. The data came from 280 students enrolled in 14 sections of three online marketing courses, i.e., Marketing Research, Marketing of Financial Services, and Marketing Strategy. All the indicators of SET were assessed on a 5-point Likert scale. Regression analysis found that students who rated an online course as more effective than a face-to-face course had a weaker academic profile. The findings also revealed that students rated their instructors and courses, on average, 4.67 and 4.43, respectively. Most students who took online marketing courses considered them to be as effective as face-to-face courses. Overall, the Marketing Strategy course was rated higher than the other two courses. In the study [6], it examined students' perceptions of SET practice and their SET results. There were 974 students who participated in that study. Participants completed a SET and an adapted version of the Students' Perceptions of a Teaching Evaluation Process Questionnaire, which had 15 items scored. SET was viewed positively by nearly 90% of respondents, who believed it could improve teacher quality. Participants agreed that senior faculty shouldn't be judged as heavily as junior faculty. The authors also identified a strong association between SET scores and student perceptions of SET practice. Both SET scores and how important students thought SET practice was were related to their grades, seniority, and academic discipline. The study [12] sought to examine medical students' course evaluations in order to enhance the course evaluation system. 93 medical students responded to a questionnaire designed for computer-aided course evaluation. The questionnaire contained a total of 21 different assessment questions. The overall percentage of students who responded was 63.8% on average. Responses were more negative in 17 Likert-scaled categories, such as class size, suggested ways to study, lecture notes, teaching methods, and how important the final exam was.
2.2. Classification and analysis of opinions
2.3. Selection of classifier and opinion analysis technique
3. Methodology
4. Data Analysis and Findings
4.1. Data Collection and Preprocessing
Many teachers' evaluation forms include a part where students are free to express their opinions about the course and teacher. Various classification and analysis techniques are utilized to determine these opinions. The article [13] proposes two lexical-based techniques for automatically extracting opinions from brief reviews. There were 3,926 SET records that featured short review texts. They received 1,323 texts expressing negative emotions and 1,699 texts expressing positive emotions. Four machine learning approaches (Naive Bayes, Logistic Regression, Support Vector Machine, and Gradient Boost Decision Tree) were employed to calculate the emotional polarity of the texts. The proposed approaches were found to be 78.13% and 84.78% accurate at classifying the sentiment of student reviews for positive and negative emotions, respectively. In the study [14], an opinion mining method was presented to improve course evaluations. Data was gathered through the use of 4,957 discussion postings from three different discussion boards. For the purpose of opinion classification, three different machine learning approaches (Naive Bayes, KNN, and Support Vector Machine) were utilized. According to the results, the Naive Bayes approach performed better than the other two methods. Extracting opinions revealed that the characteristics with the highest frequency were teachers, content, exams, marks, and books. The authors of this research [15] employed Valence Aware Dictionary and sEntiment Reasoner (VADER) to examine Student Evaluations of Teaching (SET) from three sources, i.e., official evaluations, forum comments from another course, and an unofficial “ reviews ” site maintained by the students. Results showed that all three sources scored nearly the same on compound ratings, although unofficial student site ratings were somewhat more negative and included fewer favorable responses. The average rating for those who gave 5 stars was nearly completely positive, at 97.96%. Overall, questions about the strengths of the instructor or the course got the fewest negative and most positive scores, and questions about their weaknesses got the opposite. Furthermore, many scholars use Natural Language Processing (NLP) techniques to analyze opinions on various platforms. The authors of [16, 17, 18, 19, 20, 21, 22, 23] used sentimental analysis based on NLP on Twitter data to figure out whether a tweet is positive, negative, or neutral. Also, sentimental analysis was used in many different fields, such as Twitter tweets about COVID-19 vaccines [24], social media based on COVID-19 [25], US airline Twitter data [26], healthcare [27], movie reviews [28], product reviews [29, 30, 31], and so on.
A decision tree is likely the optimal starting point for classifying any dataset. It will provide an excellent overview and make the classification clear. Decision trees contain straightforward characteristics for defining the most important dimensions, managing missing values, and handling outliers. The majority of individuals are familiar with hierarchical trees; therefore, a basic graphic will facilitate the communication of the findings. Decision trees are straightforward to comprehend. People can obtain a general idea of the tree simply by glancing at it. Additionally, [7, 8] employed a decision tree to identify the most essential SET factors. Consequently, earlier scholars have solved a variety of classification issues with decision trees. Besides, scholars frequently use sentiment analysis while assessing opinions, as we have already mentioned above. As a result, the decision tree classifier and sentimental analysis will be used to carry out this study.
In the below fig. 1 shows the experimental flowchart of our SET data analysis. Data is collected from X University, which contains 27,622 SET records of 701 sections for 35 different courses. Then we do preprocessing in order to apply the data mining algorithm. After that, opinions are analyzed. Lastly, all the findings are gathered for discussion.
The SET dataset has the numeric values for five different factors. Here, we are using Weka where k-means clustering will be used for grouping the data of class level and, lastly, a decision tree (J48) will be generated to identify the prominent factors that have significant impacts on SET. There are also qualitative opinions that are difficult to summarize in SET dataset. That's why Sentimental Analysis, a type of natural language processing, will be utilized to determine the polarity and subjectivity of the opinions. This will assist in identifying whether the opinion is positive, negative, or neutral. The Word Art online-based word cloud generator website is also going to be used here to find the most frequently used words in the opinions. However, the flowchart of the proposed work in given below.
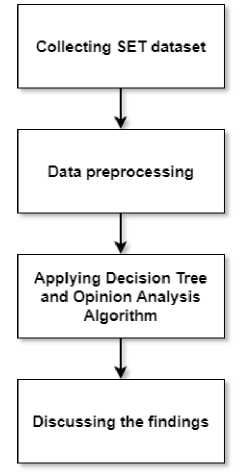
Fig. 1. Flowchart of the SET data analysis
Dataset is collected from X University's SET reports of computing students in three different online semesters. This data contains a total of 27,622 SET records of 701 sections for 35 different courses. Each section is filled with 36 to 42 students. Every student participated in these SET through the university portal at the end of the semester. Table 1 demonstrates the sample size of the students and sections for 35 different courses offered in the back-to-back three online semesters.
Table 1. Total SET dataset
|
Semester |
Students |
Sections |
Total Courses |
|
Spring 2020-21 |
8595 |
209 |
35 |
|
Summer 2020-21 |
9373 |
232 |
|
|
Fall 2021-22 |
9654 |
260 |
|
|
Total |
27622 |
701 |
Each set of SET consists of a total of twenty questions. These twenty questions are designed to measure five factors of teaching quality, where each factor contains four questions. The Likert scale is used to provide a score for each question ranges from one to five. The factor names are shown in below table 2.
Table 2. Factors of SET
|
Factor SL. |
Factor Name |
|
Factor 1 |
Knowledge of the Subject Matter |
|
Factor 2 |
Instructional Strategies and Motivation Techniques |
|
Factor 3 |
Personality Traits |
|
Factor 4 |
Student-Faculty Relation |
|
Factor 5 |
Routine Matters |
A factor-wise rating is calculated from the average point of its four questions. An overall rating is calculated from the average of these five factors. There is also a section at the end of SET for giving opinions about the course and teacher. The SET questioner is provided in the Appendix A section. The names of the courses and their tag numbers are given in below table 3.
Table 3. List of courses and their tag numbers
|
Course Tag |
Course Name |
|
C1 |
Introduction to Computer Studies |
|
C2 |
Introduction to Programming |
|
C3 |
Introduction to Programming Lab |
|
C4 |
Discrete Mathematics |
|
C5 |
Object Oriented Programming 1 |
|
C6 |
Introduction to Database |
|
C7 |
Data Structure |
|
C8 |
Algorithms |
|
C9 |
Object Oriented Programming 2 |
|
C10 |
Object Oriented Analysis and Design |
|
C11 |
Theory of Computation |
|
C12 |
Data Communication |
|
C13 |
Software Engineering |
|
C14 |
Artificial Intelligence and Expert System |
|
C15 |
Computer Networks |
|
C16 |
Computer Organization and Architecture |
|
C17 |
Operating System |
|
C18 |
Web Technologies |
|
C19 |
Compiler Design |
|
C20 |
Computer Graphics |
|
C21 |
Research Methodology |
|
C22 |
Advance Database Management System |
|
C23 |
Data Warehousing and Data Mining |
|
C24 |
Human Computer Interaction |
|
C25 |
Software Development Project Management |
|
C26 |
Software Requirement Engineering |
|
C27 |
Software Quality and Testing |
|
C28 |
Programming in Python |
|
C29 |
Advanced Programming with .Net |
|
C30 |
Advanced Programming in Web Technology |
|
C31 |
CS Math |
|
C32 |
Basic Graph Theory |
|
C33 |
Advanced Operating System |
|
C34 |
Computer Vision and Pattern Recognition |
|
C35 |
Network Security |
As mentioned earlier, the dataset contains a total of 701 sections for 35 different courses. Based on their overall SET score, these courses are categorized into three groups by using k-means clustering algorithm and Weka tool. We named these three groups as very effective course, effective course, and course needs to improve, as shown in the table 4 below.
Table 4. Class level of courses by using k-means clustering algorithm
|
Class Level |
SET Overall Rating |
Course Count |
|
Very effective course |
4.58 to 5 |
1 |
|
Effective course |
4.17 to 4.57 |
18 |
|
Course needs to improve |
Less than 4.17 |
16 |
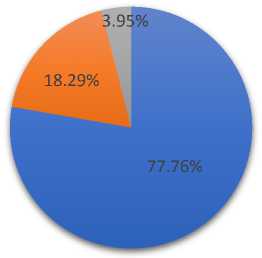
Based on the overall rating of SET, three categories of courses are found, where one course is very effective, eighteen courses are effective, and sixteen courses are identified for improvement. Class level-wise course tags are provided below in below table 5, and fig. 2 shows the percentage distribution of courses’ classification.
Table 5. Group of courses based on overall rating of SET
|
Class Level |
Course Tag |
|
Very effective course (4.58 <= Overall Rating <= 5) |
C24 |
|
Effective Course (4.17 <= Overall Rating <= 4.57 |
C1, C2, C3, C4, C5, C6, C9, C16, C21, C22, C23, C25, C27, C29, C30, C32, C34, C35 |
|
Course needs to improve (Overall Rating < 4.17) |
C7, C8, C10, C11, C12, C13, C14, C15, C17, C18, C19, C20, C26, C28, C31, C33 |
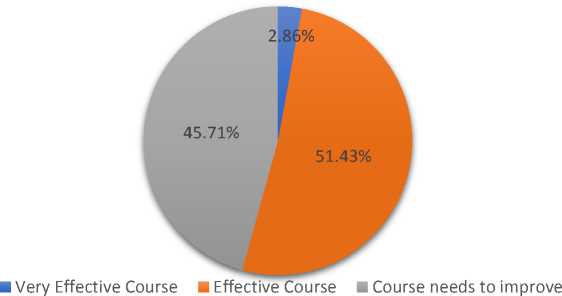
Fig. 2. Percentage distribution of courses’ classification
-
4.2. Implementation Decision Tree Classifier
For identifying the most influential factor among those five factors of SET, course names and tags are ignored. Therefore, it will now be an overall semester's SET records. Weka, a collection tool of machine learning algorithms for data mining tasks [32], is used to apply the J48 decision tree algorithm in 10-fold cross-validation settings.
The outcome of the J48 decision tree algorithm is shown below in fig. 3, and the rules are also shown in table 6. Generally, the class levels are stated in the leaf node of the decision tree. We can see from the decision tree in fig. 3 that factor 4 has the most influence because it is the tree's root node. That means, if you want to reach any class level, first you must meet the condition of the rating for factor 4.
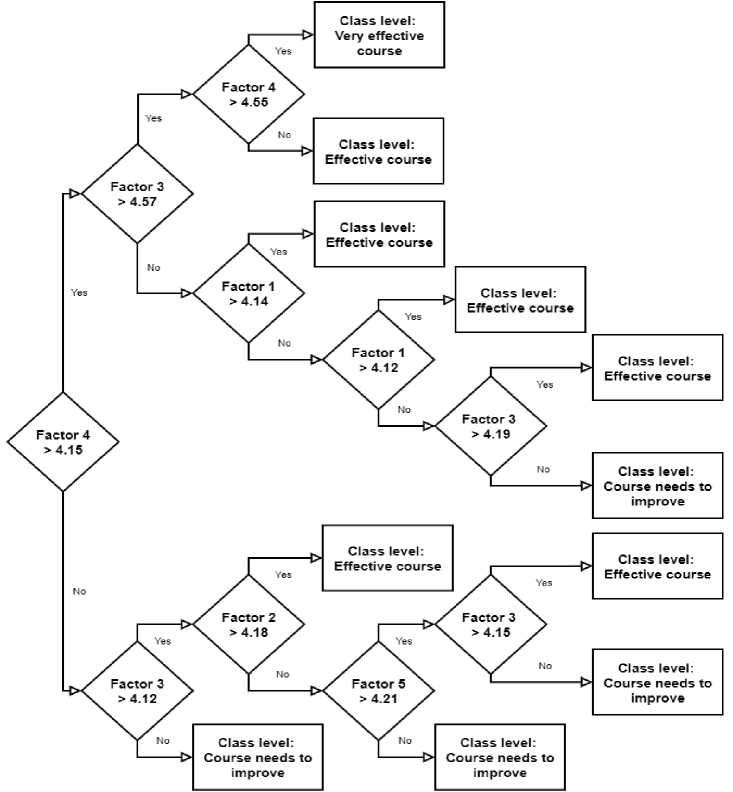
Fig. 3. Decision tree of the SET dataset generated by Weka
Table 6. Derived rules of the decision tree
|
Rules |
Description of the rules |
|
R1 |
If [Factor 4 > 4.15 && Factor 3 > 4.57 && Factor 4 > 4.55] then Class level = ‘Very effective course’ |
|
R2 |
If [Factor 4 > 4.15 && Factor 3 > 4.57 && Factor 4 <= 4.55] then Class level = ‘Effective course’ |
|
R3 |
If [Factor 4 > 4.15 && Factor 3 <= 4.57 && Factor 1 > 4.14] then Class level = ‘Effective course’ |
|
R4 |
If [Factor 4 > 4.15 && Factor 3 <= 4.57 && Factor 1 <= 4.14 && Factor 1 > 4.12] then Class level = ‘Effective course’ |
|
R5 |
If [Factor 4 > 4.15 && Factor 3 <= 4.57 && Factor 1 <= 4.14 && Factor 1 <= 4.12 && Factor 3 > 4.19] then Class level = ‘Effective course’ |
|
R6 |
If [Factor 4 > 4.15 && Factor 3 <= 4.57 && Factor 1 <= 4.14 && Factor 1 <= 4.12 && Factor 3 <= 4.19] then Class level = ‘Course needs to improve |
|
R7 |
If [Factor 4 <= 4.15 && Factor 3 > 4.12 && Factor 2 > 4.18] then Course level = ‘Effective course’ |
|
R8 |
If [Factor 4 <= 4.15 && Factor 3 > 4.12 && Factor 2 <= 4.18 && Factor 5 > 4.21 && Factor 3 > 4.15] then Class level = ‘Effective course’ |
|
R9 |
If [Factor 4 <= 4.15 && Factor 3 > 4.12 && Factor 2 <= 4.18 && Factor 5 > 4.21 && Factor 3 <= 4.15] then Class level = ‘Course needs to improve’ |
|
R10 |
If [Factor 4 <= 4.15 && Factor 3 > 4.12 && Factor 2 <= 4.18 && Factor 5 <= 4.21] then Class level = ‘Course needs to improve’ |
|
R11 |
If [Factor 4 <= 4.15 && Factor 3 <= 4.12] then Class level = ‘Course needs to improve’ |
The performance of the decision tree algorithm is shown in table 7 below. In Weka, the accuracy of the model is determined by the percentage of instances that were properly classified. The Kappa statistic is also given here, which is a measurement that compares an observed accuracy to an expected accuracy. Therefore, the values of True Positive (TP) Rate, False Positive (FP) Rate, Precision, Recall, and F-Measure for all possible class levels are given here. False Negative (FN) Rate and True Negative (TN) Rate are not included as these two are residual values of 1 for TP Rate and FP Rate, respectively. Here, the decision tree has a very high degree of accuracy, which is around 96%.
Table 7. Performance indicators of the decision tree
|
Possible levels of class attribute |
|||
|
Very effective course |
Effective course |
Course needs to improve |
|
|
TP Rate |
0.864 |
0.965 |
0.967 |
|
FP Rate |
0.005 |
0.050 |
0.023 |
|
Precision |
0.944 |
0.948 |
0.970 |
|
Recall |
0.864 |
0.965 |
0.967 |
|
F-Measure |
0.903 |
0.956 |
0.969 |
|
Total number of instances |
701 |
||
|
Correctly classified instances |
671 |
||
|
Incorrectly classified instances |
30 |
||
|
Accuracy |
95.7204% |
||
|
Kappa statistic |
0.9248 |
||
-
4.3. Implementation of Opinion Analysis
Opinions are classified using sentimental analysis. This will aid in determining whether the opinion is favorable, unfavorable, or neutral. With the help of four built-in libraries (pandas, regular expression, matplotlib, and TextBlob) in Python, the opinions are classified. Basically, opinions are grouped based on their polarity score. If the polarity score of an opinion is zero, it is treated as a neutral opinion. Positive and negative opinions are found if the score of the polarity is greater than zero and less than zero, respectively.
The result of the sentimental analysis for each course is shown in below table 8, where course tag 32 has the most positive opinions and no negative opinions, course tag 26 has the least positive opinions, and course tag 17 got the most negative opinions.
Table 8. Course-wise opinion analysis
|
Course Tag |
Opinion Analysis |
||
|
Positive |
Neutral |
Negative |
|
|
C1 |
81.03% |
14.51% |
4.46% |
|
C2 |
81.71% |
13.86% |
4.43% |
|
C3 |
79.64% |
16.29% |
4.07% |
|
C4 |
81.39% |
14.73% |
3.88% |
|
C5 |
83.10% |
15.13% |
1.77% |
|
C6 |
79.58% |
18.46% |
1.96% |
|
C7 |
78.46% |
18.23% |
3.31% |
|
C8 |
77.03% |
17.91% |
5.06% |
|
C9 |
80.47% |
16.83% |
2.70% |
|
C10 |
75.79% |
18.86% |
5.35% |
|
C11 |
77.26% |
19.09% |
3.65% |
|
C12 |
75.50% |
20.50% |
4.00% |
|
C13 |
78.68% |
18.28% |
3.04% |
|
C14 |
75.07% |
19.66% |
5.27% |
|
C15 |
75.56% |
19.82% |
4.62% |
|
C16 |
82.53% |
15.96% |
1.51% |
|
C17 |
73.47% |
18.57% |
7.96% |
|
C18 |
76.59% |
18.97% |
4.44% |
|
C19 |
77.24% |
19.04% |
3.72% |
|
C20 |
76.10% |
19.32% |
4.58% |
|
C21 |
76.72% |
19.58% |
3.70% |
|
C22 |
73.84% |
24.42% |
1.74% |
|
C23 |
75.27% |
21.86% |
2.87% |
|
C24 |
79.75% |
18.77% |
1.48% |
|
C25 |
76.74% |
20.83% |
2.43% |
|
C26 |
69.35% |
23.64% |
7.01% |
|
C27 |
76.73% |
19.31% |
3.96% |
|
C28 |
73.24% |
20.42% |
6.34% |
|
C29 |
78.71% |
20.64% |
0.65% |
|
C30 |
80.00% |
16.80% |
3.20% |
|
C31 |
74.04% |
19.23% |
6.73% |
|
C32 |
87.83% |
12.17% |
0.00% |
|
C33 |
73.21% |
22.33% |
4.46% |
|
C34 |
77.78% |
17.59% |
4.63% |
|
C35 |
77.33% |
19.43% |
3.24% |
Fig. 4 shows the “Subjectivity” and “polarity” indicators, where subjectivity indicates how subjective or opinionated the text is, and polarity indicates how positive or negative the text is. Here, a polarity score greater than zero has the highest density, which indicates that a huge number of opinions are positive.
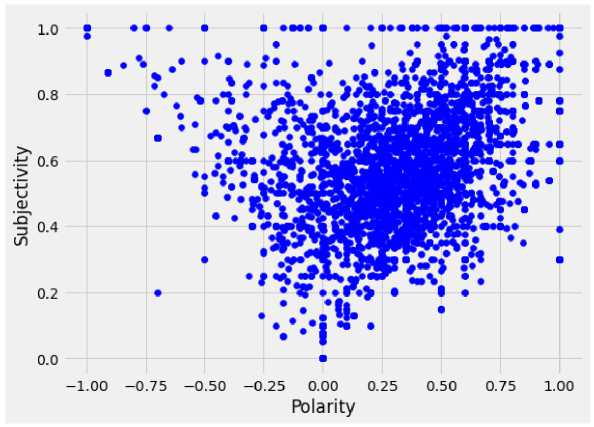
Fig. 4. Subjectivity vs Polarity of the opinions
Fig. 5 shows the percentage distribution of positive, negative, and neutral opinions of sentimental analysis, where al-most 78% opinions are positive which indicates a very positive academic environment.
■ Positive Opinions - Neutral Opinions ■ Negative Opinions
Fig. 5. Percentage distribution of sentimental analysis of the SET dataset
Moreover, an online-based word cloud generator tool is used here to determine the most frequently used words in the opinions. Basically, a word cloud is a visual representation of a group of words in varying sizes. The bigger and bolder the word appears, the more often it’s mentioned within a given text, and the more important it is, shown in fig. 6, where positive words reflect the positive opinion percentage.
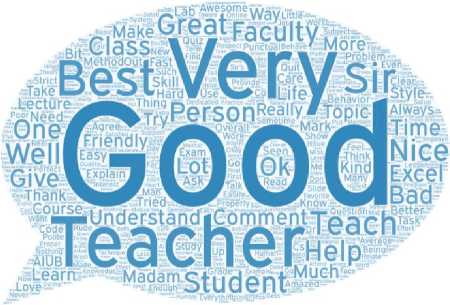
Fig. 6. Word cloud for the dataset
5. Conclusion and Discussion
Because of the pandemic that has spread over the world, educational institutions were required to move all of their activities online. The viability of taking lessons online is currently being called into question. Aside from that, education must be maintained at its highest level by analyzing student evaluations of teaching and implementing the necessary measures for improvement. Student evaluations of teaching (SET) are an important way to find out how good a teacher is at teaching, and they have become an important part of managing higher education. According to the findings, a variety of elements influence the quality of teaching which are shown in below table 9.
Table 9. Summary of the findings
|
Terms |
Findings |
|
Most important factor based on DT classifier |
Student-Faculty Relation |
|
Most important factor based on average |
Routine Matters |
|
Most frequent word that appears in the opinions |
Good |
|
Very effective course based on overall rating |
Human Computer Interaction |
|
Course with most positive comments based on opinion analysis |
Basic Graph Theory |
|
Course with less negative comments based on opinion analysis |
|
|
Course with most negative comments based on opinion analysis |
Operating System |
|
Course with less positive comments based on opinion analysis |
Software Requirement Engineering |
Student-Faculty Relation is the most important factor for determining the teaching quality because it is the root node of the tree. That means, the very effective course depends on the rating of factor 4. The accuracy for the decision tree is very good, which is above 95%. It indicates that this model nearly perfectly classifies its instances. Additionally, the kappa statistic value is greater than 0.90. When comparing observed accuracy to expected accuracy, a kappa value of more than 0.75 is usually a sign of excellent agreement. So, kappa statistics also indicate that this model is perfectly classified.
As the classes were online, teachers were easily able to take the classes virtually. They could simply check the attendance of students by clicking some buttons on their computers. However, taking the class on time and uploading study materials smoothly within a short time frame are the major advantages of taking online classes. These things are easily followed by the teacher without any hassle in virtual classes. Factor-5, known as “ Routine Matters ”, has all these rating type questions, which are shown in the Appendix A section. That is the main reason for getting the highest average rating in factor 5 by the students. But a teacher could never keep an eye on all the students in an online class. So, some communication gaps might arise between the teachers and the students, which is the major drawback of virtual classes. Students might fail to obtain sufficient information about the contents of the course owing to a lack of interaction with the teacher sometimes. That might be the reason for having bad grades in the course. As a result, students could give their SET for courses and teachers very poor ratings. The findings of the Decision Tree also reveal that “ Student-Faculty Relation ”, i.e., factor-4 is the most vital factor determining the quality of teaching and very effective courses. Therefore, maintain good student-faculty relation is the key factor in online class environment, and “ Routine Matters ”, i.e., factor-5 is also important. Teachers must maintain these factors while taking online classes in the future. In addition, the average overall ratings and sentiment analysis of the courses show that “Human Computer Interaction” is the very effective course, followed by the “Basic Graph Theory” course. Besides, “Good” is identified as the most frequent word in the opinions section on SET. The results will have a big effect on how well teachers will prepare for the future if they have to move their regular classes online. Also, teachers will be able to make better decisions regarding the quality of their teaching.
Nevertheless, this study has several drawbacks. Unfortunately, the dataset doesn’t include the gender of the students or the teachers. That is why gender bias on SET was not conducted. For a particular student, the correlation between the rating of SET and giving the levels of opinion was not demonstrated as the dataset only contains sectionwise SET ratings and opinions. However, some opinions on SET were mixed with the native and the English language with many grammatical mistakes. We had to deal with those problems manually while analyzing the opinions. SET also contained only emoji-type opinions, which were marked as neutral by sentimental analysis. These challenges can be resolved in future iterations. In the future, we will conduct a comprehensive analysis of student evaluations of teaching across four academic years' course curriculum.
Appendix A. Questions for Student Evaluations of Teaching (SET)
|
Factor |
Questions |
|
1. Knowledge of the Subject Matter |
syllabus.
instructional tools such as: multi-media, white board, OHP etc.
ideas clearly with confidence. |
|
2. Instructional Strategies and Motivation Techniques |
performance.
decorum and orderliness in the classroom.
discussions.
acknowledges students good responses and participation. |
|
3. Personality Traits |
inside and outside of the classroom.
|
|
4. Student-Faculty Relation |
|
|
5. Routine Matters |
|
|
Comment: |
|
References Analyzing Student Evaluations of Teaching in a Completely Online Environment
- Ahmed, N., Rifat-Ibn-Alam, M., Akib, G.A., Shefat, S.N. and Nandi, D., 2022. An Extensive Analysis on Computing Students' Academic Performance in Online Environment using Decision Tree. Turkish Journal of Computer and Mathematics Education (TURCOMAT), 13(1), pp.149-163.
- Shefat, S.N., Akib, M.G.A., Ahmed, N. and Nandi, D., 2022. Investigation of Computing Students’ Performances in a Fully Online Environment During COVID-19 Pandemic. Malaysian Journal of Science and Advanced Technology, pp.23-30.
- Akib, M.G.A., Ahmed, N., Shefat, S.N. and Nandi, D., 2022. A Comparative Analysis among Online and On-Campus Students Using Decision Tree.
- Ali, M.T., Rahman, M.A. and Lamagna, C.Z., 2021. Comparative analysis of program outcomes achievement between face-to-face and virtual classes during COVID-19 pandemic. AIUB Journal of Science and Engineering (AJSE), 20(1), pp.1-7.
- Nandi, D., Hamilton, M., Harland, J. and Mahmood, S., 2015. Investigation of participation and quality of online interaction. International Journal of Modern Education and Computer Science, 7(8), p.25.
- Spooren, P. and Christiaens, W., 2017. I liked your course because I believe in (the power of) student evaluations of teaching (SET). Students’ perceptions of a teaching evaluation process and their relationships with SET scores. Studies in educational evaluation, 54, pp.43-49.
- Park, E. and Dooris, J., 2020. Predicting student evaluations of teaching using decision tree analysis. Assessment & Evaluation in Higher Education, 45(5), pp.776-793.
- Li, A., Liu, K. and Ge, Z., 2015. Application of Data Mining in the Colleges' in-Class Teaching Quality Evaluation System. J. Comput., 10(3), pp.166-175.
- Moreno-Murcia, J., Torregrosa, Y.S. and Pedreo, N.B., 2015. Questionnaire evaluating teaching competencies in the university environment. Evaluation of teaching competencies in the university. Journal of New Approaches in Educational Research (NAER Journal), 4(1), pp.54-61.
- Mohammed, T.A. and Pandhiani, S.M., 2017. Analysis of factors affecting student evaluation of teaching effectiveness in Saudi higher education: the case of Jubail University college. American Journal of Educational Research, 5(5), pp.464-475.
- Estelami, H., 2016. An Exploratory Study of the Effects of Online Course Efficiency Perceptions on Student Evaluation of Teaching (SET) Measures. American Journal of Business Education, 9(2), pp.67-82.
- Lim, S.D., Lee, J., ParK, H.S., Yu, J.R., Lee, K.Y., Sohn, I.S. and Lee, R., 2008. Experience and consideration on online course evaluation by medical students. Korean Journal of Medical Education, 20(4), pp.367-371.
- Lin, Q., Zhu, Y., Zhang, S., Shi, P., Guo, Q. and Niu, Z., 2019. Lexical based automated teaching evaluation via students’ short reviews. Computer Applications in Engineering Education, 27(1), pp.194-205.
- El-Halees, A., 2011, June. Mining opinions in user-generated contents to improve course evaluation. In International conference on software engineering and computer systems (pp. 107-115). Springer, Berlin, Heidelberg.
- Newman, H. and Joyner, D., 2018, June. Sentiment analysis of student evaluations of teaching. In International conference on artificial intelligence in education (pp. 246-250). Springer, Cham.
- Hasan, M.R., Maliha, M. and Arifuzzaman, M., 2019, July. Sentiment analysis with NLP on Twitter data. In 2019 International Conference on Computer, Communication, Chemical, Materials and Electronic Engineering (IC4ME2) (pp. 1-4). IEEE.
- Kanakaraj, M. and Guddeti, R.M.R., 2015, March. NLP based sentiment analysis on Twitter data using ensemble classifiers. In 2015 3Rd international conference on signal processing, communication and networking (ICSCN) (pp. 1-5). IEEE.
- Chong, W.Y., Selvaretnam, B. and Soon, L.K., 2014, December. Natural language processing for sentiment analysis: an exploratory analysis on tweets. In 2014 4th international conference on artificial intelligence with applications in engineering and technology (pp. 212-217). IEEE.
- Shelar, A. and Huang, C.Y., 2018, December. Sentiment analysis of twitter data. In 2018 International Conference on Computational Science and Computational Intelligence (CSCI) (pp. 1301-1302). IEEE.
- Agarwal, A., Xie, B., Vovsha, I., Rambow, O. and Passonneau, R.J., 2011, June. Sentiment analysis of twitter data. In Proceedings of the workshop on language in social media (LSM 2011) (pp. 30-38).
- Sahayak, V., Shete, V. and Pathan, A., 2015. Sentiment analysis on twitter data. International Journal of Innovative Research in Advanced Engineering (IJIRAE), 2(1), pp.178-183.
- El Rahman, S.A., AlOtaibi, F.A. and AlShehri, W.A., 2019, April. Sentiment analysis of twitter data. In 2019 international conference on computer and information sciences (ICCIS) (pp. 1-4). IEEE.
- Spencer, J. and Uchyigit, G., 2012, September. Sentimentor: Sentiment analysis of twitter data. In SDAD@ ECML/PKDD (pp. 56-66).
- Shamrat, F.M.J.M., Chakraborty, S., Imran, M.M., Muna, J.N., Billah, M.M., Das, P. and Rahman, O.M., 2021. Sentiment analysis on twitter tweets about COVID-19 vaccines using NLP and supervised KNN classification algorithm. Indonesian Journal of Electrical Engineering and Computer Science, 23(1), pp.463-470.
- Nemes, L. and Kiss, A., 2021. Social media sentiment analysis based on COVID-19. Journal of Information and Telecommunication, 5(1), pp.1-15.
- Tusar, M.T.H.K. and Islam, M.T., 2021, September. A comparative study of sentiment analysis using NLP and different machine learning techniques on US airline Twitter data. In 2021 International Conference on Electronics, Communications and Information Technology (ICECIT) (pp. 1-4). IEEE.
- Abualigah, L., Alfar, H.E., Shehab, M. and Hussein, A.M.A., 2020. Sentiment analysis in healthcare: a brief review. Recent Advances in NLP: The Case of Arabic Language, pp.129-141.
- Mitra, A., 2020. Sentiment analysis using machine learning approaches (Lexicon based on movie review dataset). Journal of Ubiquitous Computing and Communication Technologies (UCCT), 2(03), pp.145-152.
- Shivaprasad, T.K. and Shetty, J., 2017, March. Sentiment analysis of product reviews: a review. In 2017 International conference on inventive communication and computational technologies (ICICCT) (pp. 298-301). IEEE.
- Shafin, M.A., Hasan, M.M., Alam, M.R., Mithu, M.A., Nur, A.U. and Faruk, M.O., 2020, December. Product review sentiment analysis by using NLP and machine learning in Bangla language. In 2020 23rd International Conference on Computer and Information Technology (ICCIT) (pp. 1-5). IEEE.
- Chitra, P., Karthik, T.S., Nithya, S., Poornima, J.J., Rao, J.S., Upadhyaya, M., Kumar, K.J., Geethamani, R. and Manjunath, T.C., 2021. Sentiment analysis of product feedback using natural language processing. Materials Today: Proceedings.
- Eibe Frank, Mark A. Hall, and Ian H. Witten (2016). The WEKA Workbench. Online Appendix for "Data Mining: Practical Machine Learning Tools and Techniques", Morgan Kaufmann, Fourth Edition, 2016.
