Analyzing Students’ Performance Using Fuzzy Logic and Hierarchical Linear Regression

Author: Dao Thi Thanh Loan, Nguyen Duy Tho, Nguyen Huu Nghia, Vu Dinh Chien, Tran Anh Tuan
Journal: International Journal of Modern Education and Computer Science @ijmecs
Article in issue: 1 vol.16, 2024.
Free access
Due to the COVID-19 situation, all activities, including education, were shifted to online platforms. Consequently, instructors encountered increased challenges in evaluating students. In traditional assessment methods, instructors often face ambiguous cases when evaluating students’ competencies. Recent research has focused on the effectiveness of fuzzy logic in assessing students’ competencies, considering the presence of uncertain factors or multiple variables. Additionally, demographic characteristics, which can potentially influence students’ performance, are not typically utilized as inputs in the fuzzy logic method. Therefore, analyzing students’ performance by incorporating these factors is crucial in suggesting adjustments to teaching and learning strategies. In this study, we employ a combination of fuzzy logic and hierarchical linear regression to analyze students’ performance. The experiment involved 318 students from various programs and showed that the hybrid approach assessed students’ performance with greater nuance and adaptability when compared to a traditional method. Moreover, the findings in this study revealed the following: 1) There are differences in students’ performance between traditional and fuzzy evaluation methods; 2) The learning method is an impact on students’ fuzzy grades; 3) Students studying online do not perform better than those studying onsite. These findings suggest that instructors and educators should explore effective strategies being fair and suitable in assessment and learning.
Students' performance, fuzzy grades, fuzzy logic, linear regression, hierarchical linear regression, hybrid approach
Short address: https://sciup.org/15019148
IDR: 15019148 | DOI: 10.5815/ijmecs.2024.01.01
Text of the scientific article Analyzing Students’ Performance Using Fuzzy Logic and Hierarchical Linear Regression
Lofti A. Zadeh introduced fuzzy logic based on the fuzzy set theory having exact and rigorous mathematical principles [1]. Because of its application in various domains and its capacity for uncertainty models, fuzzy logic may be utilized to build mathematical solutions for real-life issues expressed with natural language and indicated by degrees of ambiguity and uncertainty, such as evaluation in education [2–14]. Evaluation (e.g., a student’s performance, education quality) plays a vital role in daily life. Especially in education, the evaluation helps not only instructors but also learners and their parents get helpful feedback related to learners' performance in order to inspire instructors and encourage learners [7]. Evaluation of student performance includes assessing abilities, competencies, and skills. However, the terms “ability”, “competency” and “skill” are all ambiguous and can express in terms of fuzzy [15]. Hence, numerical values from statistical methods called grades usually use to give to students to represent students’ achievements. Grades for students contain information about their non-cognitive and meta-cognitive, as well as their attendance, frequencies of homework completion, and instructors’ prejudgments [16]. In addition, instructors frequently experience ambiguous situations with students’ evaluation. For example, giving a student with 79 points for a grade of “very good” and a student with 80 points for an “excellent” grade is complex and unfair. Therefore, using fuzzy logic to assess student performance provides high flexibility and reliability [17]. Recently, studies assessing students’ performance with fuzzy logic had better performance [4–7, 15–19].
When the COVID-19 pandemic hit, human activities were limited to prevent the spreading of the virus. Education was no exception, leading to the shift of teaching and learning processes to online platforms. Consequently, research inquiries have emerged regarding the factors that affect students’ learning performance. Instructors faced significant challenges in evaluating students fairly within different learning environments. Besides uncertain factors, other characteristics, such as demographics, might also affect students’ performance. However, these demographic characteristics might not be used as inputs of the fuzzy logic method. Analyzing students’ performance while considering these factors is crucial for proposing strategies to adapt teaching and learning. One method for analyzing the factors affecting students’ performance is hierarchical linear regression, which has been introduced in recent studies [20–24].
In this study, we combine a fuzzy logic method and hierarchical linear regression to analyze students’ performance. The fuzzy logic method is employed to categorize students into eight levels based on variables (attendance class scores, worksheet scores, workgroup scores, and final examination scores). Through a fuzzy process, these variables are combined to generate a fuzzy grade. Then, we explore other factors such as learning method, gender, and cluster that may potentially affect students’ performance or not, utilizing hierarchical linear regression analysis. By combining fuzzy logic and hierarchical linear regression, this integrated approach provides a more comprehensive and flexible framework for assessing students’ performance, capturing both the multiple input variables and the hierarchical nature of the data. It allows for a more nuanced understanding of the factors that influence students’ performance and can provide valuable insights for educational practitioners and policymakers.
The research questions (RQ) of the study are the following:
RQ1: Is there any difference between traditional and fuzzy grades?
RQ2: Do any characteristics affect students’ fuzzy grades?
RQ3: Do students studying online achieve higher fuzzy grades compared to onsite students?
The rest of the paper is organized as the following: The related works are presented in section 2. The methodology and details are discussed in section 3. The results and discussion are explained in section 4. The conclusion is given in section 5. Finally, the limitation and future research are mentioned in section 6.
2. Literature Review
This section discusses previous studies that have explored students’ learning performance using fuzzy logic and studies that have investigated the application of hierarchical linear regression (or hierarchical linear modeling) to analyze the factors influencing various outcomes in the education domain.
In Yadav et al.’s study [4], the authors used two students’ scores (semester 1st and semester 2nd) to evaluate how well the students achieved knowledge by a proposed model based on fuzzy logic. Twenty students joined the experiment, and the results (tradition-based and fuzzy-based evaluation) were different. Namli and Senkal [5] used a fuzzy-based system to evaluate students’ programming performance with two inputs (mark and attendance). The results from 336 students were more efficient than the others by increasing the number of input parameters in the rules. Chrysafiadi et al. [6] integrated fuzzy logic with cognitive theories to adapt e-assessment for students. Results conducted with 80 students showed that the accuracy of selecting constituents in tests personalized for each student was great. Wen and Liu [7] used a proposed mechanism based on fuzzy to distinguish between students having identical scores. With the new scores, the students’ rankings were reordered. The mechanism was exemplified in ten students with their exam scores. Bakar et al. [8] used fuzzy set theory to evaluate students’ performance in an online course.
Results from 30 students depicted that students’ final scores were influenced by fuzzy logic and students’ performance was high. Stándo et al. [9] used fuzzy logic to evaluate students’ achievements based on bloom's taxonomy in medical education. Petra et al. [10] introduced a proposed method using fuzzy to evaluate 20 students. The evaluation was used to analyze how weak the students were in academic performance or individual advancement. The results of the experiments showed that fuzzy logic was more flexible in evaluation. Ajoi et al. [11] presented a proposed tool using fuzzy to reward outstanding students who were excellent in academics and had extraordinary leadership skills. The experiments from twenty students showed that the proposed tool enabled evaluators to enhance the process of selecting the best student. Doz et al. [12] introduced a fuzzy approach using two types of maths grades (teacher-based and national-based) as the input variables. The experimental results indicated that the proposed model affected the traditionbased grade. In research by Özseven and Cagman [13], the fuzzy logic-based model was built to assess students studying distance learning. The model involved various criteria (exams, projects, research, homework, etc.). Three students with their exam scores exemplified the model. Yoliadia [18] deployed fuzzy logic to analyze and retrieve data about student performance levels. The model had three criteria (ethics of use, knowledge, and information aspects) built with three membership functions for each. Twenty students were involved in the experiments, providing accurate and reliable data for teachers to analyze student performance. Thinakaran et al. [19] suggested a model to assess student motivation levels during their learning process. The approach had four input variables with three membership functions to provide recommendations automatically.
Özberk et al. [20] used hierarchical linear modeling to examine the factors influencing Turkish students’ mathematics performance at the individual and school levels. Chien and Wu [21] employed hierarchical linear modeling to analyze data and explore the factors influencing students’ performance on technology-based assessments in science classrooms. The results indicated that two key factors, namely learning activities and computer experiences, affected on students’ performance in these assessments. In Hsu and Chen’s study [22], the authors employed hierarchical linear modeling to examine the influence of the contextual factor of diffusion of innovation on the technology, pedagogy, and content knowledge of English teachers. The results of their analysis revealed a significant impact of the diffusion of innovation on these knowledge domains. The study conducted by Wang et al. [23] revealed significant effects of social media usage on students’ collaborative problem-solving (CPS) achievement. The impact of social media usage varied across different learning contexts, types of social media, and purposes of social media use (leisure or academic). Moreover, the study found that students with a more positive attitude toward social media were more likely to achieve higher CPS performance. In Chen et al.’s study [24], the authors used a model of hierarchical linear regression to examine the learning experiences and outcomes of student club committee members. The study showed a significant correlation between learning from club activities and students’ learning outcomes.
The studies utilized fuzzy logic for evaluating students’ performance from mentioned studies. They concluded that the fuzzy logic method was appropriate and adaptable for assessing students’ performance by combining multiple variables such as attending and project scores. In these studies, the authors did not concern whether any factors (e.g., learning method) affected to the fuzzy logic-based students’ performance or not. Meanwhile, the studies employed hierarchical linear modeling to determine which factors influenced the expected outcomes. To fill this research gap, the current study aims to investigate an approach combines fuzzy logic and hierarchical linear regression to offer a flexible and comprehensive framework for assessing student performance.
3. Methodology
The flowchart outlining the methodology is shown in Fig. 1. The data utilized in this study comprises the course achievement of the general education course from the international programs of a university. These data are employed to assess students’ grades through the application of a fuzzy logic approach. Subsequently, the obtained results from the fuzzy logic approach are analyzed using hierarchical linear regression to explore factors such as learning method, gender, year, and a group that significantly impact students’ fuzzy grades. The primary objective of this study is to accomplish this analysis with combining fuzzy logic and hierarchical linear regression.
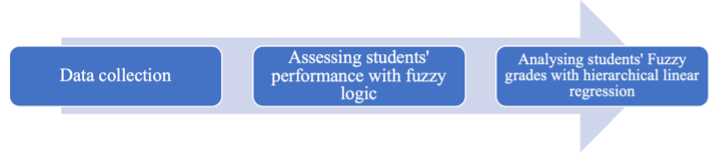
Fig. 1. The flowchart of the methodology
-
3.1 Data collection
-
3.2 Assessing students’ performance with fuzzy logic
In this study, the course assessment of the general education course from the international programs of a university in Thailand for first and second-year students is taken into consideration. The total number of participants is 318, aged between 19 to 20 years old. The data are collected in privacy and encrypted before handing out us. Table 1 depicts information on participants. Note learning method includes teaching, studying, examination.
Table 1. Participants Information
|
Characteristics |
No. of Students (n) |
Percentage |
|
Learning method |
||
|
Online (Onsite) |
168 (150) |
53.83% (46.17%) |
|
Gender |
||
|
Female (Male) |
242 (76) |
76.10% (23.90%) |
|
Cluster (Class) |
||
|
1 |
43 |
15.00% |
|
2 |
35 |
12.00% |
|
3 |
66 |
23.00% |
|
4 |
67 |
23.00% |
|
5 |
35 |
12.00% |
|
6 |
43 |
15.00% |
In this phase, a model is proposed to assess students’ fuzzy grades, as shown in Fig. 2. In the model, there are three significant procedures which are Fuzzification, Inference, and Defuzzification. The input of the method is four types of scores ( attendance class , worksheet : an average score of all practical labs, workgroup : a score based on a report of a students’ group (3 students per group), and final examination ). The output of the model is students’ fuzzy grades.
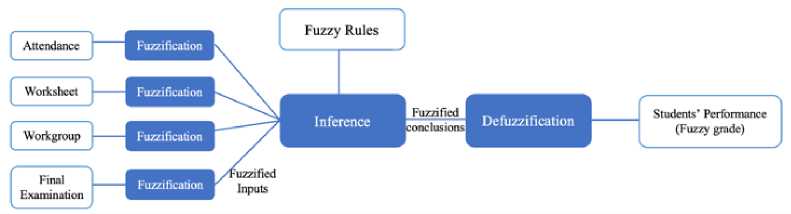
Fig. 2. The processing diagram for assessing students’ fuzzy grades
The following steps are depicted a process of the model for assessing students’ fuzzy grades:
-
1) Step 1. Fuzzify crisp numbers to fuzzy numbers
In this step, a crisp number is represented by a triangular fuzzy number and denoted as ( a, m, b ) in which a , m , and b are the left endpoint, the mode, and the right endpoint, respectively. To fuzzify all crisp numbers of the input of this study, triangular fuzzy numbers for the input are defined. A range and membership functions for linguistic variables (“low”, “medium”, and “high”) of the input variables ( attendance , worksheet , workgroup , and final examination ) are depicted as follows:
*Attendance: Range: [0, 5]; Low: ц(x ; 0, 0, 2); Medium: //( x ; 1, 2.5, 4); High: ц(x ; 3, 5, 5)
*Worksheet: Range: [0, 60]; Low: ц(x ; 0, 0, 24); Medium: //( x ; 12, 30, 48); High: //( x ; 36, 60, 60)
*Workgroup: Range: [0, 15]; Low: ц(x ; 0, 0, 6); Medium: ц(x ; 3, 7.5, 12); High: ц(x ; 9, 15, 15)
*Final examination: Range: [0, 20]; Low: ц(x ; 0, 0, 8); Medium: ц(x ; 4, 10, 16); High: |U( x ; 12, 20, 20)
-
2) Step 2. Determine fuzzy rules and inference
In this step, inference rules with patterns “If-Then” are generated from the sets of input and output fuzzy with their relationships. These inference rules are used to map the input (each input has three linguistic variables: “low”, “medium”, and “high”) onto the output (the output has eight linguistic variables: “fail”, “very poor”, “poor”, “fair”, “fairly good”, “good”, “very good”, and “excellent”). These rules are summarized in Table 2. The first column is Students’ fuzzy grades , including eight levels. The last four columns are attendance , worksheet , workgroup , and final examination , which depict the values of the four input variables. For examples of the fuzzy rules from Table 2, Rule 1: “If attendance , worksheet , workgroup , and final examination are low , then students’ performance is fail ”.
-
3) Step 3. Defuzzify for each student
-
3.3 Analysing students’ fuzzy grades with hierarchical linear regression
In this step, the results returned from the previous step (the inference process) are converted to crisp values. The converting process is called defuzzification. The output variable is “Students’ Performance (Fuzzy grade)” that has a range ([0, 100]) and eight membership functions (Fail: /r( x ; 0, 0, 50); Very poor: //( x ; 48, 52, 56); Poor: /r( x ; 53, 57, 61); Fair: /r( x ; 58, 62, 66); Fairly good: /r( x ; 63, 67, 71); Good: /r( x ; 68, 72, 76); Very good: /r( x ; 73, 77, 81); Excellent: /r( x ; 78, 100, 100). In this study, the center of area technique (centroid) is used to apply in the defuzzification [25].
Table 2. The Fuzzy Rules for the Inference System
|
Students’ Performance |
Attendance |
Worksheet |
Workgroup |
Final Examination |
|
Fail |
Low |
Low |
Low |
Low |
|
Very poor |
Low |
Low |
Medium |
High |
|
Poor |
High |
Low |
Medium |
High |
|
High |
Medium |
Low |
Low |
|
|
Low |
Medium |
Medium |
Low |
|
|
Medium |
Medium |
Medium |
Low |
|
|
Fair |
High |
Low |
High |
High |
|
High |
Medium |
Medium |
Low |
|
|
Low |
Medium |
High |
Low |
|
|
Medium |
Medium |
Medium |
Low |
|
|
Fairly good |
High |
Medium |
High |
Low |
|
Low |
Medium |
Low |
High |
|
|
Medium |
Medium |
High |
Low |
|
|
Medium |
Medium |
Low |
High |
|
|
Good |
Low |
Medium |
Medium |
High |
|
Medium |
Medium |
Medium |
Medium |
|
|
Medium |
Medium |
Medium |
High |
|
|
Very good |
Medium |
High |
Medium |
Medium |
|
Medium |
Medium |
High |
High |
|
|
Excellent |
Medium |
High |
Medium |
High |
|
Medium |
High |
High |
High |
|
|
High |
High |
High |
High |
The aim of this step is to explore factors that significantly influence students’ fuzzy grades which are the result of the previous phase. Hierarchical linear regression including other statistical analyses are performed using functions in R [26] and Jamovi [27]. The root mean square error (RMSE), R2, Adjusted R2 are used to concern which model is better. The following formula for hierarchical linear regression with two blocks can be expressed [28]
Y = 0 0 + 0 1 X 1 + 0 2 X 2 + 0 3 X 3 + 0 4 X 4 + P s Z 1 + 0 6 Z 2 + 0 7 Z 3 + E (1)
where Y represents the dependent variable (outcome); X 1 , X 2 , X 3 , X 4 are predictors in Block 1; Z 1 , Z 2 , Z 3 are predictors in Block 2; 0 0 is the intercept; 0 1 , 0 2 , 0 3 , 0 4 , 05, 0 6 , 0 7 are the coefficient; e represents the residual.
In this study, X1, X2, X3, X4 are four input variables ( attendance, worksheet, workgroup, final examination ); Z1, Z2, Z3 are characteristics ( learning method, gender, cluster ); Y is fuzzy grades.
4. Results and Discussion
The three primary procedures, namely fuzzification, inference, and defuzzification, are carried out utilizing the “Fuzzy Logic Designer” application in MATLAB online [29]. The fuzzy logic model is designed and depicted in Fig. 3. The fuzzy sets for input and output variables are defined within the fuzzy logic model. Membership functions for all variables are defined in Section 3, with three membership functions created for each input variable. The membership functions of the proposed model are illustrated in Fig. 4.
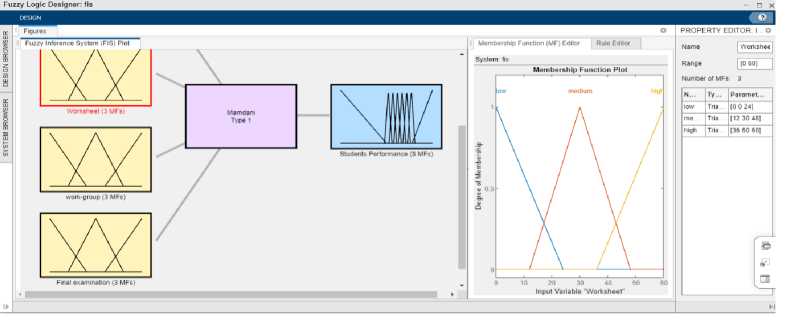
Fig. 3. The structure of the assessing students’ performance model in Fuzzy Logic Designer
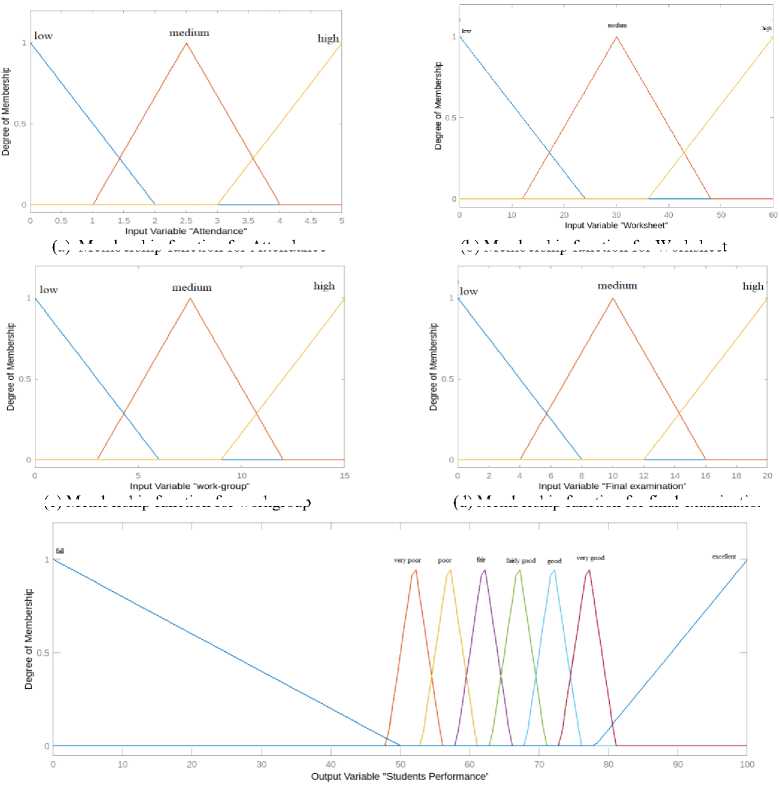
(a) Membership function for Attendance
(b) Membership function for Worksheet
(c) Membership function for workgroup
(d) Membership function for final examination
(e) Membership function for students’ performance
Fig. 4. The membership functions for the input and output variables
Table 3 depicts the descriptive statistics (e.g., means, SD) related to the input variables, traditional grade, and fuzzy grade for students (n = 318). In Table 3, the column “traditional grade” is the final grade of students, being a summation of the input variables ( attendance , worksheet , workgroup , and final examination ). The column “fuzzy grade” is achieved by the inference system based on fuzzy. In Table 4, the correlations among input variables (predictors) with traditional and fuzzy grades, displaying significance levels ( p <0.001). The column “worksheet” is the most impacting factor for the traditional and fuzzy grades, with correlation coefficients of R=0.920 ( p <0.001) and R=0.715 ( p <0.001), respectively. Moreover, the majority of the input variables (predictors) reveal correlations among them, each attaining significance levels of statistical importance.
Table 3. The Descriptive statistics for the input variables, traditional grades, and fuzzy grades
|
Attendance |
Worksheet |
Workgroup |
Final Examination |
Traditional Grade |
Fuzzy Grade |
|
|
Mean (SD) |
4.85 (0.27) |
55.60 (5.75) |
13.70 (1.25) |
17.40 (1.97) |
91.50 (7.15) |
89.50 (7.69) |
|
Minimum |
3.25 |
23.90 |
3.30 |
10.00 |
54.80 |
24.20 |
|
Maximum |
5.00 |
60.00 |
15.00 |
20.00 |
100.00 |
93.00 |
|
Skewness (SE) |
-2.45 (0.14) |
-2.23 (0.14) |
-2.41 (0.14) |
-1.37 (0.14) |
-1.93 (0.14) |
-4.51 (0.14) |
|
Kurtosis (SE) |
7.79 (0.27) |
5.79 (0.27) |
14.40 (0.27) |
2.03 (0.27) |
4.66 (0.27) |
26.70 (0.27) |
Table 4. The correlation coefficients of Pearson among the variables
|
(1) |
(2) |
(3) |
(4) |
(5) |
(6) |
(7) |
(8) |
(9) |
|
|
(1) Attendance |
- |
||||||||
|
(2) Worksheet |
0.430*** |
- |
|||||||
|
(3) Workgroup |
0.036 |
0.141* |
- |
||||||
|
(4) Final examination |
0.111* |
0.202*** |
0.109 |
- |
|||||
|
(5) Traditional Grade |
0.484*** |
0.920*** |
0.338*** |
0.493*** |
- |
||||
|
(6) Fuzzy Grade |
0.413*** |
0.715*** |
0.261*** |
0.467*** |
0.827*** |
- |
|||
|
(7) Gender |
0.029 |
-0.013 |
0.051 |
0.035 |
0.016 |
-0.024 |
- |
||
|
(8) Cluster |
0.091 |
0.095 |
0.183** |
-0.161** |
0.071 |
-0.020 |
0.053 |
- |
|
|
(9) Learning method |
-0.177** |
-0.239*** |
0.239*** |
0.282*** |
-0.090 |
-0.090 |
-0.120* |
-0.174** |
- |
Note: * p < .05, ** p < .01, *** p < .001
Table 5. The distribution of grades among students based on tradition and fuzzy
|
Fuzzy grade |
||||||||||
|
80-100 |
75-79 |
70-74 |
65-69 |
60-64 |
55-59 |
50-54 |
<50 |
Total |
||
|
Traditional grade |
80-100 |
291 |
5 |
0 |
0 |
0 |
0 |
0 |
0 |
296 |
|
75-79 |
5 |
3 |
2 |
0 |
0 |
0 |
0 |
0 |
10 |
|
|
70-74 |
0 |
0 |
1 |
1 |
6 |
0 |
0 |
0 |
8 |
|
|
65-69 |
0 |
0 |
0 |
1 |
0 |
0 |
0 |
1 |
2 |
|
|
60-64 |
0 |
0 |
0 |
0 |
0 |
0 |
0 |
0 |
0 |
|
|
55-59 |
0 |
0 |
0 |
0 |
0 |
1 |
0 |
1 |
2 |
|
|
50-54 |
0 |
0 |
0 |
0 |
0 |
0 |
0 |
0 |
0 |
|
|
<50 |
0 |
0 |
0 |
0 |
0 |
0 |
0 |
0 |
0 |
|
|
Total |
296 |
8 |
3 |
2 |
6 |
1 |
0 |
2 |
318 |
|
Table 6. An excerpt of the traditional and fuzzy grades
|
No. |
Attendance |
Worksheet |
Workgroup |
Final Examination |
Traditional grade |
Fuzzy grade |
|
1 |
4.3 |
55.1 |
13.5 |
18.0 |
91 |
92 |
|
2 |
5.0 |
52.2 |
12.8 |
18.5 |
88 |
92 |
|
3 |
5.0 |
53.5 |
12.0 |
17.0 |
87 |
92 |
|
4 |
4.5 |
50.2 |
11.4 |
16.5 |
83 |
91 |
|
5 |
3.8 |
32.7 |
15.0 |
19.5 |
71 |
72 |
|
6 |
4.8 |
33.1 |
15.0 |
19.5 |
70 |
72 |
|
7 |
4.5 |
48.1 |
12.0 |
14.0 |
79 |
91 |
|
8 |
5.0 |
45.2 |
3.3 |
19.0 |
72 |
87 |
|
9 |
5.0 |
41.7 |
12.0 |
19.0 |
78 |
85 |
|
10 |
4.8 |
43.2 |
12.8 |
14.5 |
75 |
83 |
|
11 |
4.8 |
40.7 |
14.3 |
15.0 |
75 |
81 |
|
12 |
3.9 |
38.0 |
14.0 |
14.0 |
70 |
75 |
|
13 |
3.8 |
23.9 |
13.1 |
16.5 |
57 |
72 |
|
14 |
4.5 |
36.1 |
10.5 |
19.0 |
70 |
69 |
|
15 |
3.0 |
34.0 |
10.0 |
10.0 |
57 |
53 |
Table 5 (fuzzy grades and traditional grades being clustered together in eight intervals are 1: 80-100; 2: 75-79; 3: 70-74; 4: 65-69; 5: 60-64; 6: 55-59; 7: 50-54; 8: <50) shows three intervals of the fuzzy grades increasing the number of students 80-100, 75-79, 70-74, 60-64, and two intervals of the fuzzy grades decreasing the number of students 65-69, 50-54. For the interval 80-100 of the fuzzy grades, the total number of students is 296, of which 291 students are in the same grades as the traditional grade; 5 students move up from the interval (75-79). For each interval (75-79, 70-74, 6064) of the fuzzy grades, one student moves up from the other interval. For the intervals (65-69, 50-54) of the fuzzy grades, two students and one student move down from the interval 70-74 and the interval 55-59, respectively.
Table 6 depicts an excerpt of tradition and fuzzy grades from the scores of the input variables and three cases of the fuzzy-based grades adjusted from the tradition grades. The first five columns of Table 6 describe the scores of 15
students from 318 students (attendance, worksheet, workgroup, and final examination) and each student on each row. The following two columns describe grades based on tradition and fuzzy logic. In Table 5, students having the same grades in the traditional method could be in different grades of the fuzzy method. For example, in cases 6, 12 and 14, three students got 70 in the traditional method. However, in the fuzzy method, the first student (No. 6) is the exact grade, the second student (No. 12) has a higher grade, and the third student (No. 14) has a lower grade. From the results of Tables 4-6, we confirm the research question RQ1 that there is a difference between tradition and fuzzy grades. The fuzzy logic evaluation method is stricter and fairer than the tradition method.
There are two models using linear regression with the dependent variable “Fuzzy grade”: the first model (Model 1) has four predictors ( attendance , worksheet , workgroup , and final examination ); the second model (Model 2) is used hierarchical linear regression based on the first model with has more three predictors ( learning method, gender , and cluster ) in the block 2 of the hierarchical regression (the block 1 has the four variables which are the same with the first model). The results of the two models are depicted in Table 7. In Model 1, the overall model is meaningful, as indicated by the significant intercept and the significant predictors (worksheet, workgroup, final examination) with p < 0.001. However, the attendance predictor does not have a statistically significant relationship with the outcome in this model. The Model 2 incorporates additional predictors beyond those in the Model 1. The overall model is significant ( p = 0.006), as indicated by the significant intercept and the significant predictors (worksheet, workgroup, final examination). The attendance predictor also remains non-significant in this model. Among the new predictors introduced in the block 2, the “learning method” predictor is almost significant ( p = 0.060), while “gender” and “cluster” are not statistically significant. This answers the research question RQ2 that the learning method affects students’ fuzzy grades. The positive coefficient (β=1.722) of the learning method suggests that, on average, onsite learning has a higher value for the fuzzy grades compared to online learning. The research question RQ3 is also answered students studying online have fuzzy grades, which are not higher than students studying onsite. Model 2 provides more accurate predictions of the dependent variable (Model 2 has a lower RMSE (3.74) compared to Model 1 (3.84)). Both Model 1 and Model 2 have statistically significant ( p <0.001), indicating that the regression models as a whole are significant.
Table 7. The results of the hierarchical linear regression for a dependent variable (fuzzy grade)
Model coefficients
|
Model 1 |
Model 2 |
|||||||
|
Predictor |
Estimate |
SE |
t |
p |
Estimate |
SE |
t |
p |
|
Intercept a |
21.195 |
5.221 |
4.059 |
< .001 |
15.480 |
5.585 |
2.772 |
0.006 |
|
Attendance |
-0.744 |
0.999 |
-0.745 |
0.457 |
-0.951 |
1.004 |
-0.947 |
0.344 |
|
Worksheet |
0.801 |
0.043 |
18.596 |
< .001 |
0.791 |
0.046 |
17.395 |
< .001 |
|
Workgroup |
0.704 |
0.176 |
4.000 |
< .001 |
1.006 |
0.197 |
5.109 |
< .001 |
|
Final examination |
1.030 |
0.115 |
8.937 |
< .001 |
1.115 |
0.142 |
7.873 |
< .001 |
|
Learning method (baseline = online) Onsite |
1. 722 |
0.914 |
1.885 |
0.060 |
||||
|
Gender (baseline = male) Female |
0.772 |
0.518 |
1.493 |
0.137 |
||||
|
Cluster (baseline = 1st cluster) 2 3 4 5 6 |
1.156 -0.008 0.854 -0.699 -1.624 |
0.976 1.185 1.261 0.930 0.970 |
1.185 -0.007 0.678 -0.752 -1.675 |
0.237 0.995 0.499 0.453 0.095 |
||||
Model fit
5. Conclusion
In this study, we investigated a hybrid approach combining fuzzy logic and hierarchical linear regression to assess students’ performance. An evaluation method based on fuzzy logic has been constructed with eight levels for each student by considering three aspects (low, medium, and high) of an input variable. From the obtained results of the experiments, fuzzy grades provided a more nuanced and flexible assessment of students’ performance. Instead of a single grade, fuzzy grading allows for a finer-grained analysis that captures the gradations and nuances in students’ performance. By deploying hierarchical linear regression to enhance our analysis further, we found that among additional factors, the “learning method” factor affected students’ performance almost significantly ( p = 0.060). This hybrid approach allowed us to assess students’ performance with greater nuance and adaptability when compared to a traditional method. These findings can guide educational decision-making, curriculum development, and instructional strategies to enhance student learning outcomes.
6. Limitations and Recommendations for Future Research
There are several limitations in this study. Firstly, the sample size was limited to students from a single university in Thailand, which may restrict the generalizability of the findings to other sociocultural contexts and educational levels. Future studies should aim to evaluate students’ characteristics and performance across different age groups, levels, and societies to provide a more comprehensive understanding. Secondly, the data collected on student characteristics were relatively limited. To enhance the study’s validity, future research could incorporate longitudinal data, allowing for more accurate inferences and a better understanding of the relationships between variables over time. In addition, it would be beneficial to incorporate alternative assessment methods, such as open-ended questions, observations, and interviews, to capture a more holistic view of students’ performance, including their laboratory skills. These methods can provide richer insights and complement the quantitative analysis conducted in this study. Regarding the design of fuzzy rules, although experts were involved in this study, future research could explore the application of machine learning techniques to automatically extract these rules. Then, this would enhance the efficiency and objectivity of the fuzzy logic model. Furthermore, the framework developed in this research has the potential to be applied to evaluate students at different educational levels, ranging from primary school to high school and university. Expanding the scope of the study to encompass various educational contexts would provide valuable insights into the effectiveness of the fuzzy logic model across different settings. Finally, to gain a more comprehensive understanding of the research topic, future studies could combine qualitative and quantitative data. This mixed-methods approach would provide a deeper exploration of the factors influencing students’ performance and offer richer insights into their experiences and perceptions. Overall, these considerations highlight areas for improvement and provide avenues for future research to overcome the limitations of this study and contribute to a more robust understanding of the topic.
References Analyzing Students’ Performance Using Fuzzy Logic and Hierarchical Linear Regression
- L. A. Zadeh, “Fuzzy sets,” Information and control, vol. 8, no. 3, pp. 338–353, 1965.
- R. Sripan and B. Suksawat, “Propose of fuzzy logic-based students’ learning assessment,” in ICCAS 2010, 2010, pp. 414–417.
- V. Ivanova and B. Zlatanov, “Implementation of fuzzy functions aimed at fairer grading of students’ tests,” Educ Sci (Basel), vol. 9, no. 3, p. 214, 2019.
- R. S. Yadav, A. K. Soni, and S. Pal, “A study of academic performance evaluation using Fuzzy Logic techniques,” in 2014 International Conference on Computing for Sustainable Global Development (INDIACom), 2014, pp. 48–53.
- N. A. Namli and O. Şenkal, “Using the fuzzy logic in assessing the programming performance of students,” International Journal of Assessment Tools in Education, vol. 5, no. 4, pp. 701–712, 2018.
- K. Chrysafiadi, C. Troussas, and M. Virvou, “Combination of fuzzy and cognitive theories for adaptive e-assessment,” Expert Syst Appl, vol. 161, p. 113614, 2020.
- S. Wen and D. Liu, “Students’ Learning Performance Evaluation Using a New Fuzzy Inference System,” in 2021 2nd International Conference on Artificial Intelligence and Education (ICAIE), 2021, pp. 650–656.
- N. A. Bakar, S. Rosbi, and A. A. Bakar, “Evaluation of Students Performance using Fuzzy Set Theory in Online Learning of Islamic Finance Course.,” International Journal of Interactive Mobile Technologies, vol. 15, no. 7, pp. 202–209, 2021.
- J. Stańdo, I. Mokwa-Tarnowska, and M. Roszak, “Analysis of Learning Outcomes in Medical Education with the Use of Fuzzy Logic,” Studies in Logic, Grammar and Rhetoric, vol. 66, no. 3, pp. 609–616, 2021.
- T. Petra and M. J. A. Aziz, “Analysing Student Performance In Higher Education Using Fuzzy Logic Evaluation,” International Journal of Scintific and Technology Research, vol. 1, no. 01, pp. 322–327, 2021.
- T. A. Ajoi, S. S. Gran, A. Kanyan, and S. F. Lajim, “An enhanced systematic student performance evaluation based on fuzzy logic approach for selection of best student award,” Asian Journal of University Education, vol. 16, no. 4, pp. 10–20, 2021.
- D. Doz, D. Felda, and M. Cotič, “Combining Students’ Grades and Achievements on the National Assessment of Knowledge: A Fuzzy Logic Approach,” Axioms, vol. 11, no. 8, p. 359, 2022.
- B. E. in Özseven and N. Cagman, “A Novel Student Performance Evaluation Model Based on Fuzzy Logic for Distance Learning,” International Journal of Multidisciplinary Studies and Innovative Technologies, vol. 6, no. 1, pp. 29–37, 2022.
- S. Saliu, “Constrained subjective assessment of student learning,” J Sci Educ Technol, vol. 14, no. 3, pp. 271–284, 2005.
- N. Arora and J. R. Saini, “A fuzzy probabilistic neural network for student’s academic performance prediction,” Int J Innov Res Sci Eng Technol, vol. 2, no. 9, pp. 4425–4432, 2013.
- J. P. Marini, E. J. Shaw, L. Young, and M. Ewing, “Getting to Know Your Criterion: Examining College Course Grades and GPAs over Time.,” College Board, 2018.
- V. Ivanova and B. Zlatanov, “Application of fuzzy logic in online test evaluation in English as a foreign language at university level,” in AIP Conference Proceedings, 2019, p. 40009.
- D. N. Yoliadi, “Analysis of Student Academic Achievement Levels using Fuzzy Logic,” Jurnal Indonesia: Manajemen Informatika dan Komunikasi, vol. 4, no. 1, pp. 373–390, 2023.
- R. Thinakaran, S. Chupra, and M. Batumalay, “Motivation assessment model for intelligent tutoring system based on mamdani inference system,” IAES International Journal of Artificial Intelligence, vol. 12, no. 1, p. 189, 2023.
- E. H. Özberk, K. Atalay Kabasakal, and N. I. Boztunç Öztürk, “Investigating the factors affecting Turkish students’ PISA 2012 mathematics achievement using hierarchical linear modeling,” 2017.
- S.-P. Chien and H.-K. Wu, “Examining influences of science teachers’ practices and beliefs about technology-based assessment on students’ performances: A hierarchical linear modeling approach,” Comput Educ, vol. 157, p. 103986, 2020.
- L. Hsu and Y.-J. Chen, “Hierarchical linear modeling to explore contextual effects on EFL teachers’ technology, pedagogy, and content knowledge (TPACK): the Taiwanese case,” The Asia-Pacific Education Researcher, vol. 32, no. 1, pp. 1–13, 2023.
- M. Wang, R. Yu, and J. Hu, “The relationship between social media-related factors and student collaborative problem-solving achievement: an HLM analysis of 37 countries,” Educ Inf Technol (Dordr), pp. 1–19, 2023.
- M.-K. Chen, H.-N. Chien, and R.-L. Liu, “An Empirical Study on the Learning Experiences and Outcomes of College Student Club Committee Members Using a Linear Hierarchical Regression Model,” Applied System Innovation, vol. 6, no. 1, p. 23, 2023.
- E. Cox, “Fuzzy fundamentals,” IEEE Spectr, vol. 29, no. 10, pp. 58–61, 1992.
- R, “R programming language.” 2023. [Online]. Available: https://www.r-project.org/
- Jamovi-Project, “Jamovi (Version 2.3) [Computer Software].” 2023. [Online]. Available: https://www.jamovi.org
- L. M. Sullivan, K. A. Dukes, and E. Losina, “An introduction to hierarchical linear modelling,” Stat Med, vol. 18, no. 7, pp. 855–888, 1999.
- Matlab-online, “Matlab online.” 2023. [Online]. Available: https://matlab.mathworks.com/
