Application of bat algorithm for texture image classification

Author: Zhiwei Ye, Xiangfeng Hou, Xu Zhang, Juan Yang
Journal: International Journal of Intelligent Systems and Applications @ijisa
Article in issue: 5 vol.10, 2018.
Free access
Textural feature extraction of image is a basic work for image analysis. A number of approaches have been put forward to describe texture features quantitatively, such as gray level co-occurrence matrix, fractal wavelet, Gabor wavelet and local binary pattern etc, among them texture feature extracted based on “tuned” mask will not suffer from rotation and scale of images. However, it needs to take a lot of time to learn the tuned mask with the traditional methods and could not acquire the satisfying mask sometimes. In essence, it is a very hard combinational optimization problem and easy to fall into the local optimum with mountain climbing method. Bat algorithm is a newly proposed meta-heuristic optimization, which is employed to tune the optimal mask in the paper. The procedure of bat algorithm to learn the tuned mask is detailed. Experiments results testifies that the proposed method is propitious to draw texture features, its performance is better than the simple particle swarm optimization and genetic algorithm based mask tuning scheme, which is a robust approach for texture image analysis.
Image classification, Texture analysis, Tuned mask, Feature extraction, Bat algorithm
Short address: https://sciup.org/15016488
IDR: 15016488 | DOI: 10.5815/ijisa.2018.05.05
Text of the scientific article Application of bat algorithm for texture image classification
Published Online May 2018 in MECS
Over the past few years, the development of social high-speed information combined with big data led to the boom in the field of artificial intelligence in the society, image recognition and computer vision is the most important research and application branch of artificial intelligence. A typical computer vision system might be divided into components as displayed in Fig.1. Texture analysis might be applied to various stages of the process. At the preprocessing stage, images could be partitioned into contiguous regions based on texture properties of each region; at the stages of feature extraction and classification, texture features could help for classifying patterns or identifying objects. In brief, texture analysis is an important topic in many applications in machine vision, which is to identify a texture sample as one of several possible classes with a reliable texture classifier[1]. It is a primary work to extract textural features to be as compact as possible, and yet as discriminating as possible for all other texture-related applications. Nevertheless, the concept of texture is hard to be defined as in the real world there are diverse textures due to changes in orientation, scale or other visual appearance [1]. A texture image is primary a function of the variables as below: the texture surface, its albedo, the illumination, the camera and its viewing position [2]. Much effort around the issue has been made. For instance, Alvaro G. Zuñiga proposed a method to enhance the Gabor wavelets process extracting a fractal signature of the magnitude space [3], Fahad Shahbaz Khan used an information-theoretic compression technique to obtain a compact texture description with multiple texture descriptors [4]. Dolly Choudhary Used wavelet feature to measure performance analysis of texture image [23].Furthermore, grey level run length, local binary pattern, fractals, co-occurrence, wavelet transforms, Laws approach, filter banks etc were also in investigated [1-7], generally which might be categorized as two categories, structural and statistical approaches. Beyond these methods, J. YOU and H. A. COHEN designed an adaptive texture feature extraction method named “tuned mask” avoided from changes in rotation and scale of the texture image [8]. However, it made use of a search strategy of gradient estimation and the random search with heuristic learning, which led to the local optimum and a mass of computation. In nature, it is a complicated combinational optimization problem might be handled with evolutionary algorithms or swarm intelligence algorithms. Some studies have focused on the topic, such as Zheng utilized genetic algorithms (GA) to obtain the optimal tuned mask and produced good results [9], Ye applied Particle Swarm Optimization Algorithm (PSO), a train the tuned mask [10].
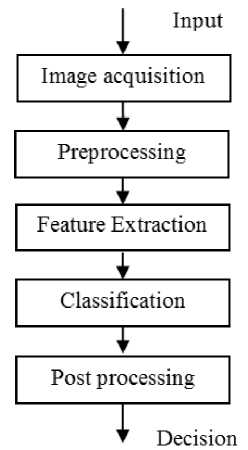
Fig.1 The components of a typical computer vision system
Kapil Sharma proposed a parallel bat algorithm by using MapReduce model.[24] Zheng introduced a masked method optimized by artificial immune algorithm (AIA) [11], Wang used Gravitational search algorithm (GSA) to achieve the best tuned mask [12] etc. On the whole, evolutionary algorithms or swarm intelligence algorithms performs well on the problem. However, to get the best tuned mask is an optimization problem with 25 dimensions, the solution space is in the real number space, there is no algorithm which can guarantee the optimal solution. More evolutionary algorithms or swarm intelligence algorithms can be the solution to solve the problem.
Bat algorithm (BA) is a recently proposed global search algorithm [13]. In [13], Yang Xin-She has made a conceptual comparison of bat algorithm (BA), genetic algorithm (GA), and particle swarm optimization (PSO). The final results testify BA does not need selection, crossover and mutation operations like GA. What's more, it could converge to the optimal solution more stably. Currently, BA has been widely applied in various fields, such as Bora et al. employed BA to work out the brushless DC wheel motor problems [14], Yang extend this algorithm to solve multi-objective optimization problems [15], Taha A M applied bat algorithm for feature selection [16], Adarsh B R handled with the economic dispatch problem with bat algorithm [17], Rabiu O. Isah used a bat-active contour algorithm to generate medical image segmentation and so on [25]. As a result, in the paper, BA is employed to learn the tuned mask and used for remote sensing image classification.
The rest of the paper is structured as below. Section 2
shows the tuned mask. Section 3 illustrates the principle of bat algorithm. The idea of bat algorithm to produce the optimal tuned mask is introduced in section 4. Section 5 presents the experimental results and discussion. Finally, conclusion is given in section 6.
-
II. The Fundamental of Tuned Mask
Statistical approach for texture analysis is widely applied in practical work. The statistical texture analysis proposed by Laws is simple to run. In the model, the texture feature is described with the conception of "texture energy" (TE) calculated at each pixel location ( m, n ) in the convolved image over a large window size 15*15 in the spatial domain. However, it is only propitious to some kinds of textures. Furthermore, texture often alters in rotation and scale in practice, Laws’ masks with constants fail to capture the invariant features to the change. Therefore, J. YOU and H. A. COHEN suggested to amend Laws' scheme through discarding the numerical fixed masks substitute them with variables [8]. In this approach, a single mask of size 5 * 5 is generated that can extract the invariant feature for certain texture at different rotations and scales. In the meanwhile, it well distinguishes the texture from other textures. The new mask is termed by the tuned mask. Generally speaking, this method includes two steps. The 1 st Step is to convolve the whole image with the “tuned” mask A , where A is limited to be symmetrical and zero sum[9]. Consequently, there is only 10 numbers needed in the mask. The 2D convolution operation of the image I(m,n ) with size N×N and mask A(m,n) with size (2a + l ) x (2a + l ) is calculated as (1) below.
k = a l = a
F(m, n) = A(m, n) * I(m, n) =zzA (m, n) I (m + k, n +1) k=—a l=—a where m,n = 0,1,...,N—1. In the 2nd Step, It calculates the variance statistic within a Wx x w^ window (9*9) at pixel(m,n). The texture energy TE denotes the certain texture image with size m*n which is attained by computing the average energy value of the image E over the entire image as (2).
ZZ F ( m , n ) 2
E ( i , j ) = w^-------- (2)
P x w^ x wA, xy where P2 =Z A(m, n)2 . Apparently, The energy value of textures is decided by the mask, well learnt tuned mask has good identification ability. The paper proposes to employ bat algorithm to generate the robust “tuned” mask. Details are given in section 3 and section4.
-
III. The Principle of Bat Algorithm
At present, meta-heuristic algorithms are becoming an efficient way for solving very tough optimization problems.[21] These algorithms only make few or no assumptions about the optimization problem to be managed and could make an extensive search in candidate spaces. Behaviors of physical systems or biological systems in nature have bred most heuristic and meta-heuristic algorithms, such as ant colony optimization algorithm[18], fruit fly optimization algorithm[19], particle swarm optimization[20], and simulated annealing etc. In order to combine significant advantages of these algorithms and attempt to exploit a relatively better algorithm, Xin-She Yang proposed a bat inspired meta-heuristic optimization algorithm in 2010.
-
A. The basic idea of bat algorithm
Bat algorithm (BA) is based on the echo ranging behaviors of bats which uses virtual bats to deal with practical problem. For the sake of simplicity, the following idealized rules are defined in [13]:
-
1) All bats utilize echo ranging to measure distance, and the difference between prey and background barriers are known by their own in some magical way;
-
2) Bats move randomly with velocity V at position X , moreover each bat has a settled frequency f varying wavelength X and loudness A to prey. They can intelligently correct the wavelength (or frequency) of their emitted pulses. Additionally, bats are able to change the pulse emission rate r e [0,1] in accordance to the proximity of their target.
-
3) Due to the loudness changing in any direction, here we assume that the loudness change from a large positive constant value A to a minimum constant value A .
For simplicity, the typical plus rate ranges for bats are set between 0 and 1, where 0 stands for no pulses at all, and 1 stands for the maximum rate of pulse emission.
-
B. Movement of virtual bats
To tackle with practical problems, the virtual bats are used and the rules that update new solutions X, and velocities I//' at time step t updated in a multidimensional search space are defined by the following equations.
Л = f min + (f max — f mn ) £
V = V - 1 + ( X - - X ) f (4)
X * = X - - 1 + V * (5)
where X is a random vector generated by a uniform distribution. Here X* is the current global best location (solution) which is located after comparing all the solutions among all the n bats. The frequency f, can be used to adjust the velocity change while fixing the wavelength X,, depending on the form of the problem of interest. In the initial state, the frequency of each bat is randomly drawn in the range of [fmtn, fmax].
In the part of local search, after comparing solutions of all bats, the optimal solutions could be detected, which is labeled as the current best solutions, then a new solution might be generated locally by using random walk:
X = X oM + e A (6)
where e e [ - 1,1] is a random number and A =< A t > holds the average loudness value of the whole bats at this time.
-
C. Loudness and pulse emission
Furthermore, it is needs to update the loudness A , and the rate r , of pulse emission accordingly along with the iterations. Once the prey is found by a bat, the loudness usually decreases and the rate of pulse emission accordingly increases, we could set the loudness as any value of convenience. For example, here A0 = 1 and Amin = 0, suppose Amin = 0 denotes that the prey is by a bat or temporarily the bat will stop emitting.
A + 1 = a A * , r + 1 = r 0[1 - exp( -y t )] (7)
where a and r0 are constants. As the matter of fact, a resembles the cooling factor of a cooling schedule in the simulated annealing. For any a and у in the range of 0 < a < 1 and Y > 0, we have
A ^ 0, r ^ r 0, as t ^^ (8)
In common, a is as the same value as у . Initially each bat holds different values of loudness and pulse emission rate. Loudness and emission rates of bates shall be renewed when solutions are improved.
-
IV. The Proposed Method
How to apply bat algorithm to train the optimal tuned mask will be explained in this section in details.
-
A. The encoding scheme
The key issue to employ bat algorithm is the expression of the problem, that is, how to make an appropriate mapping between problem solution and the virtual bat. In the bat algorithm, the solution can be denoted by a position vector of a virtual bat, the dimension of the position vector depends on the number of parameters. In the paper, the search space for a candidate mask is 25 dimensions, and each element of the mask is a continuous or integer value. The symmetrical mask is suggested to avoid a mass of computation [9], and the size of the mask is 5*5 and requires being zero- sum; thus, only 10 parameters in a mask need to be encoded. Moreover, in the tuned mask, the layout of parameters of the mask plays more significant role in the texture feature extraction than their actual values. As is known, the primary bat algorithm is coded in real numbers itself, which is feasible to handle with the problem of tuned mask training directly. For simplicity, the range of each element in the mask is limited in the range of [-50, 50].
-
B. Fitness function
Bat algorithm utilizes a fitness function to measure the performance of the tuned mask. The function should reflect the intra-class convergence (denoted by d ) of the texture feature under various conditions and the interclass dispersion (denoted by d ) of different texture features, which is defined as (9).
Fitness = min d 2 ( p» (9)
1 + max( d ( q ))
where p = 1,2,..., C 2C , q = 1,2,..., N C , N C is the number of texture classes, C 2 is the number of interclass square error among N C texture classes, d ( q ) is the intra-class square error of the qth texture class, d ( p )is an inter-class square error, it is calculated as (1011).
n
X (^ - u q ) 2
d i ( q ) = k = 1 ------------ (10)
sn d2(P) = wa X wb X (ua (P) - ub (P))2 (11)
where sn is the number of samples in the qth texture class, Te is the texture energy of the kth sample in the qth texture class, u is the average value of the samples of the qth texture class, u ( p ) is the mean value of the samples of the ath texture class, u ( p ) is the mean value of the bth texture class, w is the total number of samples in the ath texture class, w is the total number of samples in the bth texture class. The larger the value of the fitness function is, the better the quality of tuned mask is.
-
C. Implementation of the proposed method
The proposed method is easy to be carried out, the procedures of the proposed approach are shown as following.
Step2.Initialize the population of bats randomly;
Step3. Evaluate bats in the initial population and select the current global optimal position with the defined fitness function;
Step4. Update the frequency, velocity and position for each virtual bat according to (3-4).
Step6. Calculate the fitness value of the new solution created in step5.
Step7. Decide whether renew the individual parameters or not; if( rand < Ai & f ( X, ) < f ( X, ), go to step8, or go to step9.
Step8. Use the new solutions to replace the old solution, increase r and decrease A .
Step9. Find out the global best virtual bat, contrast it with the current global optimal virtual bat and renew the global best solution with the found best virtual bat.
Step11 Output the position of the best virtual bat as the tuned mask.
-
V. Simulation And Discussion
To verify proposed method, three tests are conducted on some texture images: the first two tests classify texture images and the third test detects some buildings in images. Furthermore, the proposed method is contrasted to tuned mask learnt by genetic algorithm(GA-mask) and tuned mask learnt by particle swarm optimization optimized (PSO-mask). Parameters used in these methods are shown in table1, table 2 and table3.
Table 1. Parameters used in GA-mask
|
Parameter |
Explanation |
Value |
|
S |
Number of genetics |
50 |
|
Max gen |
Maximum iteration number |
50 |
|
P s |
Selection ratio |
0.9 |
|
P c |
Crossover ratio |
0.85 |
|
P m |
Mutation ratio |
0.05 |
Table 2. Parameters used in PSO-mask
|
Parameter |
Explanation |
Value |
|
S |
Number of particles |
50 |
|
Max gen |
Maximum iteration number |
50 |
|
C 1 |
Cognitive coefficient |
2 |
|
C 1 |
Cognitive coefficient |
2 |
|
w |
inertia weight |
1 |
Table 3. Parameters used in BA-mask.
|
Parameter |
Explanation |
Value |
|
S |
Number of bats |
50 |
|
Max gen |
Maximum iteration number |
50 |
|
f i |
Range of frequency |
[0, 0.5 ] |
|
r i |
Rate of pulse emission |
[0,1] |
|
A i |
Loudness value |
[1,2] |
-
A. Experiment 1
There are 15 vegetation textural images and other textural images used as training samples, in the meanwhile, 15 vegetation textural images and other textural images are utilized as testing instances. In case that GA, PSO and BA are all stochastic algorithms in nature [22], as a result, the proposed method has been executed 10 times for each sample, the average energy value of each sample with the proposed method is displayed in table4 - table6, and classified results for texture images with different method is given in Table 7. Some samples are shown in Fig.2.
As is shown in table6, the mean value of vegetation images is 1461.85, in the meantime, the mean value of energy of none vegetation images is 639.74; in addition, the minimum energy of vegetation samples is 1310.25, the maximum energy of none-vegetation samples is 802.54. Obviously, these two types of training samples can be easily differentiated. It certifies that the proposed method performs very well for tuning the optimal textural mask.
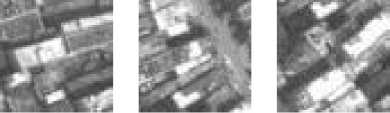
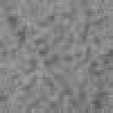
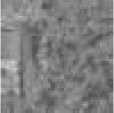
Fig.2. Some sample images for experiment1
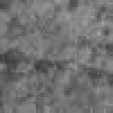
Table 4. The average of texture energy of GA
|
Vegetation textures |
N-vegetation textures |
|||||
|
Number |
Energy |
Number |
Energy |
|||
|
1 |
517.50 |
1 |
253.36 |
|||
|
2 |
558.54 |
2 |
268.54 |
|||
|
3 |
609.38 |
3 |
318.53* |
|||
|
4 |
512.15 |
4 |
291.61 |
|||
|
5 |
551.34 |
5 |
244.42 |
|||
|
6 |
557.06 |
6 |
250.01 |
|||
|
7 |
461.45* |
7 |
254.24 |
|||
|
8 |
508.68 |
8 |
250.52 |
|||
|
9 |
575.04 |
9 |
249.64 |
|||
|
10 |
509.45 |
10 |
249.88 |
|||
|
11 |
583.60 |
11 |
246.44 |
|||
|
12 |
572.05 |
12 |
238.92 |
|||
|
13 |
545.03 |
13 |
227.93 |
|||
|
14 |
484.47 |
14 |
201.93 |
|||
|
15 |
541.08 |
15 |
225.75 |
|||
|
Average |
539.12 |
Average |
251.45 |
|||
In Table7, recognition rate is the percentage of correctly distinguished testing samples with the tuned mask learnt from training samples. For vegetation textures, GA is able to acquire accuracy of 75%, the average accuracy achieve 77.5%; PSO could gain better results than that of GA, the average accuracy is 90%; BA gets the best performance among all these algorithms, the average accuracy is 92.5%. Moreover, it shows that BA has the maximum fitness value 39.8362, the best among 3 algorithms. Fig.3 displays fitness evolution curve of 3 algorithms, it suggests that the BA has better evolution and optimization ability than PSO and GA, which generates more robust tuned mask for classifying textures.
Table 5. The average of texture energy of PSO
|
Vegetation textures |
N-vegetation textures |
|||||
|
Number |
Energy |
Number |
Energy |
|||
|
1 |
1147.79 |
1 |
604.70 |
|||
|
2 |
1313.23 |
2 |
656.51 |
|||
|
3 |
1304.18 |
3 |
780.65 |
|||
|
4 |
1254.20 |
4 |
718.55 |
|||
|
5 |
1114.15 |
5 |
606.59 |
|||
|
6 |
1249.22 |
6 |
606.24 |
|||
|
7 |
1188.23 |
7 |
601.06 |
|||
|
8 |
1311.04 |
8 |
590.30 |
|||
|
9 |
1374.28 |
9 |
596.18 |
|||
|
10 |
1168.38 |
10 |
588.05 |
|||
|
11 |
1226.19 |
11 |
588.08 |
|||
|
12 |
1232.88 |
12 |
568.99 |
|||
|
13 |
1077.14 |
13 |
547.24 |
|||
|
14 |
1139.88 |
14 |
483.45 |
|||
|
15 |
1281.76 |
15 |
545.17 |
|||
|
Average |
1225.5 |
Average |
605.45 |
|||
Table 6. Taverage of texture energy of the proposed method
|
Vegetation textures |
N-vegetation textures |
|||||
|
Number |
Energy |
Number |
Energy |
|||
|
1 |
1398.91 |
1 |
638.29 |
|||
|
2 |
1555.40 |
2 |
684.28 |
|||
|
3 |
1528.36 |
3 |
802.54* |
|||
|
4 |
1478.77 |
4 |
762.13 |
|||
|
5 |
1317.79 |
5 |
627.55 |
|||
|
6 |
1422.82 |
6 |
633.47 |
|||
|
7 |
1364.27 |
7 |
641.00 |
|||
|
8 |
1531.45 |
8 |
629.46 |
|||
|
9 |
1650.80 |
9 |
630.77 |
|||
|
10 |
1399.86 |
10 |
618.90 |
|||
|
11 |
1490.90 |
11 |
623.45 |
|||
|
12 |
1541.64 |
12 |
606.93 |
|||
|
13 |
1310.25* |
13 |
588.02 |
|||
|
14 |
1412.55 |
14 |
527.34 |
|||
|
15 |
1524.02 |
15 |
581.99 |
|||
|
Average |
1461.85 |
Average |
639.74 |
|||
Table 7. Experimental result by using different algorithms
|
Algorithm |
Fitness value |
Recognition rate (%) |
|
|
Vegetation |
N-vegetation |
||
|
GA |
34.6619 |
75.00 |
80.00 |
|
PSO |
38.8143 |
90.00 |
90.00 |
|
BA |
39.8362 |
90.00 |
95.00 |
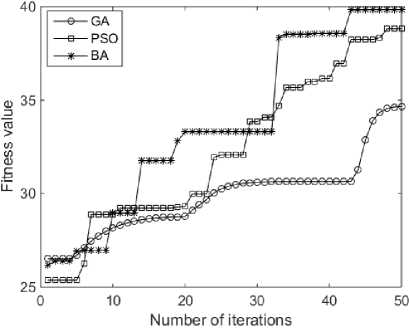
Fig.3 fitness evolution curve of three algorithms for test1
-
B. Experiment 2
There are 15 water textural images and other texture images used as training samples, at the same time, other 15 water texture images and other texture images are used as testing samples. The experiments 2 is conducted in the same operating environment as experiment 1. The average energy value of every sample with the proposed method is shown in table 10, and the classification accuracy for 30 samples with tuned mask learnt by different algorithms is shown in Table11.
Table 8. The average of texture energy of GA
|
None water area textures |
water area textures |
|||||
|
Number |
Energy |
Number |
Energy |
|||
|
1 |
2876.02 |
1 |
968.92 |
|||
|
2 |
2683.02 |
2 |
570.46 |
|||
|
3 |
2882.94 |
3 |
835.56 |
|||
|
4 |
2795.39 |
4 |
594.68 |
|||
|
5 |
2822.53 |
5 |
796.08 |
|||
|
6 |
2766.33 |
6 |
562.04 |
|||
|
7 |
2431.41 |
7 |
1133.32 |
|||
|
8 |
2951.26 |
8 |
1077.90 |
|||
|
9 |
2840.15 |
9 |
1367.00 |
|||
|
10 |
2611.17 |
10 |
1198.33 |
|||
|
11 |
2874.84 |
11 |
757.89 |
|||
|
12 |
2651.70 |
12 |
898.17 |
|||
|
13 |
2820.48 |
13 |
903.97 |
|||
|
14 |
3041.95 |
14 |
762.05 |
|||
|
15 |
2723.39 |
15 |
686.26 |
|||
|
Average |
2784.84 |
Average |
874.18 |
|||
Table 9. The average of texture energy of PSO
|
None water area textures |
water area textures |
|||||
|
Number |
Energy |
Number |
Energy |
|||
|
1 |
3583.37 |
1 |
1187.18 |
|||
|
2 |
3457.08 |
2 |
727.06 |
|||
|
3 |
3635.81 |
3 |
1055.52 |
|||
|
4 |
3509.45 |
4 |
775.60 |
|||
|
5 |
3524.53 |
5 |
1032.03 |
|||
|
6 |
3547.96 |
6 |
734.48 |
|||
|
7 |
3104.52* |
7 |
1468.96* |
|||
|
8 |
3697.00 |
8 |
1331.42 |
|||
|
9 |
3629.85 |
9 |
1723.23 |
|||
|
10 |
3343.03 |
10 |
1501.99 |
|||
|
11 |
3577.61 |
11 |
985.43 |
|||
|
12 |
3365.52 |
12 |
1167.61 |
|||
|
13 |
3616.65 |
13 |
1164.45 |
|||
|
14 |
3883.13 |
14 |
962.38 |
|||
|
15 |
3467.16 |
15 |
873.54 |
|||
|
Average |
3529.51 |
Average |
1112.73 |
|||
Table 10. The average of texture energy of the proposed method
|
None water area textures |
water area textures |
|||||
|
Number |
Energy |
Number |
Energy |
|||
|
1 |
5401.06 |
1 |
1808.84 |
|||
|
2 |
5179.58 |
2 |
1095.61 |
|||
|
3 |
5562.37 |
3 |
1595.10 |
|||
|
4 |
5389.48 |
4 |
1145.21 |
|||
|
5 |
5472.08 |
5 |
1542.10 |
|||
|
6 |
5369.80 |
6 |
1082.75 |
|||
|
7 |
4684.96* |
7 |
2182.35 |
|||
|
8 |
5596.66 |
8 |
2033.02 |
|||
|
9 |
5421.22 |
9 |
2627.53* |
|||
|
10 |
4942.47 |
10 |
2301.42 |
|||
|
11 |
5516.43 |
11 |
1457.95 |
|||
|
12 |
5112.10 |
12 |
1738.86 |
|||
|
13 |
5414.34 |
13 |
1745.85 |
|||
|
14 |
5833.81 |
14 |
1459.96 |
|||
|
15 |
5232.43 |
15 |
1321.43 |
|||
|
Average |
5341.92 |
Average |
1675.87 |
|||
Table 11. Experimental result by using different algorithms
|
Algorithm |
Fitness value |
Recognition rate (%) |
|
|
GA |
46.2518 |
90.00 |
85.00 |
|
PSO |
47.5606 |
95.00 |
95.00 |
|
BA |
48.5032 |
100.00 |
95.00 |
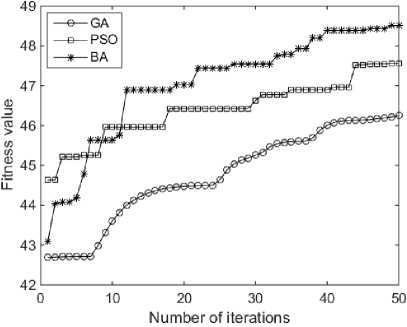
Fig.4. fitness evolution curve of three algorithms for test2
From Table 10, it revealed the biggest energy value of water area is 2627.53, the minimum energy value of none water area is 4684.96; furthermore, the average value of these two kinds of textures is clearly different, which implies that these two kinds of textures can be classified by energy value. In the matter of Table 11, it is clear that BA can obtain better results than that of GA and PSO. Its average accuracy is 97.5%. Particularly, BA is able to acquire accuracy of 100% for none water testing samples. Fig.4 demonstrates that BA has better evolution and optimization ability than PSO and GA, which is more appropriate to train tuned mask for extracting features from textural images.
-
C. Experiment 3
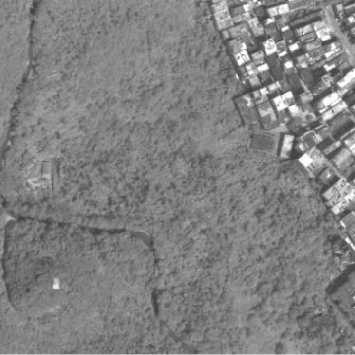
The experiment detects the textural area from images on the basis of the optimal tuned mask acquired by the proposed method, which is performed as following. First of all, the testing image is convolved with the learnt optimal mask according to (1); second, the energy value of every pixel is calculated according to (2) with the window size 15*15; third, pixels are classified with energy value and fisher discriminant criterion. Both two testing images are used in the paper and results are shown in Fig.5. In Fig.5-a and Fig.5-c, the building area is the objective and Fig.5-b and Fig.5-d are the detected results and there are very little impurities in the vegetation area. As is shown, the building areas are clearly differentiated from the area of vegetation. However, some marginal pixels are unable and not worth to be classified as the energy of the pixel is calculated in a window. As a result, in the paper, a post process is done, which checks the whole image and labels the unmarked pixels in line with their nearest neighbor pixels.
Fig.5-a. The building Image1
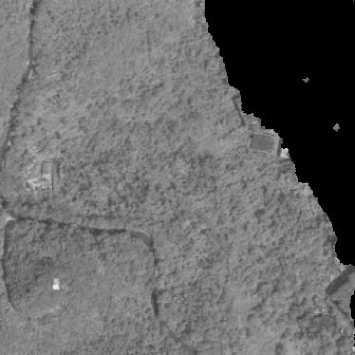
Fig.5-b. The Detected building of Image1
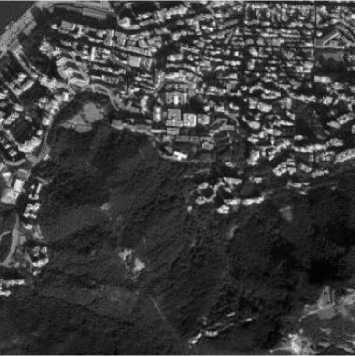
Fig.5-c. The building Image2
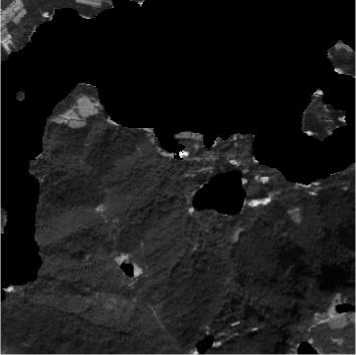
Fig.5-d. The Detected building of Image2
-
VI. Conclusion
In a word, feature extraction is a fundamental work for texture images recognition. In the paper, bat algorithm is employed to generate the optimal tuned mask for texture analysis. The performance of bat algorithm is measured on some texture images. Furthermore, the performance of bat algorithm is compared with GA and PSO. Experimental results display that bat algorithm is better than GA and PSO, which makes robust tuned mask. The texture feature of energy based on tuned mask has fine separating capacity for object detection. In future, it can foresee that more meta-heuristics algorithms have good application value and will be adopted for texture analysis.
Acknowledgement
This paper is funded by Beijing Key Laboratory of Urban Spatial Information Engineering NO.2014207, Research Guidance Project of Hubei Provincial Department of Education NO.B2017142, and Natural Science Foundation of China Grant No.41301371, 61170135, 61202287, 51372076
References Application of bat algorithm for texture image classification
- Vidyarthi A, Mittal N. Texture based feature extraction method for classification of brain tumor MRI [J]. Journal of Intelligent & Fuzzy Systems, 2017:1-12.
- Varma M, Zisserman A. A Statistical Approach to Texture Classification from Single Images [M]. Kluwer Academic Publishers, 2005.
- Zuñiga A G, Florindo J B, Bruno O M. Gabor wavelets combined with volumetric fractal dimension applied to texture analysis [J]. Pattern Recognition Letters,2014, 36(1):135-143.
- Khan F S, Rao M A, Weijer J V D, et al. Compact color–texture description for texture classification [J]. Pattern Recognition Letters, 2015, 51:16-22.
- João B. Florindo, Odemir M. Bruno. Texture analysis by multi-resolution fractal descritors. Expert Systems with Applications. 2013, 40, pp. 4022-4028.
- Pan Z, Li Z, Fan H, et al. Feature Based Local Binary Pattern for Rotation Invariant Texture Classification [J]. Expert Systems with Applications, 2017, 88.
- T. Ojala, M. Pietikäinen, and D. Harwood.Performance evaluation of texture measures with classification based on Kullback discrimination of distributions”, Proceedings of the 12th IAPR International Conference on Pattern Recognition (ICPR 1994), vol. 1, 582 - 585.
- J. You and H. Cohen. Classification and segmentation of rotated and scaled textured images using texture “tuned” masks. Pattern Recognition, 1993, vol.26, pp.245-258.
- Zheng Hong and Zheng Zhaobao, “Robust Texture Feature Extraction Using Two Dimension Genetic Algorithms”, Signal Processing Proceedings, 2000. 21 Aug 2000-25 Aug 2000, Beijing, IEEE press, pp.1580-1584.
- Ye Z, Zheng Z, Zhang J, et al. Application of particle swarm optimization algorithm to image texture classification[J]. Proceedings of SPIE - The International Society for Optical Engineering, 2007, 6789(3):177-181.
- Zheng H, Zhang J, Nahavandi S. Learning to detect texture objects by artificial immune approaches. Future Generation Computer Systems, 2004, 20(7): 1197-1208.
- Wan Y, Wang M, Ye Z, et al. A “Tuned” Mask Learnt Approach Based on Gravitational Search Algorithm:[J]. Computational Intelligence and Neuroscience,2016,(2016-12-19), 2016, 2016(3):1-16.
- Yang, Xin-She. Bat algorithm for multi-objective optimization. International Journal of Bio-Inspired Computation, 2011, 3(5): 267-274.
- Bora T C, Coelho L D S, Lebensztajn L. Bat-Inspired Optimization Approach for the Brushless DC Wheel Motor Problem[J]. IEEE Transactions on Magnetics, 2012, 48(2):947-950.
- Yang X. Bat algorithm for multi-objective optimisation[J]. International Journal of Bio-Inspired Computation, 2011, 3(5):267-274 .
- Taha A M, Mustapha A, Chen S D. Naive Bayes-guided bat algorithm for feature selection.[J]. The Scientific World Journal,2013,(2013-12-14), 2013, 2013(3):325973.
- Adarsh B R, Raghunathan T, Jayabarathi T, et al. Economic dispatch using chaotic bat algorithm[J]. Energy, 2016, 96:666-675.
- Zheng F, Zecchin A, Newman J, et al. An Adaptive Convergence-Trajectory Controlled Ant Colony Optimization Algorithm with Application to Water Distribution System Design Problems[J]. IEEE Transactions on Evolutionary Computation, 2017, PP(99):1-1.
- Pan W T. A new Fruit Fly Optimization Algorithm: Taking the financial distress model as an example[J]. Knowledge-Based Systems, 2012, 26(2):69-74.
- Lin S W, Ying K C, Chen S C, et al. Particle swarm optimization for parameter determination and feature selection of support vector machines[J]. Expert Systems with Applications, 2008, 35(4):1817-1824.
- Maysam Toghraee, Hamid Parvin, Farhad Rad,"The Impact of Feature Selection on Meta-Heuristic Algorithms to Data Mining Methods", International Journal of Modern Education and Computer Science(IJMECS), Vol.8, No.10, pp.33-39, 2016.DOI: 10.5815/ijmecs.2016.10.05
- Tamirat Tagesse Takore, P. Rajesh Kumar, G. Lavanya Devi,"Robust Image Watermarking Scheme Using Population-Based Stochastic Optimization Technique", International Journal of Image, Graphics and Signal Processing(IJIGSP), Vol.9, No.7, pp.55-65, 2017.DOI: 10.5815/ijigsp.2017.07.06
- Dolly Choudhary,Ajay Kumar Singh,Shamik Tiwari,V P Shukla,"Performance Analysis of Texture Image Classification Using Wavelet Feature", IJIGSP, vol.5, no.1, pp.58-63, 2013.DOI: 10.5815/ijigsp.2013.01.08
- Kapil Sharma, Sanchi Girotra, "Parallel Bat Algorithm Using MapReduce Model", International Journal of Information Technology and Computer Science(IJITCS), Vol.9, No.11, pp.72-78, 2017. DOI: 10.5815/ijitcs.2017.11.08
- Rabiu O. Isah, Aliyu D. Usman, A. M. S. Tekanyi,"Medical Image Segmentation through Bat-Active Contour Algorithm", International Journal of Intelligent Systems and Applications(IJISA), Vol.9, No.1, pp.30-36, 2017. DOI: 10.5815/ijisa.2017.01.03
