Application of bird swarm algorithm for allocation of distributed generation in an Indian practical distribution network

Author: Sabarinath.G., T.Gowri Manohar
Journal: International Journal of Intelligent Systems and Applications @ijisa
Article in issue: 7 vol.11, 2019.
Free access
This article addresses an optimal allocation of multi Distributed Generation (DG) units in an Indian practical radial distribution network (RDN) for minimization of network loss and voltage deviation. For this work, combined sensitivity index (CSI) is utilized to identify the appropriate positions/locations of DG units. However, the appropriate size of DG is determined through a nature-inspired; population-based Bird Swarm Algorithm (BSA). Secondly, the influence of DG penetration level on network loss and voltage profile is investigated and presented. In this regard, two types of DG technologies (solar and biomass) are considered for loss reduction and voltage deviation reduction. The performance of CSI and BSA methodology is successfully evaluated on an Indian practical 52-bus RDN.
Bird swarm algorithm, Combined sensitivity index, Distributed generation, Distribution network, Power loss, Voltage deviation
Short address: https://sciup.org/15016609
IDR: 15016609 | DOI: 10.5815/ijisa.2019.07.06
Text of the scientific article Application of bird swarm algorithm for allocation of distributed generation in an Indian practical distribution network
Published Online July 2019 in MECS
Electric distribution network represents the final electrical connection between the power consumers and huge power supply system. The distribution network is a complex system and having about 70% of the total loss owing to the high value of R/X. Minimization of such high loss is a perplexing task for distribution firms. The major techniques of power loss minimization are capacitor placement, network re-configuration and DG placement [1]. From the past few years, DG placement is becoming a renowned area of research. Several types of DGs and their definitions have been discussed in [2]. DG is a lesser quantity power production that is directly fed to the load/distribution side rather than the transmission system [3]. It is also named as “dispersed generation”, “decentralized generation” or “embedded generation” [4]. DG is mainly classified [5] into two categories based on the type of fuel consumed renewable energy resource based DGs and non-renewable energy resource based DGs. A few years back, DG is modeled as an active power source only but now with advances in technology DGs exists in different kinds [6] such as:
Type-1 DG: generates active power only. For example photovoltaic, microturbines
Type-2 DG: generates reactive power. For instance synchronous condenser, capacitor
Type-3 DG: generates active and reactive power. The synchronous generator is the best example for it
Type-4 DG: injects real power and consumes reactive power. The induction generator is an example of it
Incorporation of DG into the distribution network (DN) facilitates several advantages [7] such as curtailed power loss, voltage magnitude enrichment and reduced financial investment on the expansion of the existing network and reduced emission. DG location significantly affects the performance of DN. Incorrect placement of DG may cause increased loss, operation and investment cost [8]. However, the appropriate DG placement helps in maximizing the technical, financial and environmental benefits from the DG.
The remaining sections of this paper are arranged as follows: Section II explains related work. Section III presents problem formulation and system constraints. Section IV and V discuss proposed CSI and BSA methods. Finally, sections VI and VII present experimental results and final conclusions, respectively.
-
II. Related Work
There are numerous analytical and optimization methods utilized in the literature. A 2/3 analytical method has been used in [9] by considering network loss minimization as an objective. According to this rule in a balanced DN, power loss minimization will be more, if the DG is placed at a distance of 2/3 from the feeder with a 2/3 size of DG. The main defect in this method is, it is suitable only for a balanced distribution system but not suitable for the unbalanced system. An analytical method was proposed by authors in [10] for optimal allocation (sizing and sitting) of time-varying DGs in radial as well as networked DNs with time-varying loads. An analytical method for minimization of power loss in DN by optimal placement and sizing using power stability index was proposed by authors in [11]. Simultaneous allocation of DG and the capacitor was proposed [12]. In [12] Sensitivity analysis is employed for optimal placement and analytical method is used for sizing.
Authors in [13] suggested a particle swarm optimization, artificial bee colony optimization [14] techniques for network loss reduction using optimal DG sitting. In [15], SOS (symbiotic organisms search) algorithm, Stud krill herd algorithm [16], grey wolf optimization [17] were employed for multi-DG allocation in radial DNs. Multiple DG placements under different load models using invasive weed optimization algorithm was proposed [18].
In this paper, a novel combined sensitivity index (CSI) based on both magnitude of load apparent power and voltage sensitivity is used to identify the optimal nodes for DG integration. However, the optimal DG size is calculated using a new population based BSA. Here, an objective function is modeled to minimize the network power loss.
I V m + 1 | 2 “ I V m | 2 — 2( R m , m + 1 X P m + X m , m + 1 X Q m )-
22 mm
... + ( R m , m + 1 + X m , m + 1 ) X . l2
, , | V m |2
C. DG Penetration Level
It is represented as given in (5)
DG pl =
KVA DGp x 1oo KVA Load
D. Voltage Deviation
Voltage deviation is calculated using (6).
Deviation
■^ I V rated - V j\
^
j = 1 rated
E. Voltage Limit
The magnitude of voltages of all buses should lie within the pre-specified range and is represented as^
min max
V j - V j - V j
Here, V™ = 0.9 pu and Vjmax = 1.1 pu
-
III. P roblem F ormulation and C onstraints
-
A. Mathematical Problem Formulation
To gain the considerable benefits from the DG, DG must be positioned at the appropriate bus/node with a suitable size. The main motive of this problem is to diminish the network loss. The sum of total network loss is considered as fitness function and is calculated as
P otalloss = min ^J' ( j , j + 1) (1)
j = 0
Where, nb=total number of nodes and
P loss (j, j + 1) =Real loss between jh node and (j+1)h node
-
B. Power Flow Constraints
Real power (2) and reactive power (3) flow in each branch and end bus voltage (4) is determined as follows
P m + 1 = P m + P DG
—
22 mm
P L , m + 1 R m , m + 1 . .2
| Vm |
Q m + 1 = Q m + Q DG — Q l , m + 1
—
22 mm m , m + 1 I у |2
| Vm |
-
IV. P roposed CSI
Optimal location of DG plays a vital role in voltage profile enhancement. Most researchers have used voltage sensitivity analysis and artificial intelligent techniques in the past to identify optimal locations for placement DG units. Many researchers and scientists have suggested sensitivity techniques based on power loss, voltage and a combination of both to solve optimal DG placement problem. In this work, proposed CSI [19] is employed to locate the most suitable nodes/buses to incorporate the DG units on an Indian practical 52-bus RDN. It mainly depends on
-
• Voltage sensitivity
-
• Apparent power of a connected load (KVA)
CSI (Sb) is mathematically modeled as follows nb
S b = E V k , b * KVA k +A Vb™^ (8)
k = 2
For K =2, 3, 4,…… nb
Note that bus ‘1’ is a reference bus or substation bus and nb is the maximum number of nodes in the system.
The maximum change in voltage magnitude ( A Vb max ) after the placement of DG unit is represented as follows:
max act base
A V b = max| V k, b - V k, ь |
Here, variables V k a b ct and V k b b ase are voltages at node ‘ b’ after and before placement of DG at node ‘k’, respectively.
The KVA magnitude of connected load at bus ‘ k ’ is calculated as follows:
KVA k = ( PL . ) 2 + ( QL k ) 2 (10)
Here, PL and QL are active power magnitude and reactive power magnitude of connected load at node ‘ k’ .
Importance of first term of (8) is that the buses with higher KVA loads should keep those node voltages at higher values as possible. Second term is the maximum voltage magnitude change due to DG placement. Ranking of buses in each feeder is obtained using (8). The value of Sb is calculated at each bus (except reference bus) by injecting active power of 10%, 20% and 30% of total active power. Bus with highest S b value should be selected as candidate bus to place DG unit. Top five sensitive buses in each feeder of an Indian practical 52-bus RDN are given in Table 1. As nodes 19, 24 and 50 are being on top in the priority list, they are selected as candidate nodes to place DG units.
Table 1. Ranking of buses
|
Rank of buses |
Feeder 1 |
Feeder 2 |
Feeder 3 |
||||||
|
DG power injection (% of TRPL) |
DG power injection (% of TRPL) |
DG power injection (% of TRPL) |
|||||||
|
10 |
20 |
30 |
10 |
20 |
30 |
10 |
20 |
30 |
|
|
1 |
19 |
19 |
19 |
24 |
24 |
24 |
50 |
50 |
50 |
|
2 |
18 |
18 |
18 |
26 |
26 |
26 |
52 |
52 |
52 |
|
3 |
17 |
17 |
17 |
23 |
23 |
23 |
51 |
51 |
51 |
|
4 |
15 |
15 |
15 |
31 |
31 |
31 |
49 |
49 |
49 |
|
5 |
14 |
14 |
14 |
25 |
25 |
25 |
48 |
44 |
48 |
-
V. B ird S warm A lgorithm
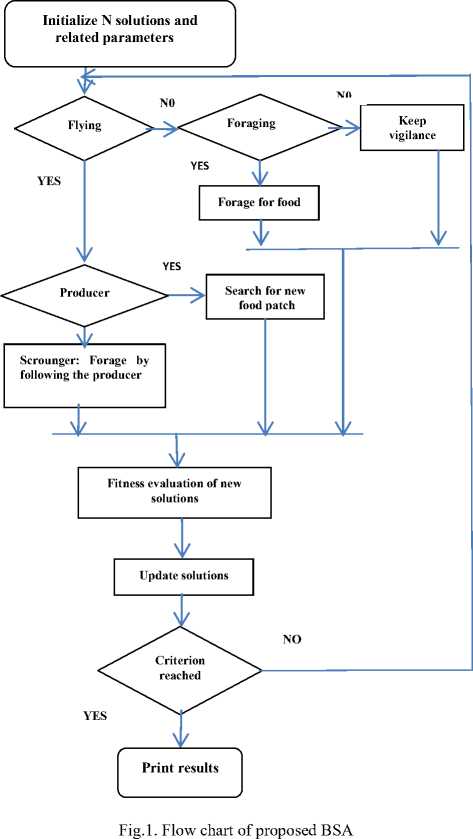
In this problem, Bird swarm algorithm (BSA) is used to determine the size/capacity of DG units. BSA [20] is a very recently (2015) developed, bio-inspired optimization technique. BSA is developed based on the intelligence observed in communication and social behavior of bird swarms. Basically, most of the birds exhibit three types of behaviors such as foraging, vigilance and flight behavior.
-
A. Foraging Behavior
All birds in the swarm quests for food based on its previous knowledge and swarms experience. These actions can be mathematically expressed as below:
X m + П = X t,. , n + (P m , n - < , n ) X C X rand(0,1)
.... + (g n - X tn , n ) X 5 X rand (0,1) (11)
In the above expression (11) rand(0,1) represents a randomly generated number between (0,1) and n e [1,2,.... D ]. 5 and C are respectively named as social accelerated and cognitive accelerated coefficients and both are positive numbers. P m,n is the previous best position of m th bird and g is the previous best position of a swarm.^
-
B. Vigilance Behavior
Each and every bird in the swarm tries and competes with the rest of the swarm to get a position in the middle of the swarm to safeguard themselves from the predators. Hence, each bird in the swarm would not move continuously towards the center. The mathematical representation of these motions is as follows:^
X m + n = X m , n + A 1( mean n - X m , n ) x rand (0л
.... + A2(Pq,n -xm,n) X rand(-1,1)
( PFit)
A1 = a1X exp I--x N I
I sumFit + e(
A 2 = a 2 x exp
( PFitm - PFita mq j | PFitq - PFitm \+e
N x PFita ) q_ sumFit + e 7
Where, q ( q * m ) is a randomly selected positive number between 1 and N. a1 and a2 are positive numbers in [0 2]. PFitm represents the mth bird’s best fitness value. sumFit denotes sum of the best fitness of all the birds in the swarm. e is a small number to eliminate zero-division error and meann represents nth bird average position.
-
C. Flight Behavior
While searching food the birds may travel from one location to other location due to predation threat or any other reason and once again at the arrived site they would forage for food. Some birds of the swarm called producers would quest for food patches while the rest of the swarm called scroungers try to forage the food patches identified by the producers. The mathematical representation of producer and scrounger behavior may be as follows:
X m'л = X m , n + randn (0,1) x X m , n (15)
X m + n = X m , n + ( X‘ q , n - X m , n ) x FL x rand (0,1) (16)
Here, randn(0,1) represents Gaussian distributed random value with 0 and 1, respectively as mean and standard deviation and FL represents the following factor. The flow chart of the proposed BSA is shown in Fig.1.^
STEP: 5 Find out the test system power loss for generated DG sizes
STEP: 6 Sort out DG size with lowest power loss
STEP: 7 Update DG sizes using expressions (11)-(16)
STEP: 8 Find out power loss for updated DG sizes
STEP: 9 Update current best DG size if the power loss obtained in step 8 is less than power loss obtained in step 5 otherwise moves to step 7.
STEP: 10 Stop if the criterion is satisfied
-
C. Implementation of BSA
The complete algorithm of the proposed method is as follows:
STEP: 1 Load test system line and load data to run power flow program.
STEP: 2 Find the most suitable bus in each feeder using the expression (8) to place DG
STEP: 3 Initialize population and other BSA parameters.
STEP: 4 Generate birds (DG sizes) using (17)
DGsize = ( DG max - DG ^i^ )*rand () + DG ^in (17)
-
VI. Experimental Results
In this article, minimization of network loss is taken as an objective and is reached by incorporating multiple DG units into the network. The suitable DG location and size are found out by CSI and BSA. The complete optimization program has been implemented and executed on MATLAB R2014a version installed in Intel Core i3, 4GB RAM HP laptop. Control parameters employed in the execution of proposed BSA are presented in Table 2 and are same for all cases.
Table 2. Control parameters of BSA
|
Parameter |
Value |
|
Number of birds |
30 |
|
Maximum iterations |
100 |
|
Cognitive accelerated coefficient |
1 |
|
Social accelerated coefficient |
1 |
|
Constants (a1 and a2) |
1.5 |
Table 3. Specifications of Indian practical 52-bus RDN
|
Base KVA |
Base KV |
Connected load |
Power loss |
||
|
KW |
KVAr |
KW |
KVAr |
||
|
1000 |
11 |
4184 |
2025 |
887.19 |
381.69 |
The BSA is being applied to 52-bus Indian practical RDN [21]. The detailed specifications of this test system which is portrayed in Fig. 2 [22] are given in Table 3 and Appendix A. This test RDN is an arrangement of three feeders consists of total 52 nodes and 51 branches. The uncompensated/base case system is experiencing a total network loss of (887.19+j381.69) KVA. By applying CSI approach bus 19, 24 and 50 are selected as candidate buses to incorporate three DG units. In this work, the following cases are analyzed.
Case 1: Three DG units injecting active power at unity power factor (P.F)
Case 2: Three DG units injecting active and reactive power at 0.9 P.F
Case 3: Three DG units injecting active and reactive power at 0.95 P.F
According to the ranks of nodes, top three nodes i.e. nodes 19, 24 and 50 are selected to place DG units. The numerical results of case 1,2 and 3 are tabulated in Table 4 in terms of optimal DG position, size, and penetration level, loss reduction, minimum voltage level and voltage deviations.
Table 4. Results of Indian practical 52-bus RDN
|
particulars |
Base case |
Case-1 |
Case-2 |
Case-3 |
|
Σ KW loss |
887.194 |
295.879 |
203.569 |
195.099 |
|
Σ KVAr loss |
381.699 |
127.297 |
87.582 |
83.938 |
|
DG size and location (KVA) |
0 |
696.95(19) |
775.175(19) |
780.859 |
|
500.00(24) |
500.00(24) |
500 |
||
|
1058.68(50) |
1170..877(50) |
1193.656 |
||
|
ΣDG penetration (%) |
0 |
48.526 |
52.622 |
53.235 |
|
Best power loss |
295.879 |
203.569 |
195.099 |
|
|
Average power loss |
295.927 |
203.664 |
195.213 |
|
|
Worst power loss |
296.052 |
204.080 |
195.608 |
|
|
Standard deviation |
0.06134 |
0.0348 |
0.0330 |
|
|
|Vmin| (p.u) |
0.6844 |
0.8923 |
0.9139 |
0.9166 |
|
Σ|Vdevi| |
8.5796 |
3.0545 |
2.0850 |
1.9976 |
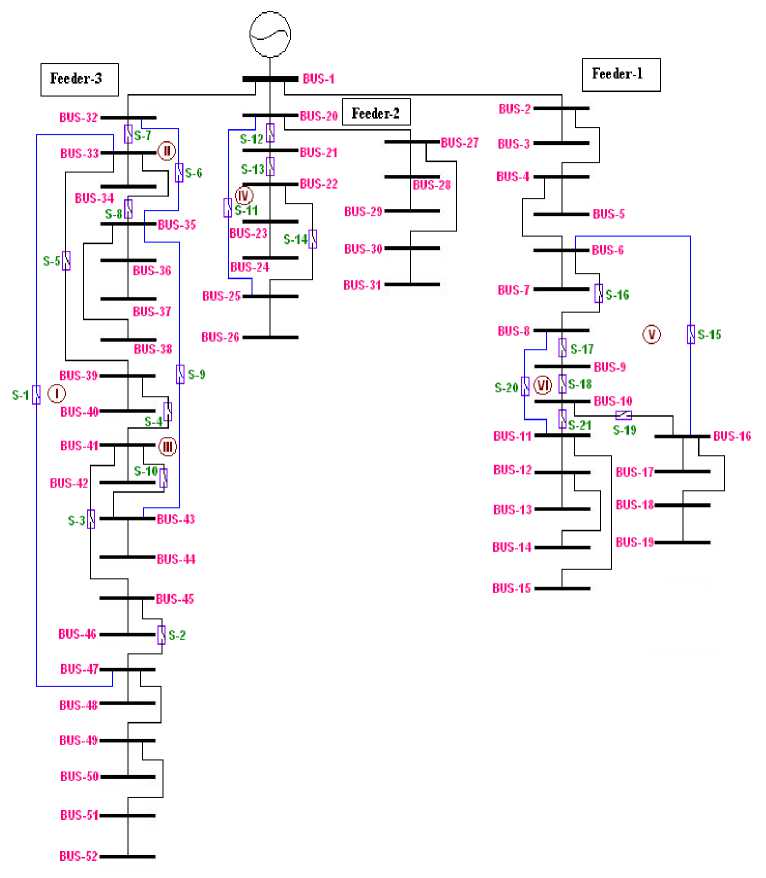
Fig.2. Single line diagram of Indian practical 52-bus RDN
In case 1, three DG units (Solar photovoltaic based) operating at unity P.F are placed at buses 19, 24 and 50. In this case, the active/real loss (ΣKW loss) is condensed from 887.194 KW to 295.879 KW (from table 4) and the minimum voltage (|Vmin|) level is improved to 0.8923p.u from 0.6844p.u. However, the total voltage deviation (Σ|Vdevi|) is reduced from 8.5796 to 3.0545. Three synchronous generator based DG units, supplying real and reactive power at 0.95 power factor are placed in case 2. With case 2, the real loss is abridged to 203.56 KW which is the smallest value as compared to case 1. The minimum voltage level and total voltage deviation, respectively, in this case, are 0.9139p.u and 2.085 that values are better than case.2. Now in case 3, synchronous generator based DG units injecting real and reactive power at 0.9 P.F are used. In this case injection of reactive power is increased as compared to case 2 which in turn results in more loss reduction with 195.09 KW. The minimum voltage (|Vmin|) level is improved to 0.9166p.u from 0.6844p.u. However, the total voltage deviation (Σ|Vdevi|) is reduced from 8.5796 to 1.9976.
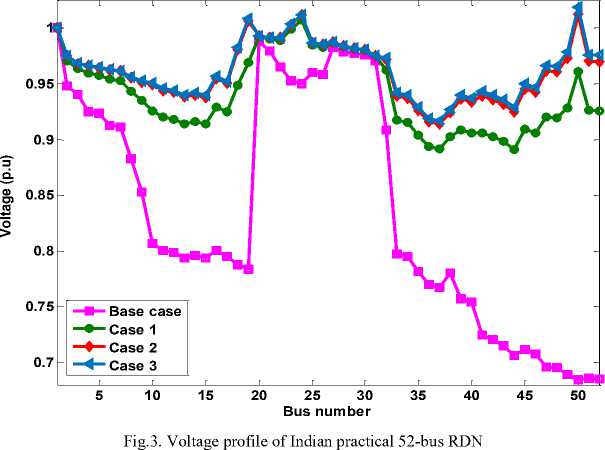
Maintaining all nodes of the distribution system within the specified voltage limit is one of the major concerns in electrical power systems. The voltage profiles of an Indian practical 52-bus distribution system before and after DG placement are portrayed in Fig. 3. Before installation of DG units (Base case), the minimum voltage in test system is 0.6844p.u (At node 50) and 32 nodes are not operating within the specified voltage limit.. However, with case 1, case 2 and case 3, the minimum voltage is improved to 0.8923p.u, 0.9139p.u and 0.9166p.u, respectively. With case 1, the nodes operating within the specified voltage limit are increased from 20 to 48. With case 2 and case 3, all nodes of the test system are brought within the specified voltage limit. However, total voltage deviation reduction is more in case 3 as compared to case 2.
-
VII. Conclusions
In this article, problem on optimal allocation of multi – distributed generation in an Indian practical 52-bus RDN has been solved. To minimize the search space in solving a problem, a novel sensitivity index called CSI has been used to identify the optimal nodes to place DG units. A nature inspired algorithm, Bird Swarm Algorithm, has been used to determine the optimal DG size. Two types of DG technologies (solar and biomass) operating at different power factors (1, 0.95, 0.9) are considered for power loss minimization and voltage profile enhancement. From the above obtained results, the following worth notes could be drawn.^
-
• By installing three type-1 (Solar) DG units at
64.39%.
nodes 19, 24 and 50, the active power loss is reduced by 66.65% and total voltage deviation by
-
• By installing three type-2 (Biomass) DG units operating at 0.95 P.F, the active power loss and total voltage deviation are reduced by 75.69% and 75.69%, respectively.
-
• By installing three type-2 (Biomass) DG units operating at 0.9 P.F, the active power loss and total voltage deviation are reduced by 78% and 76.71%, respectively.
-
• In case 1, case 2 and case 3, the minimum voltage level is improved from 0.6844p.u to 0.8923p.u, 0.9139p.u and 0.9166p.u, respectively
-
• From the above points, it is clear that as compared to other cases case-3 has been performed better in minimizing power loss and improving voltage profile.
37
35
38
0.0172
0.00740
68
33
38
33
39
0.0215
0.00925
95
46
39
39
40
0.0172
0.00740
108
52
40
39
41
0.0215
0.00925
41
20
41
41
42
0.0258
0.01110
95
46
42
41
43
0.0387
0.01665
27
13
43
43
44
0.0430
0.01850
122
59
44
41
45
0.0129
0.00555
108
52
45
45
46
0.0301
0.01295
81
39
46
45
47
0.0215
0.00925
68
33
47
47
48
0.0129
0.00555
41
20
48
47
49
0.0129
0.00555
68
33
49
49
50
0.0344
0.01480
81
39
50
49
51
0.0129
0.00555
108
52
51
51
52
0.0086
0.00370
41
20
Abbreviations and Acronyms
|
P totalloss |
Total real power loss |
KVA DG |
Apparent power of DG |
|
P m |
Real power flow from mth bus |
KVA Load |
Apparent power of load |
|
PL k |
Active power at node K |
QL k |
Reactive load at node K |
|
P m+1 |
Real power flow from (m+1)th bus |
V m |
Voltage of mth bus |
|
P DG |
Real power of DG |
V m+1 |
Voltage of (m+1)th bus |
|
P L,m+1 |
Real load of (m+1)th bus |
V rated |
Rated voltage |
|
Q m |
Reactive load of mth bus |
V j |
Voltage at bus j |
|
Q m+1 |
Reactive load of (m+1)th bus |
min |
Minimum voltage at bus j |
|
Q DG |
Reactive power of DG |
max |
Maximum voltage at bus j |
|
Q L,m+1 |
Reactive load of (m+1)th bus |
X m,m+1 |
Reactance of branch between m and (m+1) bus |
|
R m,m+1 |
Resistance of branch between m and (m+1) bus |
X(j) |
Reactance of branch j |
|
R(j) |
Resistance of branch j |
nb |
Number of buses |
Appendix A
Line and load data of an Indian practical 52-bus radial distribution network.
|
S. No. |
From bus |
To bus |
R (p.u) |
X (p.u) |
P (KW) |
Q (KVAr) |
|
1 |
1 |
2 |
0.0258 |
0.01110 |
81 |
39 |
|
2 |
2 |
3 |
0.0430 |
0.01850 |
135 |
65 |
|
3 |
2 |
4 |
0.0129 |
0.00555 |
108 |
52 |
|
4 |
4 |
5 |
0.0129 |
0.00555 |
108 |
52 |
|
5 |
4 |
6 |
0.0086 |
0.00370 |
27 |
13 |
|
6 |
6 |
7 |
0.0172 |
0.00740 |
54 |
26 |
|
7 |
6 |
8 |
0.0215 |
0.00925 |
135 |
65 |
|
8 |
8 |
9 |
0.0258 |
0.01110 |
81 |
39 |
|
9 |
9 |
10 |
0.0430 |
0.01850 |
67 |
32 |
|
10 |
10 |
11 |
0.0129 |
0.00555 |
27 |
13 |
|
11 |
11 |
12 |
0.0086 |
0.00370 |
27 |
13 |
|
12 |
11 |
13 |
0.0430 |
0.01850 |
108 |
52 |
|
13 |
12 |
14 |
0.0301 |
0.01295 |
54 |
26 |
|
14 |
12 |
15 |
0.0344 |
0.01480 |
94 |
45 |
|
15 |
10 |
16 |
0.0129 |
0.00555 |
67 |
33 |
|
16 |
16 |
17 |
0.0516 |
0.02220 |
67 |
33 |
|
17 |
16 |
18 |
0.0430 |
0.01850 |
108 |
52 |
|
18 |
18 |
19 |
0.0344 |
0.01480 |
81 |
39 |
|
19 |
1 |
20 |
0.0086 |
0.00370 |
108 |
52 |
|
20 |
20 |
21 |
0.0129 |
0.00555 |
94 |
46 |
|
21 |
21 |
22 |
0.0258 |
0.01110 |
81 |
39 |
|
22 |
22 |
23 |
0.0430 |
0.01850 |
108 |
52 |
|
23 |
23 |
24 |
0.0215 |
0.00925 |
108 |
52 |
|
24 |
22 |
25 |
0.0258 |
0.01110 |
102 |
50 |
|
25 |
25 |
26 |
0.0344 |
0.01480 |
41 |
20 |
|
26 |
20 |
27 |
0.0086 |
0.00370 |
108 |
52 |
|
27 |
27 |
28 |
0.0129 |
0.00555 |
162 |
79 |
|
28 |
28 |
29 |
0.0215 |
0.00925 |
68 |
33 |
|
29 |
27 |
30 |
0.0344 |
0.01480 |
68 |
33 |
|
30 |
30 |
31 |
0.0430 |
0.01850 |
95 |
46 |
|
31 |
1 |
32 |
0.0344 |
0.01480 |
41 |
20 |
|
32 |
32 |
33 |
0.0430 |
0.01850 |
121 |
59 |
|
33 |
33 |
34 |
0.0344 |
0.01480 |
41 |
20 |
|
34 |
33 |
35 |
0.0301 |
0.01295 |
41 |
20 |
|
35 |
35 |
36 |
0.0344 |
0.01480 |
135 |
66 |
|
36 |
36 |
37 |
0.0215 |
0.00925 |
81 |
40 |
References Application of bird swarm algorithm for allocation of distributed generation in an Indian practical distribution network
- G.Namachivayam,C.sankaralingam,S.K.Perumal,S.T.Devanathan, “Reconfiguration and capacitor placement of radial distribution systems by modifier flower pollination algorithm,” Electrical power components and systems,pp.1-11,2016.
- T. Ackermann, G. Anderson, and L. Soder., “Distributed generation: a definition,” Electric Power Systems Research, vol.57, pp.195–204, 2001.
- S.R.gampa,D.Das, “Optimum placement and sizing of DGs Considering average hourly variations of load,” Electrical power and energy systems, Vol.66,pp.25-45,2015.V.V.S.N.Murthy, A.Kumar, “mesh distribution system analysis in presence of distributed generation with time varying load model,” Electrical power and energy systems, Vol. 62,pp.836-854,2014.
- D. Q. Hung, N. Mithulananthan, R. C. Bansal, and S. Member, “Analytical Expressions for DG Allocation in Primary Distribution Networks,” IEEE Trans. On energy conversion, vol. 25, no. 3, pp. 814–820, 2010.
- P.Mehta, P.Bhatt, and V.Pandya, "Optimal selection of distributed generating units and its placement for voltage stability enhancement and energy loss minimization" Ain Shams Eng.Jour.,vol.9,pp.187-201,2018.
- M.Esmaeili, M.Sedighizadeh, M.esmili, "Multi-objective optimal reconfiguration and DG(Distributed Generation) power allocation in distribution networks using Big Bang-Big Crunch algorithm considering load uncertainty,"Energy, Vol.103,pp.86-99,2016.
- V. A. Evangelopoulos and P. S. Georgilakis, "Optimal distributed generation placement under uncertainties based on point estimate method embedded genetic algorithm," IET Generation, Transmission & Distribution, vol. 8, pp. 389-400, (2014).
- A.A.AloukiliM.A.Ei-Sharkawy, M.A.Attia, "Optimum sizing and sitting for DG units using Hybrid 2/3 rule and harmony search algorithm, "Int. Jour. Of Engineering works, Vol.5, pp.1-9, 2018.
- C.Wang, and M.H.Nehrir, "Analytical approaches for optimal placement of distributed generation sources in power systems,” IEEE Trans. on power systems, vol.19, pp.2068-2076, 2004.
- M.M.Aman, G.B.Jasmon, H.Mokhlis, and A.H.A.Bakar, "Optimal placement and sizing of a DG based on a new power stability index and line losses," Electrical power and energy systems,vol.43,pp.1296-1304,2012.
- S.G.Naik, D.K.Katod, and M.P.Sharma, "Optimal allocation of combined DG and capacitor for real power loss minimization in distribution networks," Electrical power and energy systems, vol.53,pp.967-973,2013.
- S.Kansal, V.Kumar, and B.Tyagi, "Optimal placement of different type of DG sources in distribution networks," Electrical power and energy systems, vol.53,pp.752-760,2013.
- F.S.A.Mouti, M.E.E.Hawary, "Optimal distributed generation allocation and sizing in distribution systems via artificial bee colony algorithm," IEEE Trans. on Power Delivery, vol.26,pp.2090-2101,2011.
- S. Saha and V. Mukherjee, “Optimal placement and sizing of DGs in RDS using chaos embedded SOS algorithm,” IET Gener. Transmission. Distrib., vol. 10, no. 14, pp. 3671–3680, Apr. 2016.
- S.A.C.Devi, L.Lakshminarasimman, R.Balamurugan," Stud Krill herd Algorithm for multiple DG placement and sizing in a radial distribution system," Eng. Sci. and Tech. an Int. Jour.,vol.20,pp.748-759,2017.
- U.Sultana, A.B.Khiriddin,A.S.Mokhtar,N. Zareen, B. Sultana, "Grey wolf optimizer based placement and sizing of multiple distributed generation in the distribution system, "Energy,pp.525-536,2016.
- D.R.Prabha, T.Jayabarathi, "Optimal placement and sizing of multiple distributed generating units in distribution networks by invasive weed optimization algorithm," Ain Shams Eng. Jour.,2015.
- S.R.Gampa, D.Das. “ Optimum placement and sizing of DGs considering average hourly variations of load," Electrical power and energy systems, Vol. 66,pp.25-40,2015.
- X.Meng, X.Z.Gao, L.Lu, Y.Liu, H. Zhang, "A new bio-inspired optimization algorithm: Bird Swarm Algorithm," Jour, of experimental & Theoretical artificial intelligence,2015.
- D.Thukaram, H.P.Khincha, H.P.Vijayanarasimha, “Artificial neural network and support vector machine approach for locating faults in radial distribution systems," IEEE Trans. On power del.,Vol.20,pp.710-721,2005
- P.Kayal,S.Chandra,C.K.Chandra, “Determination of voltage stability in distribution network using ANN technique,” Int. Jour. On Elec. Eng. And Inf., Vol.4,pp.347-360,2012.
