Application of GA for Optimal Location of FACTS Devices for Steady State Voltage Stability Enhancement of Power System

Author: Anju Gupta, P.R.Sharma
Journal: International Journal of Intelligent Systems and Applications(IJISA) @ijisa
Article in issue: 3 vol.6, 2014.
Free access
This paper presents a non traditional optimization technique, genetic algorithm to seek the optimal allocation, type and size of FACTS devices to control line flows, to maintain bus voltage to desired level and to minimize system losses. The targeted objectives are maximizing the static security margins and voltage stability while minimizing losses. Congestion management is also done by optimally placing FACTS controllers with line outage. Matlab coding has been developed for the purpose of simulation. Assessments are done on IEEE 30 bus system against different loading conditions with two FACTS devices SVC and TCSC implemented in steady state and the results verify the potency of propound algorithm to find the optimal location for power system stability.
FACTS, TCSC, SVC, Genetic
Short address: https://sciup.org/15010539
IDR: 15010539
Text of the scientific article Application of GA for Optimal Location of FACTS Devices for Steady State Voltage Stability Enhancement of Power System
Published Online February 2014 in MECS
The power electronics technology development gives good opportunities to design new power system equipment for power system stability. FACTS technology has become a very effective means to improve capacity of existing power transmission network without the necessity of adding new transmission lines. These devices control the power flow by reducing the power flow in overloaded lines and reduce line losses [1-3].
To achieve good performance of these devices it is important to ascertain their location because of their significant costs. Several methods are used for finding out the location of these devices in an integrated system but various complications are involved and also the results obtained are not optimal in some cases [4, 5]. The issue of optimal location of FACTS devices has been extensively brainstormed and several strategies have been proposed and implemented, but most of the research is based on the optimization of single objective like voltage stability, loss reduction or cost minimization [6-8]. Some of the researchers have factored in the cost of generator and the cost of installation of FACTS devices to reach at the total cost of the system [9]. Optimal location of FACTS devices for reducing the total cost has been discussed in [13].In [15] congestion management has been done by taking branch loading as objective function. In [16] a PSO based approach has been discussed to find the optimal location of FACTS devices to improve loadability and reduce the overall cost of installation. Different type of FACTS devices and their locations have different advantages, so the type, rating and location have to be determined simultaneously. This concurrent optimization can be done with genetic algorithm.
This paper presents a genetic based method to seek the type, rating and best location of FACTS controllers to maximize the branch loading and voltage stability reducing the overall system losses. Congestion, management is also done by optimally placing FACTS controllers.
-
II. Problem Formulation
-
2.1 Objective Functions
The stability problem is to optimize the steady state performance of a power system in terms of one or more objective functions while satisfying various equality and inequality constraints.
Voltage Level (VL):
This objective function takes voltage levels into account. For voltage levels between 0.9 to 1.1 p.u, the value of objective function is equal to 1.Outside this range, the value decreases exponentially with the voltage deviation [16].
f 1
VS = ^
exp
; if 0.9 < V b < 1.1 ( ц 1 1 - V b |) otherwise
Maximize branch loading
The objective function is associated with line loading and penalizes overloads in the lines. This term, called OVL is calculated for every line of the system. While the branch loading is less than 100%, its value is equal to 1: then it decreases exponentially with the line overloading. To speed up the convergence, the product of all objective functions is taken [15, 16]
These represent the system operating conditions such as generator voltage V G ;generator reactive power output Q G ;transformer tap T; switchable VAR compensations QC and load voltages VL.
V
min Gi
max Gi
Q Gi min≤Q Gi ≤ Q Gi max , i=1………….NG
min max
Branch
loading =X OVLe
line
Where 0.9≤T i ≤1.0
0.95
Where V Li is the voltages of all the load buses.
fl
OVL =^
exp X
P pq
P pq max
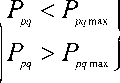
Where OVL is line overload factor.
Loss Minimization
The objective is to minimize the system losses [17]
nl
Pl = X gk^V i" + V 2 — 2VV j c°s( 5 i - S j } k = 1
-
2.2 Problem Constraints
Equality Constraint
These constraint represent load flow equations as
P Gi - P Di - V i^n^ V j [ Gy cos( 5 i - S j ) k = 1 (5)
+ B ij sin( S i - S j )] = 0
Q Gi - Q Di - Vi^n^V j [ G ij sin( S i - S j ) k = 1 (6)
+ B ij cos( S i - S j )] = 0
-
III. Proposed Algorithm
-
3.1 Encoding
The aim of the optimization is to find the best location of FACTS devices to optimize certain objectives. In this paper we use genetic algorithm optimization technique taking location, type and rating as variables. Genetic algorithms are computerized search optimization algorithm based on the theory of natural selection. An individual is represented with three strings of length. The first string represents the values of the devices. It can take discrete values between 0 and 1, 0 corresponding to the minimum value of the device and 1 to the maximum. According to the model of the FACTS, the real value of the device is calculated with the relation.
V REALF = V MINF + ( V MAXF – V MINF ) (7)
Where VMINF and VMAXF are respectively the minimum and maximum set value of the device, and is its normalized value. The second string is related to the kind of the devices. A value is given to each type of modeled device 1 for SVC, 2 for TCSC. The last string is the location of the devices. It denotes the numbers of the lines where the FACTS are to be placed.
GA starts with random generation of initial population and then the selection crossover and mutation are performed until the best solution is obtained. GA is practical algorithm and very easy to implement in a power system analysis. Various steps to be performed in Genetic Algorithm implementation are as follows.
Where i=1,2…………nb is the number of buses; P G and Q G are the generator real and reactive power respectively; P D and Q D are the real and reactive loads respectively, G ij and B ij are the transfer conductance and susceptance between bus i and bus j respectively.
Inequality Constraints
Initial population is generated through encoding. Three parameters are taken namely: the location, type and its rated value. Each individual is represented by N number of strings, where N is the number of FACTS devices to be required in the power system, as shown in Figure 1. Here N is 5.
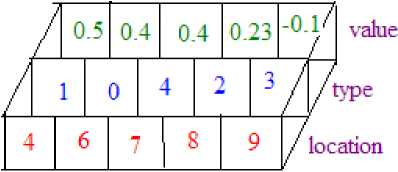
Fig. 1: Individual configuration of FACTS devices
The first string shows the no of lines where the device has to be placed. The second string shows the types of the devices. A value is given to each type of modeled FACTS device: 1 for SVC; 2 for TCSC and 3 for no FACTS device. The scope is always there to add new devices. The last value represents the rating of each FACTS device. This value is between –1 and +1. –1 corresponding to the minimum value that the device can take and 1 to the maximum.
TCSC:
By modifying the reactance of the transmission line, the TCSC acts as the capacitive or inductive compensation respectively. In this study, the reactance of the transmission line is adjusted by TCSC directly. The rating of TCSC is depends on the reactance of the transmission line where the TCSC is located:
X ij = X Line + X TCSC , X TCSC = rtcsc * X Line
Where XLine is the reactance of the transmission line where the TCSC is placed and rtcsc is the coefficient which represents the degree of compensation by TCSC. TCSC has a working range between - 0.7X Line and 0.2 X Line .
SVC:
The SVC can be operated as both inductive and capacitive compensation. It is modeled as an ideal reactive power injection at bus i. The value is between -100 MVAR to 100 MVAR.
∆Q=Q SVC (9)
-
3.2 Reproduction
-
3.3 Crossover
-
3.4 Mutation
The Objective function is calculated for each generation and the fitness value is calculated to find the fitness of each individual. The individual is selected to for the new generation based on fitness.
The crossover is done to rearrange the information of two individuals to produce new ones. Two point crossover is used here.
Mutation is used to introduce some sort of artificial diversification in the population to avoid premature convergence before the local minima.
-
IV. Simulation Results
Population Size: 40, maximum no of generations: 200, crossover probability: 0.95: mutation probability: 0.001: and elitism index: 0.15
Different operating conditions are simulated to check the validity of proposed algorithm to find out the optimal location. The study considers three cases, BL as objective, VS as objective and Loss minimization as objective with base case and 130% loading with and without FACTS.
Comparative analysis of results with base case is tabulated. Base case here refers to load flow solution without any optimization objective. Fifteen runs are performed and the results presented are the best out of 15.
Table 1: Objective Function values with 130% loading
|
Objective Function |
Base case |
130% loading with FACTS devices |
||
|
BL objective |
VS objective |
LM objective |
||
|
Branch Loading (BL) |
2537.32 |
2837.109 |
2289.215 |
2145.3538 |
|
Voltage Stability (VS) |
1310.25 |
1329.838 |
1389.583 |
1023.693 |
|
Loss minimization |
0.190 |
0.210 |
0.193 |
0.179 |
Table 1 indicates the objective function values for three objectives optimized individually for base load and 130% loading. It is clear that that with BL as objective the value has increased by 11.8% from base case and with VS as objective the Value of VS function has increased by 14.2% and with LM as objective LM function has reduced by 6%.
Application of GA for Optimal Location of
FACTS Devices for Steady State Voltage Stability Enhancement of Power System
-
4.1 Branch Loading Objective
Taking branch loading as the objective function the type, location and rating of TCSC and SVC is determined and the best solution obtained as shown in Table 2. Fig 2 and Fig 3 shows the graph of error Vs no. of generations and objective function value Vs no of generation .
Table 2: Optimized type, location and rating of FACTS devices for BL as objective at 130% loading loading
|
Type of device |
Location |
Rating |
|
SVC |
25 |
-0.005275 |
|
TCSC |
Line 40 |
-0.11868 |
Table 3: Lines to be overloaded with 130 % loading with and without FACTS
|
Line |
From |
To |
Spq in Base case |
Spq in 130% loading |
Spq After including FACTS devices |
Spq max Through lines |
Line loading in Base case |
Line loading with 130% loading |
Line loading after including FACTS devices |
|
No. |
Bus |
Bus |
|||||||
|
1 |
1 |
2 |
1.0944 |
1.6385 |
1.2356 |
1.3 |
84.183 |
126.036 |
95.046 |
|
2 |
1 |
3 |
0.4955 |
0.777 |
0.7682 |
1.3 |
38.117 |
59.7715 |
59.6655 |
|
3 |
2 |
4 |
0.3065 |
0.429 |
0.4194 |
0.65 |
47.1559 |
65.9961 |
66.1008 |
|
4 |
3 |
4 |
0.4597 |
0.7135 |
0.7121 |
1.3 |
35.3577 |
54.8819 |
54.7769 |
|
5 |
2 |
5 |
0.6062 |
0.8657 |
0.8524 |
1.3 |
46.6276 |
66.5947 |
66.5276 |
|
6 |
2 |
6 |
0.3857 |
0.5667 |
0.5592 |
0.65 |
59.3388 |
87.1786 |
87.579 |
|
7 |
4 |
6 |
0.3862 |
0.6189 |
0.6226 |
0.9 |
42.9084 |
68.7635 |
69.8429 |
|
8 |
5 |
7 |
0.1864 |
0.272 |
0.1616 |
0.7 |
26.6318 |
38.8503 |
37.7972 |
|
9 |
6 |
7 |
0.3577 |
0.4748 |
0.4675 |
1.3 |
27.5151 |
36.525 |
36.4473 |
|
10 |
6 |
8 |
0.1638 |
0.3551 |
0.3132 |
0.32 |
51.1727 |
110.97 |
97.875 |
|
11 |
6 |
9 |
0.1446 |
0.2328 |
0.2207 |
0.65 |
22.2527 |
35.8213 |
34.5275 |
|
12 |
6 |
10 |
0.1831 |
0.2391 |
0.1692 |
0.32 |
57.2275 |
74.713 |
72.1731 |
Table 3 indicates that the lines 1 and 10 are overloaded without the introduction of FACTS devices and the line loading has been decreased appreciably and power flow is also within limits with the optimal insertion of FACTS devices .
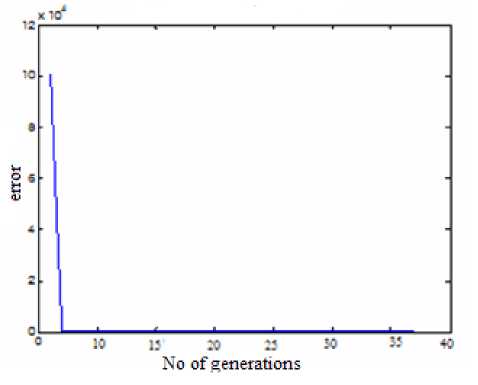
Fig. 2: Error Vs no. of generations
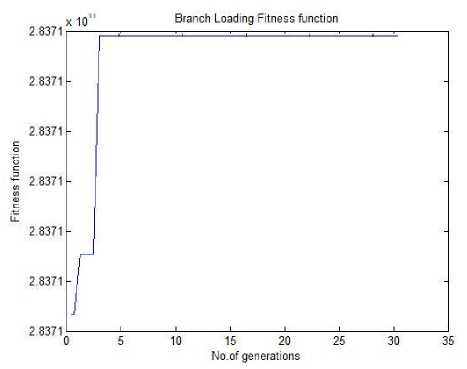
Fig. 3: Objective function Vs Generations
-
4.2 Line Outage
Line 5 outage
With the line 5outage is there, the lines 6 and 8 are loaded by 105.4285% and 117.7534% respectively. This overloading can be relieved by placing SVC at 11th bus with Bsvc of -0.375057 and three TCSC devices in lines 14,23 and 11 with XTCSC of -0.080656,-0.008245 and -0.024216 respectively. Table 4 shows the comparative analysis of objective function values with base case and with optimization. Fig 4 shows the error and generation graph and Fig 5 shows the graph between fitness value Vs generation.
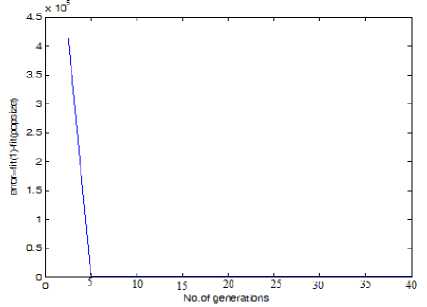
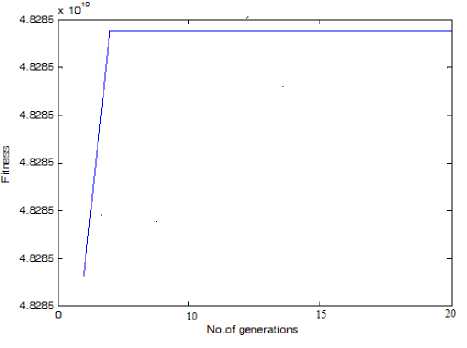
Fig. 5: Fitness Vs Generation with BL as objective
Fig. 4: Error Vs Generations with line 5 outage
Table 4: Comparison of objective function values when line 5 given outage with and without FACTS devices at 130% loading
|
Objective Function |
Base case |
130% loading with FACTS devices |
||
|
BL objective |
VS objective |
LM objective |
||
|
Branch Loading (BL) |
25.0162 |
482.06 |
486.112 |
483.393 |
|
Voltage Stability (VS) |
121.1703 |
242.7302 |
314.50 |
248.74 |
|
Loss minimization |
0.1691 |
0.170 |
0.170 |
0.167 |
Line 36 outage
When the line 36 given outage then lines 27, 30, 31 and 33 are loaded by 116.3357%, 103.8337%, 117.1324% and 127.7935% respectively. This overloading can be relieved by placing SVC at 1st bus with B svc of 0.244239 and two TCSC devices in lines 31
and 33 with X TCSC of -0.346388 and -0.325978 respectively. Table 5 shows the comparison of objective function values with base case and with optimization. Fig 6. shows the graph of fitness Vs generations with BL as objective.
Table 5: Comparison of objective function values when line 36 given outage with and without FACTS devices at 130% loading
|
Objective Function |
Line 36 is outage |
Line 36 outage with FACTS devices |
||
|
BL objective |
VS objective |
LM objective |
||
|
Branch Loading (BL) |
60.8893 |
621.8524 |
601.7279 |
612.98 |
|
Voltage Stability (VS) |
183.7809 |
302.0251 |
309.2734 |
295.91 |
|
Loss Minimization |
0.12553 |
0.128988 |
0.127814 |
0.1238 |
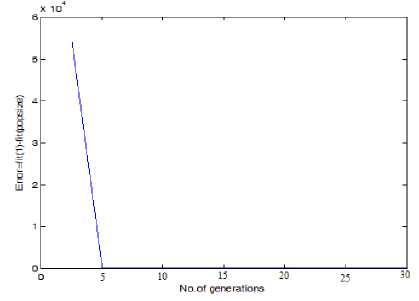
Fig. 6: Fitness Vs Generations
4.3 Voltage Stability as Objective
Taking voltage stability as the objective function the type, location and rating of TCSC and SVC is determined and the best solution obtained as shown in table 6. Fig 7 shows the graph of objective function and no of generation and Fig 8 indicates the graph of error of 1st and last generation and no of generations and with FACTS controller at optimal location. Table 7 shows the improvement in voltage profile of weak buses with the insertion of SVC at location 18 with rating -0.2668.
Table 6: Optimized type, location and rating of FACTS devices for VS as objective function at 130 % loading
|
Type of device |
Location |
Rating |
|
SVC |
18 |
-0.2668 |
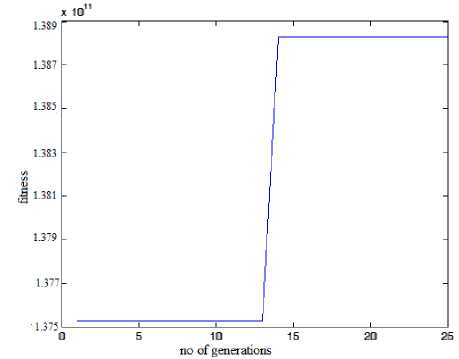
Fig. 7: Objective functions versus no of generation
Table 7: Voltage profile with FACTS
|
Bus No |
Without facts at 130%loading |
With TCSC and SVC at optimal location |
|
26 |
0.8921 |
0.95366 |
|
30 |
0.8902 |
0.95909 |
|
21 |
0.9171 |
0.978 |
Results indicate that by proper placement of FACTS devices, losses are reduced considerably.
Table 8: Power loss at 130 % loading
|
Active power loss without FACTS |
Reactive loss without FACTS |
Active loss with FACTS |
Reactive loss with FACTS |
|
0.181 |
0.495 |
0.179 |
0.4007 |
Table 9: Optimized type, location and rating of device at 130% loading with loss minimization as objective
|
Type of device |
Location |
Rating |
|
TCSC |
22 |
0.03387 |
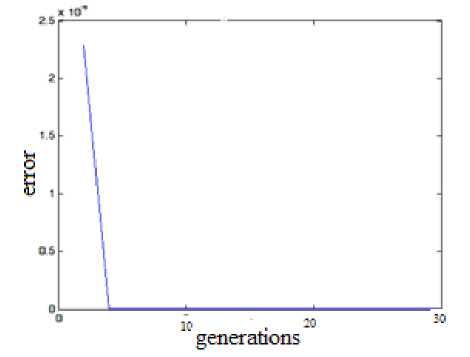
Fig. 9: Error Vs No of generation
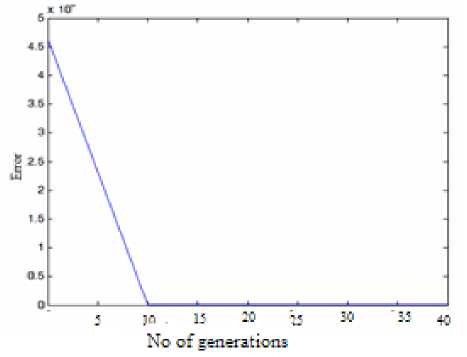
Fig. 8: Error versus no of generation for voltage Stability as objective
-
4.4 Loss Minimization as Objective
Taking Loss minimization as the objective function the type, location and rating of TCSC and SVC is determined and the best solution obtained as shown in table IX. Fig 9 shows the error between fitness value of 1st iteration and last iteration. Table VIII shows the active and reactive losses with FACTS controller.
-
V. Conclusion
Taking Loss minimization as the objective function the type, location and rating of TCSC and SVC is determined and the best solution obtained as shown in table IX. Fig 9 shows the error between fitness value of 1st iteration and last iteration. Table VIII shows the active and reactive losses with FACTS controller. Results indicate that by proper placement of FACTS devices, losses are reduced considerably.
Acknowledgments
The authors would like to thank the anonymous reviewers for their careful reading of this paper and for their helpful comments.
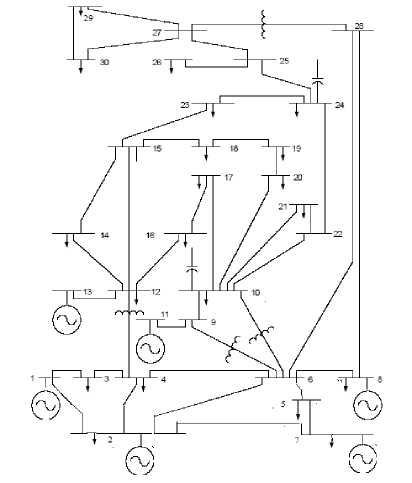
Fig 10: IEEE 30 bus system
References Application of GA for Optimal Location of FACTS Devices for Steady State Voltage Stability Enhancement of Power System
- D.J.Gotham and G.T.Heydt, “Power flow control and power flow studies for ystem with FACTS devices,” IEEE Tran. Power system vol 13, no 1,Feb 1998.
- M.Noroozian ,G,anderson, “Power Flow Control by use of controllable series component,”IEEE trans. Power Delivery,Vol 8,No 3,pp 1420-1429,july 1993.
- F.D.GaGaliana,K.Almeida,“Assesment and control of the impact of FACTS devices on power system performance ,”IEEE Tran. Power System,vol 11,No 4,pp 1931-1936,Nov 1991.
- S.N.Singh, A.K.David,“A new approach for placement of FACTS devices in open Power markets,”IEEE Power Engineering ,Vol 9,pp 58-60.
- C.T.T.Lie and W.Deng, “Optimal flexible AC transmission systems (FACTS) devices allocation,”Electrical power and energy Systems,vol 19,No 2,pp 125-134,1997.
- S.andA Gerbex,R Cherkaoui.J.Germond, “Optimal Location of multi- type FACTS devices by means of genetic algoritm,”IEEE Trans.Power system, vol 16,pp. 537-544,August 2001.
- J.Baskaran V.Palanisamy, “Optimal Location of FACTS device in a power system network considering power loss using genetic algorithm,”EE pub on lone journal, March 7, 2005.
- Pisica,C,Bulac,L Toma ,M,Eremia, “Optimal SVC Placement in Electric Power Systems Using a Genetic Algorithm Based Method,” IEEE Bucharest Power Tech Conference,2009
- Lijun Cai and Istvan Erlich, “Optimal Choice and Allocation of FACTS devices using Genetic Algorithm,” ISAP Intelligent systems applications to power systems 2003, Lemnos Greece, August31-september 3.
- N.P.Panday, “Artificial Intelligence and Intelligent Systems,” OXFORD university press, New Delhi, 2005.
- L.J.Cai, I.Erlich, G.Stamtsis, “Optimal Choice and Allocation of FACTS Devices in Deregulated Electricity Market using Genetic Algorithms,” IEEE conference 2004(103).
- El Metwally, M.M, El Emary,A.A.,El Bendary, F.M, “Optimal allocation of FACTS devices using genetic algorithm,”IEEE Power system conference, 2008, MEPCON 2008,pp 1-4.
- Tiwari, P.K, Sood, Y.R, “Optimal Location of FACTS devices in power system using genetic Algorithm,” Nature & Biologically Inspired Computing, 2009. NaBIC 2009. World Congress on, pp 1034-1040.
- Singh, D.Verma, K.S, “GA based congestion management in deregulated power system using FACTS devices,” Utility Exhibition on Power and Energy Systems: Issues & Prospects for Asia (ICUE), 2011 International Conference, pp 1-6.
- Keshi Reddy Saidi Reddy, Narayan Prasad Padhy, Patel, R.N (2006), “Congestion management in Deregulated Power System using FACTS Devices,” International conference on IEEE Power India,2006
- Saravanan, M., Slochanal, S.M.R.,Venkatesh, P.,Abraham, P.S, “Application of PSO technique for optimal location of FACTS devices considering system loadability and cost of installation,” The 7th International Power Engineering Conference, 2005. IPEC 2005, pp 716 - 721 Vol. 2.
