Application of hyperspectral remote sensing in the detection of marine oil spill

Author: Suriguga , Yulong Bao , Yuhai Bao , Erdemtu Jin
Journal: Природа Внутренней Азии @nature-inner-asia
Section: География
Article in issue: 4 (13), 2019.
Free access
The article presents the application of Hyperion hyperspectral data for conducting oil film detection in the Gulf of Mexico after marine oil spill accident. Data dimension reduction was performed by the Minimum Noise Fraction Method, the endmember was extracted by the Pure Pixel Index (PPI) method. Spectral Angle Mapping (SAM) and Support Vector Machine (SVM) were used to classify and verify data. The results show that the classification accuracy of SVM method is higher than that of SAM method, and the result is closer to the distribution of oil film, while the accuracy of SVM method based on Polynomial kernel function is higher than that of SVM method based on RBF kernel function, and offshore oil film identification is better.
Oil film, hyperion, spectral angle mapping, support vector machine
Short address: https://sciup.org/148318035
IDR: 148318035 | UDC: 504.4.054 | DOI: 10.18101/2542-0623-2019-4-93-99
Применение гиперспектрального дистанционного зондирования в обнаружении разливов морской нефти на поверхности моря
В статье описано использование гиперспектральных данных Hyperion для обнаружения нефтяной пленки, образовавшейся в результате аварии на нефтяной платформе в Мексиканском заливе. Сокращение данных было выполнено методом минимальной доли шума, конечный элемент был извлечен методом индекса чистых пикселей (PPI). Для классификации и проверки использовались картирование по спектральному углу (SAM) и метод опорных векторов (SVM). Результаты показывают, что точность классификации метода SVM выше, чем метода SAM, и результат лучше отражает распределение нефтяной пленки. В то же время точность метода SVM, основанного на полиномиальной функции ядра, выше, чем метода SVM, основанного на функции ядра RBF, что позволяет лучше идентифицировать нефтяную пленку на поверхности моря.
Text of the scientific article Application of hyperspectral remote sensing in the detection of marine oil spill
In recent years, with the development of offshore oil exploration and marine transportation, marine oil pollution has been increasing [Zhu Xi, 2015]. In 1985, the National Research Association of the United States investigated the amount of oil that discharged into the ocean by various means each year. The results show that the oil content produced by offshore oil leakage was about 5 times as much as that of offshore mining. Oil pollution has exceeded the self-purification ability of seawater in the marine oil production area and the shipping lanes, which has caused physical, chemical and ecological changes in the sea surface conditions. Therefore, remote sensing monitoring of oil pollution has received increasing attention [Yuzhou Zhang et al., 2013].
At present, domestic and foreign researchers mainly use multi-band optical sensors and SAR sensors mounted on airborne and spaceborne platforms to monitor oil spill. The oil spill targets are distinguished according to the difference of spectral characteristics between the oil spill targets and the surrounding environment [Yuzhou Zhang et al., 2013]. However, traditional remote sensing monitoring is affected by climate conditions, weathering and false targets, and it is difficult to accurately detect the position of oil spill, type and thickness of oil film [Yuzhou Zhang et al., 2013; Weiguang SU et al., 2012]. Hyperspectral remote sensing has become a frontier technology in the field of remote sensing application because of its high spectral resolution and large amount of data information [Li Ying et al., 2012]. It can obtain a large number of nearly continuous narrow-band spectral information in the visible, near-infrared, mid-infrared and thermal infrared bands, which can not only distinguish oil film from water, but also infer the type and time of leaked oil according to the difference of spectral absorption characteristics of oil film in different oil species and different periods, so as to realize target detection and recognition based on the spectral characteristics of ground objects [He Ying et al., 2011].
Therefore, this paper uses Hyperion hyperspectral data to classify and extract oil spill information by Spectral Angle Mapping and Support Vector Machine for oil spill in the Gulf of Mexico.
Materials and Methods
Remote Sensing Data
The study area is located in the gulf of Mexico area about 80 km southeast of Louisiana (about 85°–90°W, 27°–30°N), which is rich in oil and natural gas and is one of the important crude oil producing areas [Jinbiao Fang, 2014]. On April 20, 2010, the Deepwater Horizon, a drilling rig rented by BP in the Gulf of Mexico, exploded, causing a massive oil spill and an economic and environmental tragedy [Guoxin Lan, 2012]. The U. S. government has confirmed that the spill is the «worst spill» in U.S. history, surpassing the 1989 Exxon Valdez oil spill in Alaska.
Table 1
Description of Hyperion L1 products
|
project |
parameter |
|
Wavelength range |
356 ~ 2577 nm |
|
Number of bands |
242 |
|
Cell size |
30m |
|
Image size |
256 × 6460 |
|
Data format |
16bit symbol integer |
|
VNIR |
1 ~ 70 |
|
SWIR |
71 ~ 242 |
|
Pixel format |
BIL |
|
Byte order |
Network(IEEE) |
|
File size |
800 M |
The Hyperion sensor on the EO-1 satellite has a spectral range from 356 nm to 2577 nm with a total of 242 bands [Bingxiang Tan et al., 2005]. The characteristics of this product is shown in Table 1. The study obtained the Hyperion data for the April 2010 in the Gulf of Mexico region, which has undergone geometric correction and radiation correction [Yingcheng Lu et al., 2009]. The preprocessing of Hyperion data includes atmospheric correction and conversion of surface reflectivity.
Methods
Data Dimension Reduction and Endmember Extraction
Hyperspectral data has the characteristics of multi-band, high spectral resolution and continuous spectrum. It also leads to the problems of information redundancy, complex data processing and lower operation efficiency, while providing rich spectral information [Maozhi Wang et al., 2015]. Therefore, it is necessary to conduct data dimensionality reduction on hyperspectral data [Bingxin Liu, 2013]. In this study, the Minimum Noise Fraction Transform was used for data dimensionality reduction, and it was performed in the Transform function of ENVI5.1.
Endmember extraction is the basis for obtaining and analyzing hyperspectral information, and also the key for solving the decomposition of mixed pixels in hyperspectral images [Maozhi Wang et al., 2015]. In this paper, an endmember extraction method based on the pure pixel index is adopted to obtain the image endmember and to identify the offshore oil film.
Spectral Angle Mapping
Spectral Angle Mapping is an interactive classification method that matches the image spectrum to the reference spectrum [Bingxin Liu, 2013]. The SAM method takes full account of spectral dimension information of hyperspectral data, highlights spectral shape features, treats the spectral data as a space vector, and the total number of bands is the latitude of the vector [Bingxin Liu, 2013]. The SAM method compares the reference spectrum and each pixel vector to an n-dimensional space. The smaller the angle, the better the matching effect between the pixel and the reference spectrum.
The reference spectrum is defined as Ri, the test spectrum is defined as Ti, n is the number of bands, and the angle between the two spectra is defined as Φ. The generalized angle Φ between them can be obtained by the following formula [Bingxin Liu, 2013]:
( 1 )
Support Vector Machine
Support vector machine is a machine learning method based on statistical learning theory. Its goal is to construct an objective function according to the principle of structural risk minimization to distinguish the two categories as much as possible. Generally, there are two cases of linear separability and linear inseparability [Wang Jing, 2013]. For the case of linear inseparability, Vapnik et al. proposed to use a kernel function instead of the inner product to achieve nonlinear classification [Wang Jing, 2013]. Polynomial kernel function, Radial Basis kernel function and Sigmoid kernel function are common [Wang Jing, 2013]. The kernel functions of SVM classifier are used in this paper including Polynomial kernel function and Radial Basis kernel function.
The expression of the Polynomial kernel function:
K(х, у) = [(х ■ у) + l]d ( 2 )
The expression of the Radial Basis kernel function:
K(x, у■) = ^[-^1 (3)
Results
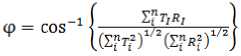
In the study, SAM classification method and SVM classification method were used to classify the Hyperion hyperspectral images corresponding to the Gulf of Mexico oil spill in April 2010 and extract the offshore oil spill information. The kernel function of the SVM classifier selected the Polynomial kernel function and the Radial Basis kernel function. The results based on the three classification methods are shown in Figures 2, 3 and 4. Figure 1 is the Hyperion image of the study area, Figure 2 is the oil film extraction result based on SAM classification method, Figure 3 is the oil film extraction result of SVM classification method based on RBF kernel function, and Figure 4 is the oil film extraction result of SVM classification method based on Polynomial kernel function. The classification results show that the thick oil film is red, the middle oil film is green, the thin oil film is blue, the sheen oil film is yellow, and the sea water is cyan. By comparing the extraction results of the three classification methods with hyperspectral images through visual interpretation, it can be seen that the three classification methods have better extracted the oil film information, which basically conform to the oil film distribution displayed in Hyperion hyperspectral image.
In order to evaluate the results of the above three classification methods and determine the accuracy and reliability of the classification, confusion matrix was used for evaluation in this paper.
The confusion matrix is used to compare the classification results with the real information of the surface, and the accuracy of the classification results can be shown in the confusion matrix. In this study, the Overall Accuracy and Kappa Coefficient were selected from the confusion matrix to evaluate the accuracy of the three classification methods and to compare their applicability in identifying marine oil film.
The training samples were selected on the Hyperion hyperspectral image for verification by visual interpretation, and five kinds of samples were selected respectively: thick oil film, middle oil film, thin oil film, sheen oil film and seawater. The selected verification sample is shown in Figure 5, and its corresponding feature type is shown in Figure 6. Input the classification results obtained by the three classification methods and the ROI of the verified samples, and the software will automatically match the regions to get the accuracy report of the classification results (see Table 2).
In terms of Overall Accuracy, the value of SVM classification based on Polynomial kernel function is the highest, the value of SVM classification based on RBF kernel function is second, and the classification based on SAM shows the lowest value — 92.15%, 86.39% and 74.53% respectively. Similarly, Kappa coefficient also shows that the SVM classification based on Polynomial kernel function is the largest, followed by the SVM classification based on RBF kernel function, and the SAM classification is the smallest, which is 0.863, 0.822, and 0.751 respectively.
Suriguga, Yulong Bao, Yuhai Bao, Erdemtu Jin. Application of Hyperspectral Remote Sensing in the Detection of Marine Oil Spill —
In conclusion, the Support Vector Machine method has higher accuracy than the Spectral Angle Mapping method, and the classification result is closer to the distribution of ground objects, which is more suitable for marine oil spill detection; while the SVM classification based on Polynomial kernel function is more accurate than the SVM classification based on RBF kernel function, and the results are closer to the distribution of offshore oil films.
Table 2
Accuracy evaluation results
|
SVM |
classification |
SVM classification |
SAM |
|
|
based |
on RBF |
based on Polynomial |
classification |
|
|
kernel function |
kernel function |
method |
||
|
Overall |
86.39% |
92.15% |
74.53% |
|
|
Accuracy Kappa Coefficient |
0.822 |
0.863 |
0.751 |
|
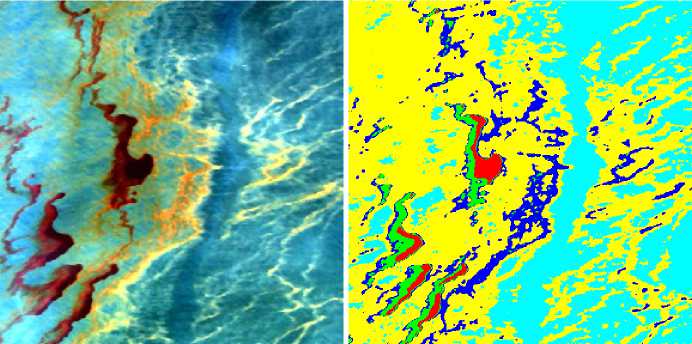
Fig. 1. Hyperion hyperspectral image Fig. 2. The result based on the SAM classification
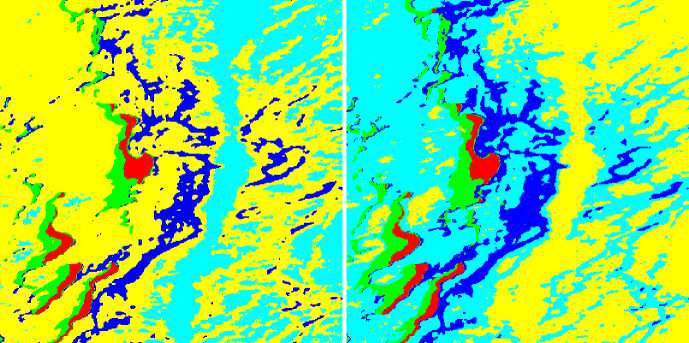
Fig. 3. The result of SVM classification based Fig. 4. The result of SVM classification based on on RBF kernel function Polynomial kernel function
Fig. 5. Selection of training samples
Fig. 6. Types of features represented by region of interest
Conclusions
In this paper, Hyperion hyperspectral data was used to classify and extract the oil spill information in the Gulf of Mexico by three methods: the SAM classification, the SVM classification based on Polynomial kernel function and the SVM classification based on RBF kernel function. The results of accuracy evaluation of the three classification methods show that the Support Vector Machine method has higher accuracy than the Spectral Angle Mapping method, and the classification result is closer to the distribution of ground objects, which is more suitable for marine oil spill detection; while the SVM classification based on Polynomial kernel function is more accurate than the SVM classification based on RBF kernel function, and the results are closer to the distribution of offshore oil films.
References Application of hyperspectral remote sensing in the detection of marine oil spill
- Bingxin Liu. Extraction and Analysis of Oil Film on Water using Hyperspectral Characteristics. Dalian Maritime University, 2013.
- Bingxiang Tan, Zengyuan Li, Erxue Chen, et al. Preprocessing of EO-1 Hyperion Hyperspectral Data // Remote Sensing Information. 2005. No. 6. Pp. 36-41.
- Guoxin Lan. Research on Remote Sensing Spectral Information Mining and Application of Marine Oil Spill. Dalian Maritime University, 2012.
- He Ying. Research on Marine Oil Spills Monitoring Using Hyper-spectral Romote Sensing. Dalian Maritime University, 2011.
- Haiyan Bao. Research on Classification Algorithm of Hyperspectral Oil Spill image. Dalian Maritime University, 2011.
- Jin Wei. Oil Spill Monitoring Based on Its Spectral Characteristics. Dalian Maritime University, 2008.
- Jinbiao Fang. Research and Construction of Offshore Oil Film Detection system. Dalian Maritime University, 2014.
- Li Ying, Bingxin Liu, Chen Yu. Study Advancement in Oil Spill Monitoring Using Hyperspectral Remote Sensing // Marine Environmental Science. 2012. No. 3. Pp. 460-464.
- Maozhi Wang, Wenzhao Xu, Wang Wei, et al. Research Progress on Endmember Extraction Algorithm and Its Classification of Hyperspectral Remote Sensing Imagery. Remote Sensing Technology and Applications. 2015. No. 4. Pp. 616-625.
- Wang Jing. Extraction Oil Spill Information from Optical Remote Sensing Image Using Multiple Characteristics. Beijing: China University of Geosciences, 2013.
- Weiguang Su, Fenzhen Su, Chenghu Zhou, Yunyan Du. Optical Satellite Remote Sensing Capabilities Analysis of the Marine Oil Spill // Journal of Earth Sciences. 2012. No. 14(04). Pp. 523-530.
- Yuzhou Zhang, Zhili Chen, Tangao Hu, et al. Status and Trends of Remote Sensing Technology to Monitor Marine Oil Spill // Journal of Hangzhou Normal University (Natural Science Edition). 2013. No. 1. Pp. 81-88.
- Yingcheng Lu, Qingjiu Tian, Pengfei Song. Study on Extraction Methods of Offshore Oil Stick by Hyperspectral Remote Sensing. 2009. No. 13(4). Pp. 691-695.
- Zhu Xi. Discussion on Marine Oil Spill Pollution and Prevention. Collection of Academic Papers of China Marine Society in 2015 / China Marine Society. 2015. No. 3.
