Application of Neural Network on Burr Expert System in Micro-machining

Author: Yun-Ming Zhu, Jun-Ping Chen, Gang Zheng
Journal: International Journal of Intelligent Systems and Applications(IJISA) @ijisa
Article in issue: 1 vol.3, 2011.
Free access
The demands placed by designers on workpiece performance and functionality are increasing rapidly. Important aspects of manufacturing’s contribution to the fulfillment of these demands are the conditions at the work piece edges. However, Burrs are often created on the workpiece edges in micro-machining. In many cases, time consuming and expensive deburring processes have to be applied in order to ensure the desired part functionality. Burrs make troubles on production lines in terms of deburring cost, quality of products and cutting tool wear. To prevent problems caused by burrs in micro-machining, prediction and control of burr size is desirable. Experimental studies show that burr formation in micro-milling is a highly complex process depending on a number of parameters such as material properties, tool geometry and cutting parameters. It is very difficult to establish the relationship between burr sizes and cutting conditions. A web-based micro-machining burr expert system for burr sizes prediction and control was developed using ASP.NET platform. Burrs types and sizes prediction and cutting conditions optimization for burr controlling which based on the reasoning method of BP neural networks are realized. Operation results show that the system is reliable. It provides a new technology for burrs modelling and controlling.
Burr expert system, neural network, micro-machining, burr prediction, edge quality
Short address: https://sciup.org/15010151
IDR: 15010151
Text of the scientific article Application of Neural Network on Burr Expert System in Micro-machining
Published Online February 2011 in MECS
With the development of manufacture technologies toward miniaturization, high accuracy and lightweight, micro/nano machining technology has become more and more important. Various problems such as surface defects, poor edge finish, and burrs in conventional machining have plagued conventional manufacturing for some time. Some of these problems have been avoided by post processing and process optimization. These problems are also significant in micro-machining and require much more attention, because, in many cases, inherent material characteristics or limitations in part geometry do not allow some of the solutions used in micro-machining.
Increasing demands on function and performance call for burr-free workpiece edges after machining. However, burrs formed on workpiece edges is a normal phenomenon. Fig.1(a) shows the micro-milling principle and burrs formed on the workpiece edges. Fig. 1(b) shows the exit burr formed on the exit surface in drilling moderately ductile material like stainless steel. Burrs make troubles on production lines in terms of deburring cost, quality of products and automation. Burrs controlling and deburring technology have become one of the main factors that restricting the development of the precision and ultra-precision machining, flexible manufacturing system and automation machining technology[1].
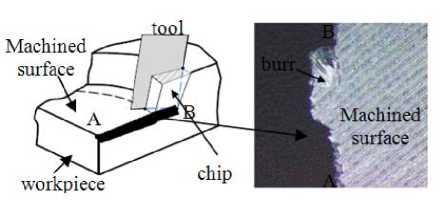
( a ) Burrs formed on workpiece edge in milling
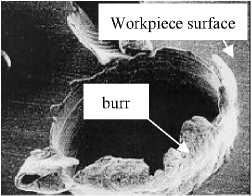
(b) Burrs formed on workpiece edge in drilling
Figure 2. Burrs formed on workpiece edge
Since deburring is a costly and non-value-added operation, the understanding and control of burr formation is a research topic with high relevance to industrial applications. Up to now, there are some research reports and publications on the forming principle of the cutting burr and deburring technology [26]. But a majority of the research concentrates in the aspect of burr forming principle by experimental method. However, very little work have been done in the area of analytical modeling for burr formation. A detailed analytical model was proposed by Sofronas[7,8] to determine drill geometries and drilling conditions which reduce the burr height and thickness. S.L.Ko[9] proposed a quantitative model of burr formation for orthogonal machining based on negative shear angle. S.Kumar[10] analysed the impact of geometrical factors in face milling process and accordingly predicted the location of burr formation. Wang[11] established a mathematical-mechanical model of two side-direction burr formation and translation in orthogonal cutting, burr type prediction was achieved. Although efforts were expended in trying to find the relation between cutting conditions and burr formation, models obtained are far from optimal since the cutting conditions has been simplified. Moreover, there has no model that has been obtained to establish the relation between burr sizes and cutting parameters.
Research also focused on burrs controlling, Kumar[12] proposed the EOS method based on the kinematics of insert or cutting tooth at the edge to control burr formation. Kim[13] used the control charts and Bayes theory to identify process parameters that would control the burr size which could then be easily removed by deburring. Chu[14] designed special tool path schemes and tool geometry for minimization of burrs based on avoiding tool exits. In fact, establishing efficient and accurate burr prediction models can provide technical methods for cutting parameters optimization so as to controlling burr forming. There are lots of factors influencing the forming of metal cutting burr, which influence and restrict each other. The shape and size of cutting burr lie mainly on the integrative effect of material character of the workpiece, geometrical parameters of the machine tool, cutting parameters, cutting mode and the terminal supporting inflexibility of the workpiece, etc. Cutting burr prediction is a complex and difficult task since a large number of factors ranging from cutting conditions to materials are involved. Experimental approach is essential to understand the burr formation. However, previous research produced a lot of experimental data. It is beneficial to construct a tool based on available experimental data to predict and control the burr formation.
In this research, artificial intelligence techniques were used. Artificial neural network (ANN) can mode a system with unknown input-output relation using a number of examples observed from experiment. Back-propagation (BP) neural network has been employed to develop the system. A web-based expert system for micro-machining burrs prediction and control has been developed utilize BP neural network. Finally, system is validated by micro-machining burrs prediction and controlling.
-
II. Operation Mechanism of Web-based Expert System
The web-based expert system for micro-machining burr was developed based on ASP.NET platform. It adopts the structure of Browser/Server. Web pages that can access web server database are designed using ASP.NET. Users can operate the database through these web pages. Users demands are sent to web server database by a series of web pages. After receiving the instruction including users demands, the system operates the database and transfers results back to web server. The information is treated by web server and returned to web browser. The operation mechanism of the web-based system is shown in Fig.2.
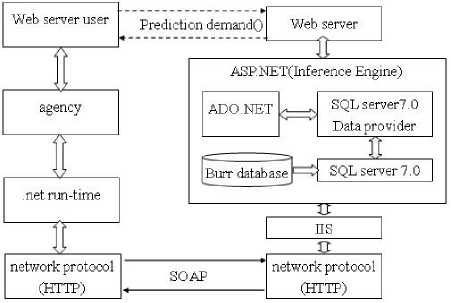
Figure 2. The structure of burrs expert system
The system can run on multi-platform with the use of Browser/Server structure compared to Client/Server application program. Clients can access the system using uniform browser. It is easy to operation for users. Also, the cost of maintenance is very low. ASP.NET is a Object-Oriented system based on the frame of .NET which adopts compilation language, such as VB > C# which has formidable class base. It provides lots of programming resources and various service supporting for developer. It greatly enhances the capability of safety guarantee and the ability of implementation between different platforms.
Three main functions including member authentication and registration, burr database management and burr prediction are realized by webbased expert system.
-
A. Member Authentication and Registration
According to guarantee the reliability and security of burrs database, database management is operated by administrators. So, member authentication is needed. Also, system provides a way for member registration so as to add more experiment data into the database. These functions are achieved by setting the DestinationPageUrl properties of login control which included in ASP.NET 2.0 membership frame.
-
B. Burrs Database Management
-
C. Burrs Prediction and Controlling
Appropriate inference mechanism is to make reasoning according to user input conditions (cutting mode, burr classification and cutting conditions). The inference implored here is based on BP neural network learning mechanism. Burrs sizes to be formed under these conditions are predicted. Optimized cutting parameters can be recommended under anticipant burr sizes which acted as the input of the system.
Fig.3 shows the structure of the system. First, user input conditions are compared to the data that existed in burr database. There would be two different results, (i) user input conditions are same to the experiment data existed in system database, or (ii) user input conditions are different to existed data. System executes the query of the database under first circumstance. Otherwise, training is done by use of neural network after system selected corresponding samples. Mapping relations between input parameters and burr sizes are constructed. Burr prediction function is realized under this mapping mode.
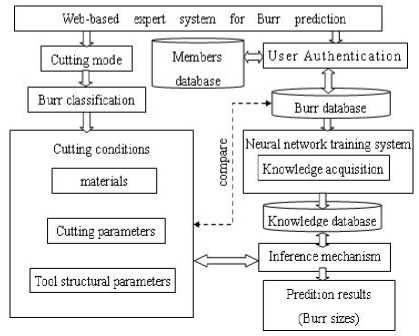
Figure 3. System structure
Ш. Inference Scheme of the System
ANNs is information processing technique that simulates biological nervous system using computers. One of the most important applications of ANN is to mode a system with unknown input-output relation. Among various ANN architectures, BP neural network is a commonly used network for learning multilayered perceptions with nonlinear sigmoid functions. The relation between input and output parameters can be observed only using a number of examples, called training set.
Fig.4 shows the structure of the neural network. The network is composed of input layer, hidden layer and output layer. Each layer input-output relation can be expressed y = f (IW • P + b) (1)
where, p is input vector, IW is weight vector, b is valve value vetor, f is transfer function, y is output vector.
The transfer funtion used for input layer and hidden layer is tansig f = —2-r 1 + e; x
- 1
The transfer funtion for output layer is purelin since some burr sizes exceed 1.0
f = x
Input vector is composed of factors that affect burr forming.
For example, in micro-milling burr prediction, influence factors employed in this system include cutting parameters and tool structural parameters
P = [ n , V c , f , doc , a , в , ] ? (4)
Where, n is spindle speed, v c is cutting speed, fz is feed per tooth, doc is depth of cut, a is axial rake angle, is radial rake angle. The meaning of a and в is shown in Fig.5.
Because these six parameters are the main factors that influencing the burr formation process[15]. So, we set the input vector as (4).
In drilling burr prediction, influence factors employed in this system include cutting parameters and tool structural parameters
P = [ v , f , Ф , e , ] T (5)
Where, v is cutting speed, f is feed rate, Ф is drilling bit vertex angle and в is drilling bit helical angle.
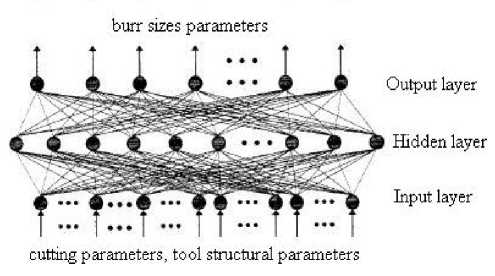
Figure 4. Structure of the BP neural network
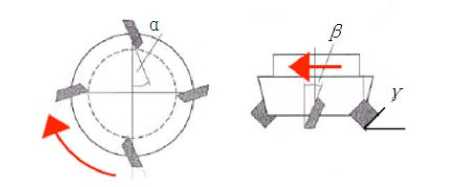
Figure 5. Meaning of a and в
Output vector is composed of burr geometrical characteristic parameters. Commonly, burr height(H) and burr thickness(B) are geometrical parameters that state the burrs features. Since workpiece edge quality are dependent on different application conditions, burr height(H) is acted as system output vector y in micromilling and burr thickness(B) in drilling. Fig.6 shows the meaning of burr height.
a 1 = tan sig ( IW 1,1 P + b 1 ) (6)
a 2 = purelin( LW 2,1 a* + b 2 ) (7)
H
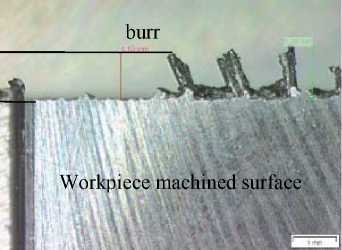
Figure 6. Meaning of burr height ( H )
where, IW is weight vector, b is valve value vector, tansig is the transfer function of hidden-layer which is defined as (2), and purelin is the transfer function of output-layer which is defined as (3).
B. Error Goal of the System
Generally, the training will stop when either the sum-squared error( SSE ) or maximum number of training epochs is reached. The criterion of relative deviation is used in this research to estimate the error goal which defined as
5 y =
ys - У. yt
x 100%
W. Structure Design and Realization of the System
-
A. System Development
One of the most difficult tasks in developing neural network application is the determination of the structural parameters of the network including the number of hidden layers, the number of neurons in each hidden layer, learning method and training epochs. A number of neural network structures were first generated by varying these parameters. These networks were then trained using the data obtained from experiment. The network which displayed the best generalization capability was selected. Fig.7 shows the structure of micro-machining burr prediction system.
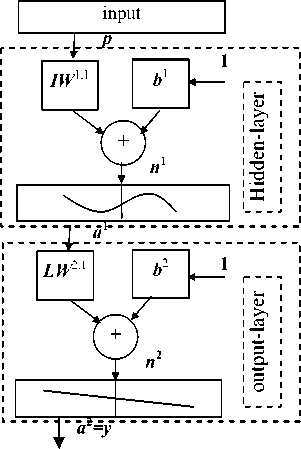
Figure 7. BP neural network structure in milling
Where, 6 y is relative deviation, y s is the value computed by the ANN(simulation results of burr size), y t is the target value of the variable( experimental results of burr size).
The SSE is represented as
MN 2
SSE ^ТЮ) i = 1 k = 1
Where, M is the number of training pattern pairs, N is the number of neurons in output layer.
However, a too big error goal could lead to poor training while a too small one could lead to over fitting which results in poor generalization capability of the network [16,17]. Different values of relative deviation have been tried and finally it was found that 10% produced the best result and was used in the training process.
-
C. experimental Conditions
Training set must provide for NN system learning, micro-machining experiments were conducted. Table I shows the cutting conditions and table II shows the tool structural parameters in micro-milling. Workpiece material is AlSi9Cu3[15].
The map relation defined as follows
TABLE I. cutting conditions
|
Cutting conditions |
|||
|
Spindle Speed n (min-1) |
Cutting Speed Vc (m/min) |
Feed per tooth fz (mm) |
Depth of cut doc (mm) |
|
3200 |
1257 |
0.08 0.14 |
0.80 |
|
2400 |
2513 |
1.20 |
|
|
10000 |
3927 |
1.50 |
|
TABLE II. tool structure parameters
|
Tool structural parameters |
||
|
Axial rake angle ( a ) (degrees) |
Radial rake angle ( в ) (degrees) |
Lead angle ( Y ) (degrees) |
|
0 |
-6 |
|
|
4 |
0 |
90 |
|
6 |
4 |
|
Micro-drilling experiments were carried out on vertical drill Z5140. The workpiece material was brass (H62), the workpiece shape was plate, 10~15 mm in thickness. Cutting tool was high-speed twist drill with diameter of 20mm. The cutting parameters and tool geometries parameters are listed in table W .
TABLE III. D rilling conditions
|
Cutting speed v(m/min) |
9.46;20.4;31.4 |
|
Feed rate f (mm/r) |
0.056;0.112;0.224 |
|
Vertex angle 2 Ф (°) |
110;118;130 |
|
Helix angle в (°) |
20;30;40 |
V. Expert System Validation and Results
A number of networks were generated using 12 pairs of input-output drilling burr experimental data as training set and 18 pairs of input-output micro-milling burr experimental data were used as training set. Levenberg-Marquardt learning method is employed since it is very efficient. The generalization capability of the network was then compared.
Table W shows the drilling burrs prediction results of different NN structural parameters. (One pair of inputoutput experimental data is used as test data for prediction result which output is 2.5 mm). It is indicated that the less the number of neurons is, the less the training time is and the poorer the generalization capability is. The generalization capability of network with two hidden layers is better than that with one hidden layer. Also, it shows that too large training epochs could lead to over fitting of training patterns which results in poor generalization capability of network.
TABLE IV.
P rediction results of different NN structural parameters
|
Hidden layer number |
neurons number in each layer |
Training epochs |
Prediction result(mm) |
error |
|
1 |
4 |
30 |
3.0477 |
21.908% |
|
40 |
2.8467 |
13.868% |
||
|
50 |
3.0380 |
21.52% |
||
|
2 |
4, 8 |
50 |
2.0644 |
17.424% |
|
150 |
2.6014 |
4.056% |
||
|
200 |
2.9556 |
18.224% |
||
|
4, 12 |
100 |
1.4100 |
43.6% |
|
|
150 |
2.5939 |
3.6% |
||
|
200 |
3.1600 |
26.4% |
According to compare results, a network with two hidden layers, first hidden layer has 4 neurons and second hidden layer has 8 neurons was selected for micro-drilling burrs prediction application. However, these structural parameters are not suitable for micromilling burrs’ prediction. Finally, a network which has one hidden layer, 12 neurons are selected for milling burr prediction.
-
A. System Prfomance
For micro-milling application, burr size prediction network was generated using 18 pairs of input-output micro-milling burr experimental data as training set. Fig.8 shows the performance of the selected network. It is shown from Fig.8 that the actual training epochs are 64 when the total training epochs are set for 100. The performance of trained network is 0.000225. It does not mean that the total train could set at 64. It is found from network test process that the fitting performance changed when the total training epochs and error goal value changed. In this research, 100 training epochs are selected by comparing the different test results.
When the training process is completed, the network generally performs well on the training set. Fig.9 shows the fitting performance of the trained network.
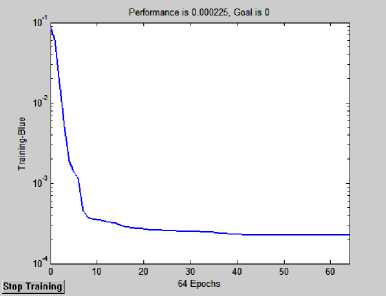
Figure 8. System performance in milling application
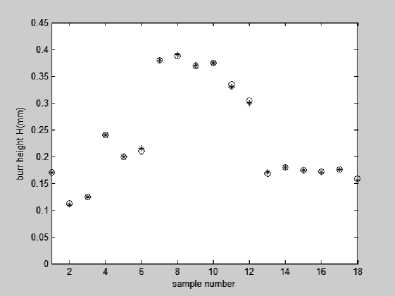
o-simulation results *-experimental results
Figure 9. Fitting performance of network in milling application
For micro-drilling application, A number of networks were generated using 12 pairs of input-output drilling burr experimental data as training set. Fig.10 shows the performance of the selected network. It is shown from
Fig.10(a) that the actual training epochs are 41 when the total training epochs are set for 150. The performance of trained network is 0.00685. It does not mean that the total train could set at 41. Fig.10(b) shows the performance of network which the total training epochs are 41. The performance is 2.28784. This means that two different trained networks have different function fitting performance for learning samples. Fig.11 shows the different fitting performance of two different network.
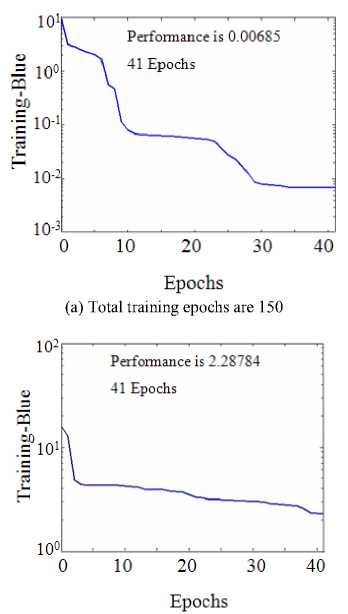
(b) Total training epochs are 41
Figure 10. Training performance of network in drilling application
Fig.11 shows the different fitting performance of two different networks.
*—experimental values О—simulation valuses
0 4 8 12
Sample number
(b) Total training epochs are 41
Figure 11. Fitting performance of network in drilling application
-
B. Generalization Capability
However, it has to be validated by using a validating set which has not been used in the training process. If the network performs poorly on the validating set, there must be some important information in the validating set that the networks have not learned. The samples with large relative deviations are then added to the training set. At the same time, the same numbers of samples are added to the validating set. The network is trained again using the augmented training set. This process of training and validation is repeated until the performance of the trained network on the validating set is acceptable.
Three pair of input-output experimental data is used as test data for prediction result. The generalization capability of the network was then compared. It is indicated that the less the number of neurons is, the less the training time is and the poorer the generalization capability is. It shows that too large training epochs could lead to over fitting of training patterns which results in poor generalization capability of network. Fig.12 (a) shows the Comparison results between prediction results and validating set which have one hidden layers with 12 neurons, training epochs are 150. Fig.12 (b) shows the Comparison results between prediction results and validating set.

*—experimental values О—simulation valuses

О 4 8 12
Sample numer
(a) Total training epochs are 150
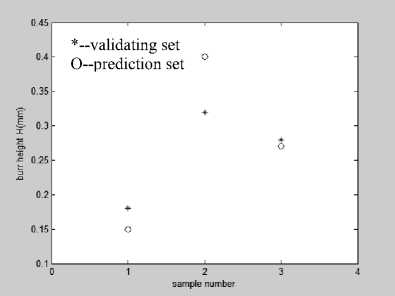
(a) Total training epochs are 150
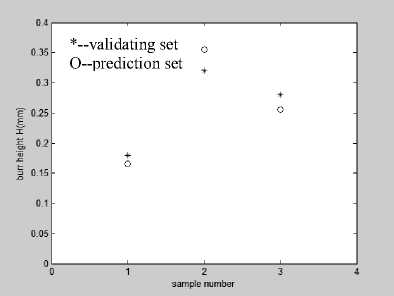
(b) Total training epochs are 100
Figure 12. Comparison of prediction results and validating set in milling application
Fig.13 shows the compared results of the system prediction results and validating set of the burr thickness in drilling application.
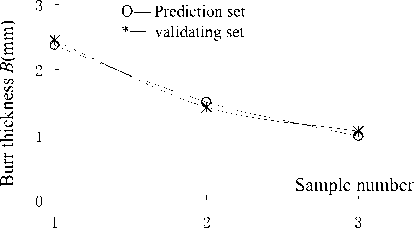
Figure 13. Comparison of prediction results and validating set in drilling application
This clearly indicates that the developed system has the generalization capability. Only one set of training sample was needed for burr size prediction. Also, the developed web-based system provide a convenient way for data transmission between multi-workshop and across regions.
-
C. Burrs Control
The object of the modeling of micro-machining burrs process is to control burr forming in machining process. Under the desired burrs sizes acted as system input, recommended cutting conditions are selected by the system. Fig.14 shows the flow of the burrs control.
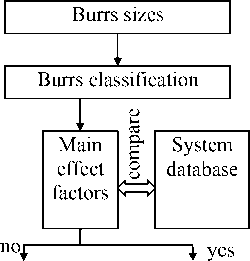
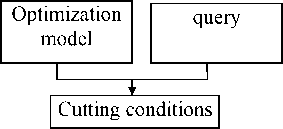
Figure 14. Flow chart of burrs control
The optimization model for cutting conditions in micro-milling applications was established. Penalty function [18] for optimization of discrete variables and process controlling [19] are adopted. Optimization model can be defined as
m f (x, ri, r2) = f (x) + ri E G [gj (x)]
j = 1
l
+ r 2 E H [ hk ( x ) ]
k = 1
Where, f (x) is the function of burrs sizes and cutting conditions. r 1 and r 2 are weighted factors. g (x) and h (x) are constraints.
Fig.15 shows the results of burrs control by process controlling. Where, Fig.15 (a) shows the workpiece edge morphology machined by normal cutting conditions, Fig.15(b) shows the workpiece edge mophology machined by optimizated cutting conditions.
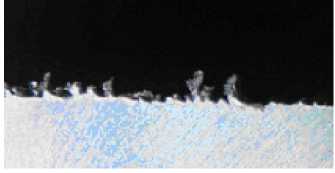
(a) Normal cutting conditions
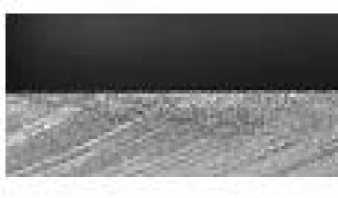
(b) Optimization cutting conditions
Figure 15. Workpiece edge mophology machined by two different cutting conditions[19]
It is shown that the burrs sizes are reduced obviously by cutting conditions optimization.
4. Conclusions
A web-based expert system for burr prediction and controlling in micro-machining was developed. It has following functions:
-
• Member authentication and registration which utilized destinationpageurl properties of login control included in ASP.NET 2.0 membership frame.
-
• Burrs database remote management utilized ADO.NET techniques.
-
• Bursr prediction utilized ANN inference scheme based on BP neureal network.
-
• Burrs control utilized the model of penalty function for optimization of discrete variables.
Mapping relation between cutting parameters and burr sizes is constructed using NN techniques. The use of NN provides the system with learning and generalization capabilities. Results show that the system is efficient and acceptable in burr prediction and controlling.
Acknowledgment
The authors would like to thank Jiangsu Provincial Nature Science Foundation (№:BK2007562) Jiangsu University Foundation (№:07JDG025 ) for the supporting.
References Application of Neural Network on Burr Expert System in Micro-machining
- Nakayama, Kazuo, “ Burr formation in metal cutting,” CIRP Annals, Yokohama Natl Univ, Jpn, Yokohama Natl Univ, Jpn, Arai, v, 36, n 1, pp 33-36, 1987.
- Gillespie, L.K.; Blotter, P.T., “Formation and properties of machining burrs,” Journal of Engineering for Industry, Transactions of the ASME, v 98 Ser B, n 1, p 66-74, Feb 1976.
- Iwata, K., Ueda, K., Okuda, K., “Study of Mechanism of Burrs Formation in Cutting Based on Direct SEM Observation”, Nagoya Univ, Japan, J.of JSPE, 48, 1982, pp.510-515.
- Chern, G.L., “ Analysis of Burr Formation and Breakout in Metal Cutting”, Ph.D. Dissertation, Dept. of Mech.Engr., Univ. of California, Berkeley, April, 1993.
- Rangarajan, A., and Dornfeld, D., “Efficient Tool Paths and Part Orientation for Face Milling”, CIRP Annals- Manufacturing Technology, Lab. for Manufacturing Automation, Dept. of Mechanical Engineering, University of California, Berkeley, v 53, n 1, p 73-76, 2004.
- Lee, K., and Dornfeld, D., “ Micro-burr Formation and Minimization through Process Control”, Precision Engineering, Department of Mechanical Engineering, University of California at Berkeley, Berkeley, CA 94720, United States, v 29, n 2, p 246-252, April 2005.
- Sofrons, A., “ Reduction of Burr Formation in Drilling”, S.M.E. Techinical Paper , Fabr Conf, Dearborn 00001500, MR75-376, 1976.
- Sofrons, A., “ The Formation and Control of Drilling Burrs”, Ph.D. dissertation, The University of Detroit. 1975.
- Ko,S.L., Dornfeld, D.A., “Analysis of Fracture in Burr Formation at the Exit Stage of Metal Cutting”, Journal of Materials Processing Technology, Elsevier Science Inc, ISSN: 09240136; DOI: 10.1016/0924-0136(95)02124-8, Vol. 58, n 2-3, p 189-200, Mar 15 1996.
- Kumar,S., “Basic Mode for Burr Prediction System”, CODEF/NSF research report, University of California, Berkeley, 2000.
- Wang,G.C., Zhu Y.M., Zhang C.Y., “Mathematical model of two side-direction burr formation”, ACTA ARMAMENTARII, Beijing, China, ISSN 1000-1093, V24, n,4, pp. 513-515, 2003.
- S. Kumar, D. A. Dornfeld, “Basic approach to a prediction system for burr formation in face milling, ” Journal of Manufacturing Processes, Vol. 5, Iss. 2, 2003 , pp 127-143.
- J. Kim, D. A. Dornfeld, “Cost minimization of drilling operation by a drilling burr control chart and bayesian statistics,” SME J. Manufacturing Systems, Vol. 20, No. 2, 2001, pp. 89-97.
- C. H. Chu, D. A. Dornfeld, "Tool path planning for avoiding exit burrs, ” J. of Manufacturing Processes, Vol.2, No. 2, 2000, pp 116-123.
- M. C. Avila, “The effect of kinematical parameters and tool geometry on burr height in face milling of Al-Si alloys,” unpublished.
- T. L. Liu, X. M. Yang, and G. J. Kalambur, “Design for machining using expert system and fuzzy logic approach,” ASME J. Mater. Eng. Perform, California State Univ - Sacramento, Sacramento, United States, Vol. 4, No.5, 1995, pp 599-609.
- G. H. Choi, D. Lee, N. Chang, and S. G. Kim, “Optimization of process parameters of injection molding with neural network application in a process simulation environment,” Ann.CIRP, Inst of Advanced Engineering, Seoul, Korea, Republic of ,Vol. 43, No. 1, 1994, pp 449-452.
- Zhu,Y.M., “Study on Formation and Controlling of Metal Cutting Burr and Development of Burr Expert System”, Ph.D. Dissertation, Dept. of Mech.Engr., Univ. of Jiangsu, Zhenjiang, June, 2006.
- Amit,B., Kiha,L., “Tool Path Planning in Conjunction with Exit Order Sequence”, LMR research report, University of California, Berkeley, 2001-2002, pp.30-35.
