Application of Particle Swarm based Neural Network to Predict Scour Depth around the Bridge Pier

Author: Sreedhara B. M., Geetha Kuntoji, Manu, S. Mandal
Journal: International Journal of Intelligent Systems and Applications @ijisa
Article in issue: 11 vol.11, 2019.
Free access
Scour around the bridge pier is one of the major factors which affect the safety and stability of the bridge structure. Due to the presence of complexity in the scour mechanism, there is no common and simple method to estimate the scour depth. The present paper gives an idea of hybridizing two techniques such as an artificial neural network with swarm intelligence technique particle swarm optimization to estimate the scour depth around the bridge pier and abbreviated as PSO-ANN. The present discussion covers the estimation of scour depth for clear water and live bed scour condition around circular and rectangular pier shapes. The independent variables, Sediment size (d50), sediment quantity (Sq), velocity (u) and time (t) are used as input to develop the models to estimate or quantify a dependent variable scour depth (ds). The efficiency and accuracy of the model are measured using model performances indicators such as Correlation Coefficient (CC), Normalized Root Mean Square Error (NRMSE), Nash Sutcliffe Error (NSE), and Normalized Mean Bias (NMB). The predicted results of both the models are compared with each other and also compared with measured scour depth. The study concludes that the proposed PSO-ANN model is suitable to estimate the scour depth in both the cases for circular and rectangular pier shapes.
Pier scour, clear water condition, live bed condition, Particle Swarm Optimization- Artificial Neural Network (PSO-ANN)
Short address: https://sciup.org/15017107
IDR: 15017107 | DOI: 10.5815/ijisa.2019.11.04
Text of the scientific article Application of Particle Swarm based Neural Network to Predict Scour Depth around the Bridge Pier
Published Online November 2019 in MECS
Scour is the complex phenomenon occurs at the structure base located across the flowing water. Later, lowering of the riverbed leads to the exposure of bridge foundation. Scour mechanism occurs when the normal flow interacts with the obstacle and develops large scale eddies at the structure base. This leads to the formation of horseshoes and wake vortex at the base and downstream of the structure respectively. This vortex system leads to the erosion and forms scour hole. The typical scour mechanism is illustrated in Fig.1.
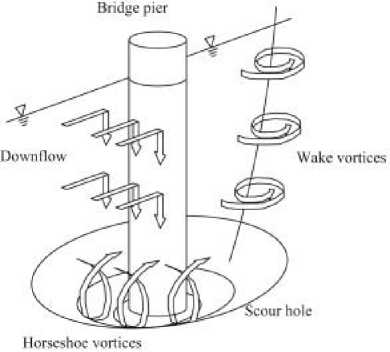
Fig.1. Mechanism of local scour [1]
Based on the criteria, characteristics of river bed material, scour happens under two states of clear water and live bed scour. The type one case of clear water scour happens in the absence of bed material movement in the upstream of the intersection. Due to the obstacles (piers, abutments) in the flow. The scour hole continues to grow until the equilibrium scour-depth is reached. In the type two case of live-bed scour happens due to a consistent supply of sediment from the upstream to the scour hole. The rate of sediment supply to the scour hole equal to the rate of sediment transported out of the scour hole and then equilibrium of scour depth achieved.
-
II. Related Works
Aside from experimental studies and empirical models, in late decades soft computing techniques, artificial neural network (ANN), adaptive Neuro inference system (ANFIS) [2–4], support vector regression (SVR) [5,6], genetic algorithm (GA) [7], group method-data handling (GMDH) [8] etc., are being used widely to predict the scour depth using experimental values. The individual models have been applied by various researchers to estimate scour depth around piers [9,10], risk assessment for structure maintenance [11] and scour below spillways [12]. In recent years, the combined effect of the evolutionary algorithm is developed using optimization technique, particle swarm optimization (PSO) [2] with ANN as an emerging tool in various fields. The (PSO-ANN) technique is used to identify the surface settlement due to tunneling [13], to check the floating type breakwater efficiency [14], to predict wave transmission of tandem breakwater [15] and fault prediction of object-oriented systems [16].
The highlight of the present paper is to check the applicability of PSO-ANN model to estimate the scour depth a critical parameter, where the parameters of ANN models are optimized using PSO to improve the model efficiency of ANN model. From the past study, it is noticed that none of the studies has been carried out using PSO-ANN model to predict scour depth. Hence, an effort is made to predict the scour depth around a bridge pier using PSO-ANN hybrid technique. The experimental data on scour depth around circular and rectangular pier are obtained under two different condition are utilized to develop the soft computing models with different combinations. The estimated scour depth are compared with experimental results in terms of statistical parameters.
-
III. Experimental Data Classification
Goswami Pankaj [17] conducted the tests on scour depth around the circular and rectangular pier in clear water and live bed condition. The flume used is 1.0 m wide, 1.3 m depth and 19.25 m in length. The two test conditions, for example, clear water, and live bed considered for the lab trials. If there should be an occurrence of clear water scour condition the test is done around 0-6 long periods of analysis length with 1-hour interval for velocities of 0.215, 0.278 and 0.226. For live bed scour condition the 747.78 and 1066.67 ppm of sediment taken in the flow with at velocities of 0.251, 0.226 and the test duration was about 0-4 hours with 1-hour interval.
The range of experimental variables utilized as a part of the examination is shown in Table 1.
Table 1. Experimental data.
|
Variables |
Range |
|
Sediment size, d50 (mm) |
0.42, 4.2 |
|
Sediment quantity, Sq (ppm) |
747.78, 1066.67 |
|
Velocity, u (m/Sec) |
0.184, 0.226, 0.251, 0.278, 0.351 |
|
Time, t (Hours) |
0, 1, 2, 3, 4, 5, 6 |
|
Pier shape |
Circular, Rectangular |
|
Scour type |
Clear water, Live bed |
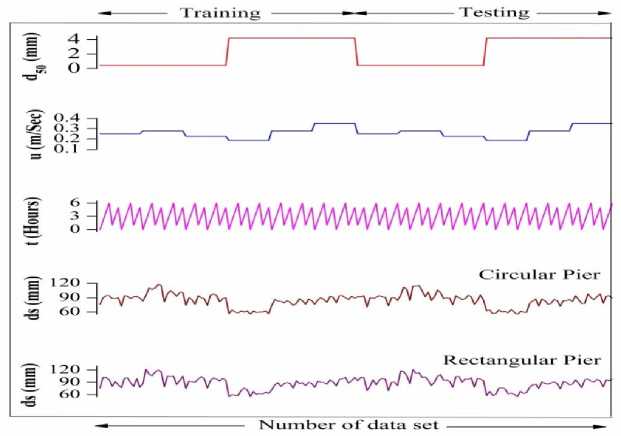
Fig.2. Experimental data in clear water scour condition
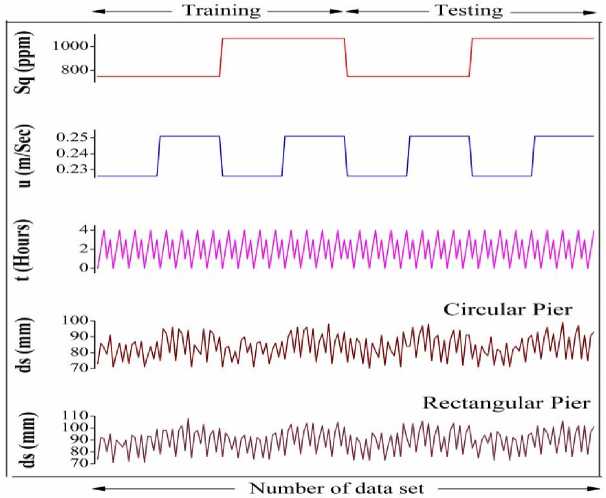
Fig.3. Experimental data in live bed scour condition
For the present study, based on the trial and error method, the complete data divided into two groups, training (50%) and testing (50%). The input parameters which influence the scour depth (ds) in clear water condition (Fig. 2) are d50, u, t and in live bed scour condition (Fig. 3) are Sq, u and t, considered in developing the PSO-ANN model.
-
IV. Model Development and Performance Evaluation
-
A. Particle swarm optimization based artificial neural network (PSO-ANN)
Artificial Neural Network (ANN) is the type of computer intelligence. Since 1960 ANN models inspired by human brains made of a group of neurons as nodes. The typical neural network structure consists of the input layer, hidden layer, and an output layer. The velocity, size, quantity, time of sediment as input layers to predict the scour depth as output in the present study. The traditional network consists of the input layer, hidden layer, and an output layer. The velocity, size, quantity, time of sediment as input layers to estimate the scour depth as output in the present paper. The hidden layers and neurons numbers are decided by trial and error technique[13]. The neurons used to process the information received by the input layer neurons. The weights are the connectivity element between neurons in adjacent layers. By changing the weights of the training patterns at each process Network learning is achieved [14]. In this study, the feed forward back propagation (FFBP) neural network is considered.
Kennedy and Eberhart keeping the population in mind, a technique named as particle swarm optimization (PSO) to optimize the techniques. It is inspired by the social behavior of a bird population and schooling fish, etc.
And algorithm is initiated with a set of particles with a position and velocity vector and criteria of fitness value. Individual knowledge and memory of the swarm or particle as a whole find the best solution. The position as best for each particle is chosen during the movement of the particles from its own and neighboring particle experience.
A population based technique developed in 1995 [17] and used for optimizing process known as Particle swarm optimization (PSO) by Kennedy and Eberhart inspired by social behavior of bird flocking and fish schooling, etc. the PSO algorithm starts with a fitness value, position and velocity vector particles set, Individual knowledge and memory of the swarm or particle as a whole are used to find the best solution. The movement from its own and neighboring particle experience the best position of each particle is chosen.
In the learning process of ANN, the initial weights randomly selected. This weakness of the ANN model require a number of iterations to fit optimal weights and are strongly dependent on the initial weights. This paper proposed to improve the learning speed of ANN by selecting initial weights by using the PSO algorithm. The points involved in the PSO-ANN algorithm are as follows.
Step 1: data analysis and preprocessing
-
• collection of experimental data
-
• selection of input and output variables
-
• experimental data, split into two sets (training and testing data)
Step 2: developing PSO-ANN model
-
• the most important step in the learning ANN algorithm is a selection of network architecture (feed-forward neural network). In the study 3
independent parameters are used as input to predict a dependent variable as output.
-
• as mentioned earlier, each particle has a fitness value, position and velocity vector. In the first iteration, PSO randomly selects the position and velocity of particles.
After every iteration, position and velocity of each particle keep updated with gbest and pbest values.
Vel J + 1 = W j Vel i + C 1 rand 1 (pbest j - pos i )
+ C 2 rand 2( gbest j - post j )
pos j + 1 = Pos j + 1 + Ve j + 1 (2)
are parameters of scaling cognitive and social, random numbers rand and rand interval of [0, 1] are subjected to the ith particle, particle inertia is given as W , pbest is the best position found by the i th particle , and global best gbestj position is found among all particles.
Particle or swarm position and velocity are updated using the equations (1) and (2).
-
• The iterations will repeat until the target meets.
-
• After reaching the target, the model prediction results analyzed using the statistical indices explained in Section 3.2.
Fig. 4, is the flowchart of PSO-ANN model procedure to estimate the scour depth around the bridge pier.
Where, posi is particles present location, i is trials count, Veli is search velocity of ith particle, C and C
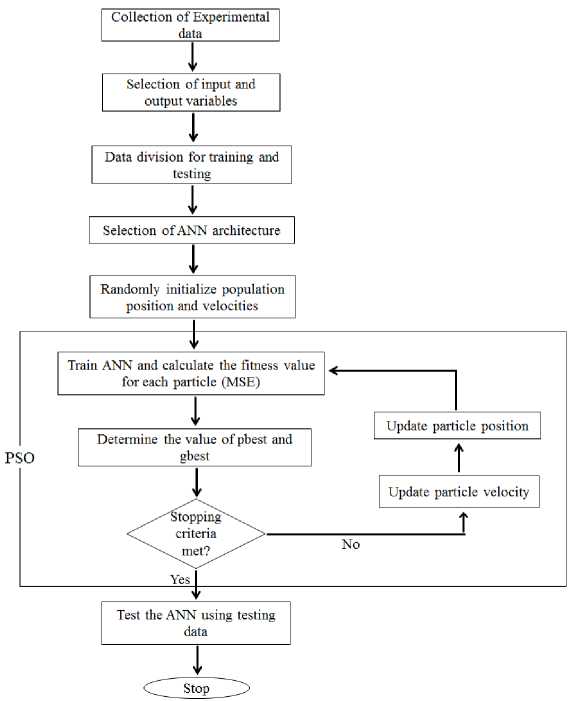
Fig.4. Flowchart for PSO-ANN model
B. Model performance evaluation
The accuracy and model performance of PSO-ANN analyzed by the following statistical indices where
NRMSE =
RMSE max + ^mm
x 100
1. Normalized-Root-Mean-Square-Error (NRMSE)
RMSE =
N
L = 1 ( X - Y ) 2
N
2. Normalized-Mean-Bias (NMB)
(Y -X-
NMB = Y---i
X l = 1
Y i
—
Nash-Sutcliffe coefficient (NSE)
NSE = 1 —
N
E J Xi — Y^
E N , ( x. — x )2
V^^ z = 1 /
Correlation Coefficient (CC)
CC =
E n
,=1 ( X — X )■ (Y i — Y )
NN
V E i = 1 ( X i - X )2 ■ E i = 1( Y — Y )2
Where X is Measured values, Y is Predicted values, X is Mean of measured values, Y is Mean of estimated values, N is the full length data points.
-
V. Results with Discussion
-
A. Estimation of scour depth for clear water scour condition
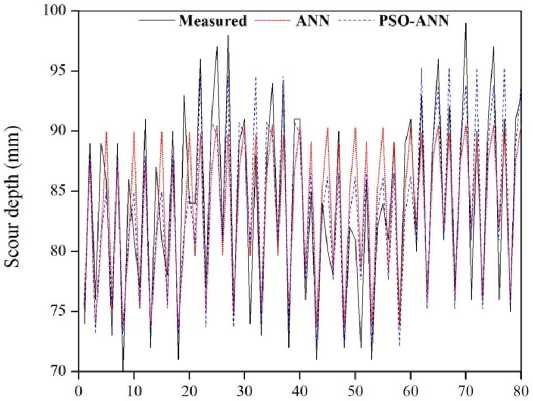
The ANN and hybrid technique PSO-ANN model developed to estimate the scour depth around the circular and rectangular pier in clear water case. The experimental values used to develop the model, tabulated in Table 1. The estimated scour depth by the model is compared with experimental values. The accuracy and performance of models, evaluated using statistical indices and the same are presented in Table 2. Fig 5 shows the scatter plots of measured and predicted scour depth of circular pier and Fig. 6, represents a rectangular pier for both ANN and PSO-ANN models. The comparison plots of Fig. 7 and Fig. 8 shows that, the PSO-ANN model is showing good correlation with the measured values. Table 2 presents the ANN and PSO-ANN model's correlation for circular pier and rectangular case for clear water scour condition in testing phase. From the Table 2, it is clear that both the models are performed better for circular pier in clear water scour condition. The PSO-ANN is giving good correlation for circular pier with CC = 0.925 and NSE=0.855 in testing phase.
From the NMB indices, it is clear that the rectangular pier results are under-predicted compared to the circular pier. From the comparison plot (Fig. 7 and Fig. 8), discovered that the estimated scour depth trend is similar in both models of predicted and experimental.
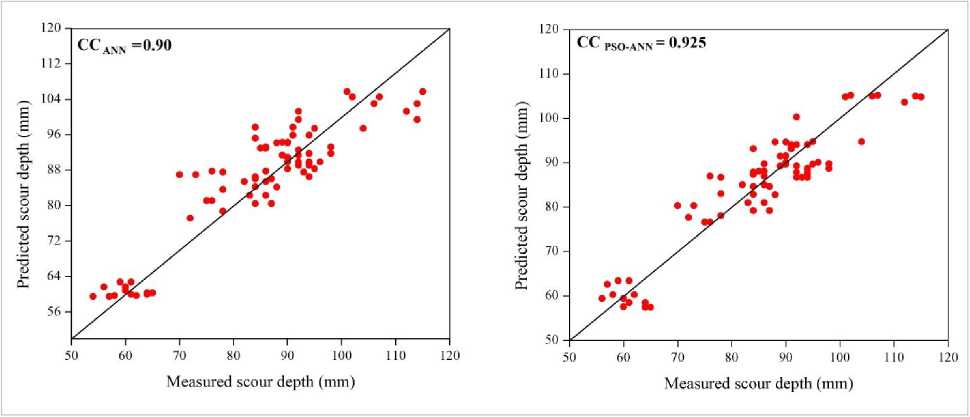
Fig.5. Scatter plots for circular pier shape in clear water case in testing phase
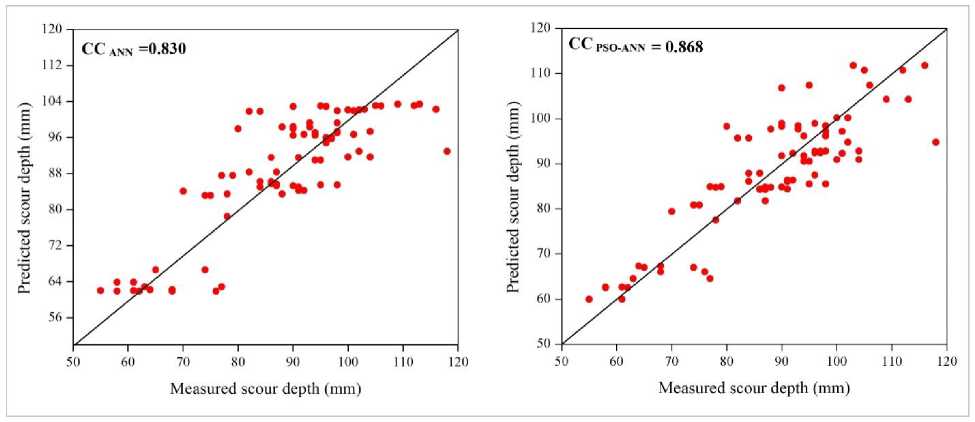
Fig.6. Scatter plots for rectangular pier shape in clear water case.
Table 2. Results of ANN and PSO-ANN model for clear water scour condition
|
Pier shape |
Statistical indices |
ANN Model |
PSO-ANN Model |
||
|
Train |
Test |
Train |
Test |
||
|
Circular |
CC |
0.915 |
0.90 |
0.934 |
0.925 |
|
NRMSE |
12.26 |
12.93 |
8.05 |
8.855 |
|
|
NSE |
0.702 |
0.69 |
0.872 |
0.855 |
|
|
NMB |
-0.034 |
-0.037 |
0.0009 |
-0.002 |
|
|
Rectangular |
CC |
0.848 |
0.830 |
0.890 |
0.868 |
|
NRMSE |
13.04 |
13.23 |
10.23 |
11.023 |
|
|
NSE |
0.66 |
0.638 |
0.791 |
0.751 |
|
|
NMB |
0.01 |
0.005 |
-0.001 |
-0.006 |
|
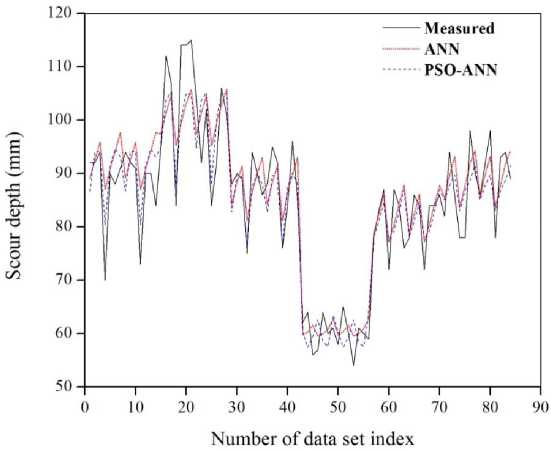
Fig.7. Comparison plots for clear water scour condition in the testing phase
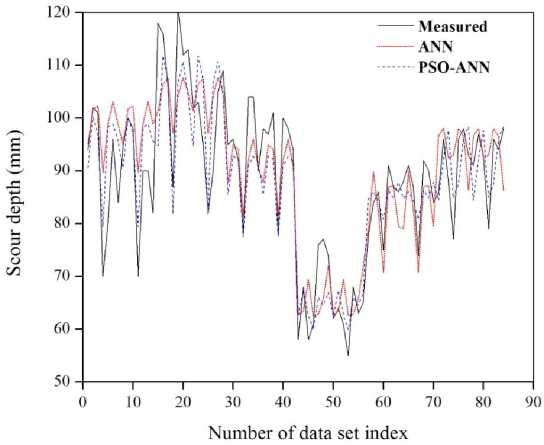
Fig.8. Comparison plots of rectangular pier for clear water scour condition in the testing phase
-
B. Estimation of scour depth for live-bed scour condition
In the present explanation, ANN and PSO-ANN model developed to estimate the scour depth around the circular and rectangular pier in live bed scour condition is discussed. The experimental data used to develop the model are tabulated in Table 1. The model predictions are assessed using statistical indices and the same is presented in Table 3 for both testing and training phase. Fig 9, Fig 10 is the scatter plots of measured and predicted scour depth for circular and rectangular case respectively for both ANN and PSO-ANN models. The
Table 3 shows that, the model gives a better correlation for rectangular pier case in terms of higher CC of 0.925 for testing, greater NSE of 0.873 for testing, smaller NRMSE of 10.809 for testing. The comparison of the models predicted and measured values are plotted in Fig 11 and Fig. 12. From the Table 3 it is clear that, both the models are performing better for rectangular pier under live bed scour condition. The PSO-ANN model is performing well for rectangular pier compared to ANN model and experimental results.
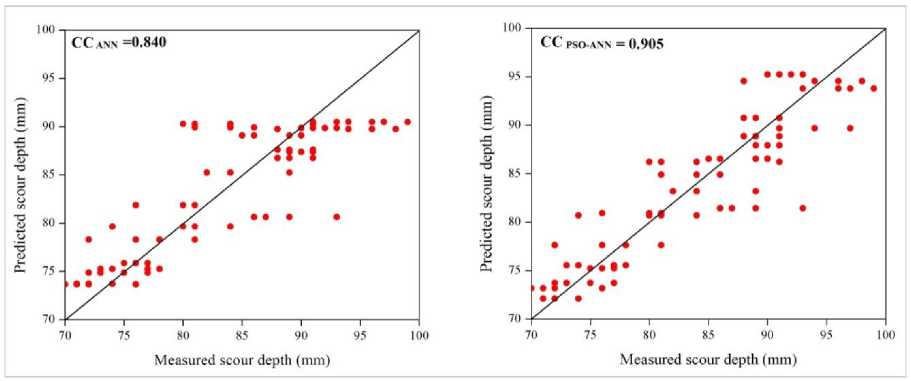
Fig.9. Scatter plots for circular pier shape in live bed scour condition in testing phase
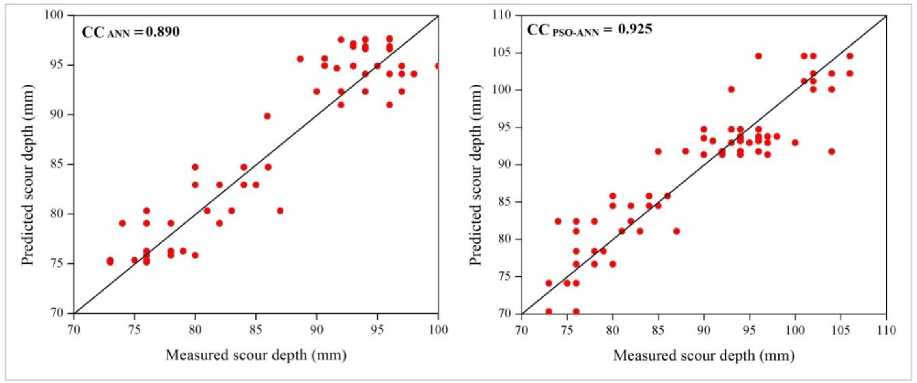
Fig.10. Scatter plots for rectangular pier shape in live bed scour condition in testing phase
Table 3 Results of ANN and PSO-ANN models for live bed scour condition
|
Pier shape |
Statistical indices |
ANN Model |
PSO-ANN Model |
||
|
Train |
Test |
Train |
Test |
||
|
Circular |
CC |
0.865 |
0.840 |
0.948 |
0.905 |
|
NRMSE |
15.02 |
16.65 |
9.11 |
11.69 |
|
|
NSE |
0.72 |
0.69 |
0.898 |
0.818 |
|
|
NMB |
0.004 |
0.02 |
0.0003 |
-0.003 |
|
|
Rectangular |
CC |
0.920 |
0.890 |
0.942 |
0.925 |
|
NRMSE |
9.93 |
12.48 |
7.32 |
10.81 |
|
|
NSE |
0.86 |
0.83 |
0.925 |
0.873 |
|
|
NMB |
-0.002 |
-0.003 |
0.00 |
-0.002 |
|
Number of data set index
Fig.11. Comparison plots for live bed scour condition for testing phase
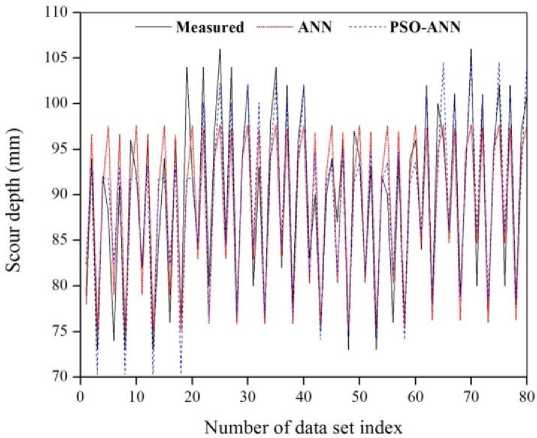
Fig.12. Comparison plots for live bed scour condition for testing phase
-
VI. Conclusions
The accurate scour depth prediction ensures the safefunctioning and economic design of the piers. The present research has proposed ANN and simpler hybrid technique, i.e., PSO-ANN to estimate scour depth for the circular and rectangular pier with clear water and live bed conditions. Based on the results and discussion, conclusions drawn below:
-
• The ANN models is not performing well due to improper selection of weights and bias. The particle swarm optimization is used as a optimizing tool to select the optimal weights and bias in ANN model to get the better prediction.
-
• In case of clear water, PSO-ANN model showed better correlation for circular pier case compared to ANN model.
-
• Overall results of PSO-ANN model showed better performance for the rectangular pier with live-bed condition compared to all other cases considered in the present research. This will serve as an efficient and alternative tool or technique to estimate the scour depth around a bridge pier.
Acknowledgments
The authors want to offer their genuine thanks to Dr. Pankaj Goswami, Guwahati University for providing experimental data.
References Application of Particle Swarm based Neural Network to Predict Scour Depth around the Bridge Pier
- L.J. Prendergast, K. Gavin, A review of bridge scour monitoring techniques, J. Rock Mech. Geotech. Eng. 6 (2014) 138–149. doi:10.1016/j.jrmge.2014.01.007.
- B.M. Sreedhara, M. Rao, S. Mandal, Application of an evolutionary technique (PSO–SVM) and ANFIS in clear-water scour depth prediction around bridge piers, Neural Comput. Appl. (2018). doi:10.1007/s00521-018-3570-6.
- S. Akib, M. Mohammadhassani, A. Jahangirzadeh, Application of ANFIS and LR in prediction of scour depth in bridges, Comput. Fluids. (2014). doi:10.1016/j.compfluid.2013.12.004.
- H.M. Azamathulla, A.A. Ghani, ANFIS-Based Approach for Predicting the Scour Depth at Culvert Outlets, J. Pipeline Syst. Eng. Pract. 2 (2011) 35–40. doi:10.1061/(ASCE)PS.1949-1204.0000066.
- B.M. Sreedhara, Manu, S. Mandal, Estimation of live bed scour depth around different shapes of bridge piers using ANFIS and SVMR approach, Int. J. Ecol. Dev. 33 (2018) 30–46.
- M. and M.S. Geetha S., Kuntoji, Subba Rao, Performance evaluation of ANFIS and SVM Model in Prediction of Wave Transmission over Submerged Reef of Tandem Breakwater, Int. J. Ecol. Dev. 32 (2017) 141–155.
- M. Najafzadeh, G.A. Barani, Comparison of group method of data handling based genetic programming and back propagation systems to predict scour depth around bridge piers, Sci. Iran. (2011). doi:10.1016/j.scient.2011.11.017.
- M. Najafzadeh, H.M. Azamathulla, Group method of data handling to predict scour depth around bridge piers, Neural Comput. Appl. (2013). doi:10.1007/s00521-012-1160-6.
- A. Kaya, Artificial neural network study of observed pattern of scour depth around bridge piers, Comput. Geotech. (2010). doi:10.1016/j.compgeo.2009.10.003.
- L.T. L, J.D. S, Z.G. H, Neural Network Modeling for estimation of Scour depth around Bridge piers, 19 (2007) 378–386.
- Elhag, T. M., & Wang, Y. M. (2007). Risk assessment for bridge maintenance projects: neural networks versus regression techniques. Journal of computing in civil engineering, 21(6), 402-409..
- H.M. Azamathulla, M.C. Deo, P.B. Deolalikar, Alternative neural networks to estimate the scour below spillways, Adv. Eng. Softw. (2008). doi:10.1016/j.advengsoft.2007.07.004.
- M. Hasanipanah, M. Noorian bidgoli, • Danial, J. Armaghani, H. Khamesi, Feasibility of PSO ANN model for predicting surface settlement caused by tunneling, (n.d.) (2016) doi:10.1007/s00366-016-0447-0.
- G. Hadi, K. Morteza, P. Enrique, F. Javier, F. Andrés, A new hybrid ANN model for evaluating the efficiency of the Π-type Floating Breakwater, Coast. Eng. Proc. 35 (2016) 25.
- G. Kuntoji, M. Rao, S. Rao, Prediction of wave transmission over submerged reef of tandem breakwater using PSO-SVM and PSO-ANN techniques, ISH J. Hydraul. Eng. (2018) 1–8. doi:10.1080/09715010.2018.1482796.
- N. Kayarvizhy, S. Kanmani, V. Rhymend Uthariaraj, Improving Fault Prediction using ANN-PSO in Object Oriented Systems, Int. J. Comput. Appl. 73 (2013) 18–25.
- Goswami Pankaj, Evaluation of scour depth around bridge piers, Gauhati University, 2013. http://shodhganga.inflibnet.ac.in/handle/10603/74698.
