Application of the bootstrap method for statistical characteristics assessment of aircraft components’ small samples

Author: Gerasimova D.S., Sayapin A.V., Palukhin A.A., Katsura A.V.
Journal: Сибирский аэрокосмический журнал @vestnik-sibsau
Section: Авиационная и ракетно-космическая техника
Article in issue: 3 т.19, 2018.
Free access
The estimation of adequate service life of aircraft instruments is a factor of great importance in aircraft operation process. Changing the instrument service interval affects both reliability (shorter intervals make it easier to locate malfunctions of components and assemblies as early as possible) and economic performance (inducing increase of operating costs). So, the increasing the service interval without potentially reducing reliability is an economically im- portant task. To determine the optimal time to maintenance for aviation components and assemblies, it is necessary to determine the span of their service life with the highest degree of precision. The problem of calculating such estimates is compli- cated by the fact that the data on component failures are scattered and incomplete, which makes it difficult to assess their statistical characteristics accurately. The purpose of this article is to find an effective method of statistical characteristics assessment for small samples as the first stage of modeling of the aircraft components and assemblies reliability. It is induced by specific operational factors of aviation components exchange at small airlines operating Soviet-time aircraft. The article examines two methods of resampling, bootstrap and jackknife. There is also an assessment of mean time to failure expectation for fuel gauges, of the variance and root-mean- square deviation in the article. The bootstrap method is offered as applicable for statistical characteristics assessment of mean time to failure ex- pectation for aircraft components and assemblies taken for analysis in small samples (pressure gauges were chosen as an example of such analysis). The assessments and calculations can be used by airlines to state the nonfailure service time of a variety of components and assemblies.
Bootsrap, reliability, statistics, bootstrap, aviation, aircraft components
Short address: https://sciup.org/148321860
IDR: 148321860 | UDC: 629.735.064 | DOI: 10.31772/2587-6066-2018-19-3-482-488
Bootstrap-метод для оценки статистических характеристик малых выборок авиационных агрегатов
Выбор адекватного срока службы авиационных приборов - важная часть процесса эксплуатации воздуш- ных судов. Изменение срока межсервисного интервала для приборов оказывает влияние как на надежность (так как уменьшение этого интервала приводит к возможному выявлению проблем с узлами и агрегатами на ранней стадии), так и на экономические показатели, повышая эксплуатационные расходы. Увеличение межсервисного интервала без потенциального снижения надежности является важной экономической задачей. Для уточнения межсервисного интервала авиационных узлов и агрегатов необходимо как можно с более высокой достоверностью знать оценку срока службы тех или иных узлов и агрегатов. Задача вычисления та- ких оценок осложняется тем, что данные по отказам таких узлов и агрегатов носят разрозненный характер и невелики по объему, что затрудняет корректную оценку их статистических характеристик. Цель данной статьи - подобрать действенный метод для оценки статистических характеристик малых выборок в качестве первого этапа моделирования надежности авиационных узлов и агрегатов. Такое условие обусловлено производственными особенностями обменных фондов авиационных агрегатов небольших авиа- компаний, эксплуатирующих советскую технику. В статье выбираются два метода передискретизации - bootstrap и jackknife, проводится исследование эмпирических данных. В работе оценивается математическое ожидание наработки на отказ манометров, а также дисперсия и среднеквадратичное отклонение. Произведено сравнение методов bootstrap и jackknife. Показана недостаточная адекватность метода jackknife, продемонстрированы преимущества метода bootstrap. Показана возможность использования метода bootstrap для оценки статистических характеристик наработки на отказ авиационных узлов и агрегатов в случае малого размера выборок для анализа на примере манометров. Результаты работы могут быть использованы авиационными компаниями для оценки наработки на отказ различных узлов и агрегатов.
Text of the scientific article Application of the bootstrap method for statistical characteristics assessment of aircraft components’ small samples
Introduction . The development of methods and means to reduce the number of aircraft and helicopter system failures, as well as flight safety improvement, has always been a priority task. This is connected with economic factors, for example, to some reduction of aircraft maintenance cost, and accordingly, with the increase of air transportation economic efficiency [1], and to psychological factors as well [2].
For increasing the technical reliability of certain aircraft components, one must use an effective reliability assessment of the components already in operation.
The failure of aircraft components and assemblies is a stochastic process. To adequately model such processes, one must know their statistical characteristics.
Unfortunately, the collection, accumulation and storage of information on the status and failures of aircraft in general and of their specific components is not systematic at the moment [3]. There is an acute lack of information concerning end-to-end documentation on instruments and spare parts. It often happens that there are no entries in the logs about previous failures or repairs of various parts and components, and there are errors in inaccurate filling of the forms of these components. Due to all these factors, it is difficult to collect and process the statistical information on aircraft failures and defects; that makes it hard to assess the components reliability.
Under the circumstances, the methods aimed at statistical analysis of small samples are of particular importance.
Statistical methods of small sample analysis. Statistics doesn’t have any clear definition of small samples. Typically, the sample is called small if its volume does not exceed 30 units [4]. The “criterion of smallness“ of the sample was outlined by D. V. Gaskarov and V. I. Shapovalov in the article “Small sample“, which states that the sample should be considered small when in processing by means of methods based on data grouping, the specified accuracy and reliability cannot be attained [5; 6].
The development of new statistical methods focused on the processing of a limited number of observations started out when the use of traditional methods of mathematical statistics proved inapplicable – they aren’t suitable for processing samples of such volume. For assess- ment of small samples parameters special methods which extend the characteristics of the sample over the whole sample population were proposed. They are the methods of direct recounting or the methods of correction factors [7], as well as the method of rectangular contributions, as described in [8] and examined in [9]. The essence of this method is in assuming that the random variable is of fluctuating character. It is assumed that x i is not the only possible, but just the most probable value within a certain interval, so when the empirical density of xi is building, it is just a certain finite density function called “contribution“, but not a real function. The physical meaning of this construction is the assumption that the probability density is nonzero not only at the point of the variant value, but also in its closest vicinity. The method of reducing the uncertainty, the method of successive medians [10] and some other methods were also used, as described in the thesis abstract by E. B. Gorbunova [11]
Evaluating parameters, in most cases the general assumption is that the analysed value is distributed normally. In assessing the reliability of technical systems, some specific quantities are often regarded as having the exponential distribution. But this assumption often serves the purpose of simplification of the further calculations.
By applying such an approach, the interval estimation of statistical characteristics become more important then oint ones.
In the XX century (in the 60-ies), the statistical methods focused on similar tasks appeared, namely, the jackknife method (meaning a knife which can de folded), and the bootstrap method [12]. These methods are of resampling and randomization groups, that is, they allow to obtain both point and interval estimates of the original population characteristics, forming new samples based on the already available small sample.
These methods had limited application at the time of their development because of their relatively high computational complexity and lack of suitable computer equipment. They were given a new life at the end of the 20th century, when computer technologies became widely accessible [13]. The advantages of these methods include relatively high efficiency, while the drawback is the absence of strong theoretical justification.
Calculation and processing of the received data was performed using special PC programs: Python, Pandas, Numpy and JupyterNotebook
Python is a high-level general-purpose programming language designed to improve developer’s performance and code readability. It is widely used in research calculations.
Pandas is a Python library for data manipulation and analysis, used, for example, in cases of multivariate temporal series and cross-sectional data sets that are commonly found in statistics and outcomes of experiments.
NumPy is an extension of the Python language that provides additional support for large multidimensional arrays and matrices, together with a large library of high-level mathematical functions allowing operations with these arrays.
JupyterNotebook is a command shell for interactive computing. This software can be run not only by using Python, but other programming languages, as Julia, R, Haskell and Ruby. It is often used for data processing, statistical modeling and computer-aided learning. [14; 15]
Source data for the analysis. The data selected for the analysis were the failures of components installed in the An-24RV aircraft of “KrasAvia” airline. The available information on the aircraft components and assemblies was:
– product name;
– product code;
– factory code number;
– date of manufacture;
– date of repair;
– operation time since initial installation (hours);
– operation time since the latest repair (hours).
As far as the reliability of the newly-released aircraft is concerned, its non- failure operation time becomes the matter of primary importance, mainly, the non-failure time since the aircraft was first put in operation.
The available data contained information on various components and assemblies of aircraft. The selected data were those on the failures of the aircraft MA-250M pressure gauge (mainly because the amount of data on this instrument failures was well known).
The available data contained information about 3 instances of the instrument replacement (see table).
Operation time since initial installation
|
№ |
Operation time since initial installation (hours) |
|
1 |
3707 |
|
2 |
10520 |
|
3 |
3707 |
|
4 |
10520 |
|
5 |
21993 |
|
6 |
3707 |
|
7 |
10520 |
|
8 |
3707 |
|
9 |
10520 |
|
10 |
21993 |
Coincidence of the operating time for different pressure gauges depends on the events of their replacement during the aircraft scheduled maintenance.
Application of traditional and resampling methods for estimating aviation systems’ failure rate parameters . Table (above) indicates that there may be not enough data to make adequate statistical analysis. This statement can be verified experimentally by constructing statistical characteristics based on the available data.
Histogram of the original sample and estimates obtained by traditional method (fig. 1).
Mathematical expectation of mean time to failure is 10 089.40 hours.
Root-mean-square deviation is 6686.35 hours.
The given distribution is not normal. According to the estimation, 47.5 % of the gauges are installed in aircraft already being out of order or fail for the first time within 10.000 hours of operation.
The use the of resampling methods solves the problem.
We take for consideration the jackknife-method – this is one of resampling methods (linear approximation of statistical bootstrap); it is used to estimate the statistical inference error. The method works as follows: the average sample value is calculated for each element without regard for this element, and then – the average of all thus obtained values. For a sample from N elements the estimate is obtained by calculating the mean value of the remaining N –1 elements.
For assessment of this method there was developed a function generating sub-samples. Its code is given below:
-
# build the array of samples to analyze
stds=[]
foriinrange(len(manom1)):
hist,bins=np.histogram(means,bins=10)
hist_s,bins_s=np.histogram(stds,bins=10)
print(stds)
For the available sample, the same way as in the former example, statistical characteristics were developed using the following code:
-
# build the array of samples to analyze manom=list(manometers.iloc[:,2].tolist()) importnumpyasnp n=10000
means=[] stds=[]
foriinrange(n):
# means
%matplotlib inline importmatplotlib.pyplotasplt width=0.7*(bins[1]-bins[0]) center=(bins[:-1]+bins[1:])/2
The resulting distributional histogram is presented (fig. 2).
Mathematical expectation of mean time to failure with the use of the jackknife method equaled 10 090 hours.
Root-mean-square deviation was 6298 hours.
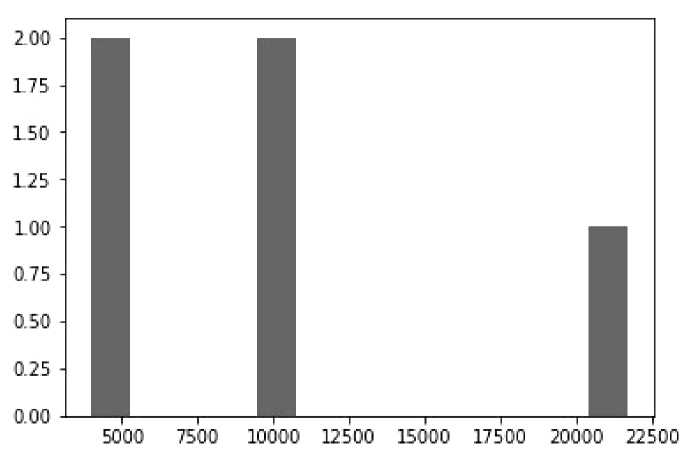
Fig. 1. Histogram of data obtained through traditional calculation
Рис. 1. Гистограмма данных при традиционном методе расчета
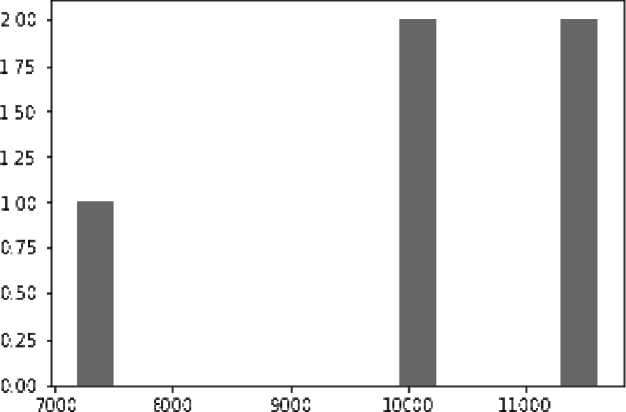
Fig. 2. Histogram obtained through the jackknife calculation
Рис. 2. Гистограмма при jackknife-методе

Fig. 3. Distribution of mean time to failure
Рис. 3. Распределение среднего времени наработки на отказ
As we see, this method is ineffective for analyzing such small-sized samples.
Here is the statistical characteristics assessment obtained through the bootstrap method.
Bootstrap method:
10000 pseudosamples were developed for the available data. The code is given below:
-
# form the sample from the source data importrandom
defform_sample(source_sample): sample_len=len(source_sample)
res_sample=[source_sample[random.randint(0,sampl e_len-1)]foriinrange(sample_len)]
returnres_sample
-
# build the array of samples to analyze manom=list(manometers.iloc[:,2].tolist()) importnumpyasnp n=10000
means=[] stds=[]
foriinrange(n):
hist,bins=np.histogram(means,bins=10)
The resulting mean operation time equaled 10 106 hours. Root-mean-square deviation for the given value equaled 2122 hours (values are rounded to integers).
Provided the given random value is of normal distribution, it could be confirmed that the mean time to failure is from 5862 to 14 350 hours at the 95 % credible level. The distribution of this value is shown in fig. 3.
It can be confirmed that mathematical expectation of mean time to failure is close to 10000 hours (more precise value cannot be obtained, because bootstrap belongs to probabilistic methods).
Conclusion . The article examines the methods of statistical analysis based mainly on computer calculations. The advantages of these methods comparing to the classical ones are that there is no need to adopt a hypothesis about the form of the distribution law of the selected random variable. Also, there is the possibility of numerical analysis for statistical parameters assessment for small data samples.
The traditional calculation of mathematical expectation of mean time to failure gives the value of 10 089 hours, which is very close to the value obtained through the bootstrap method. However, the value of standard deviation calculated for the original sample is 6686 (rounded to integers); that is quite far from the value obtained through the bootstrap method.
The bootstrap method outcome looks more plausible, although it requires further verification.
The use of traditional assessments obviously provides less accuracy: according to this estimate, 47.5 % of the pressure gauges are installed in aircraft already being out of order or fail for the first time within 10000 hours of operation.
Therefore, the bootstrap evaluation method allows to obtain more adequate estimates.
Among the disadvantages of this method is its stochastic nature (in particular, this method doesn’t provide point estimate of the mean time to failure – it slightly varies from modeling to modeling), and also the lack of strict demonstrations of its correctness.
It should be noted that further studies are needed to confirm the applicability of this method for statistical characteristics assessments concerning reliability of aircraft components and assemblies.
Currently, a software product that will make wider application of the methods analyzed in this article possible is being developed; that can help to solve specific problems airlines often come across.
Acknowledgements. The authors express their gratitude to “KrasAvia” airline for providing the data for calculation.
References Application of the bootstrap method for statistical characteristics assessment of aircraft components’ small samples
- Акимова Н. Управление коммерческой эксплуатацией на основе системы показателей экономической эффективности деятельности авиакомпании: автореф. дис. … канд. экон. наук: (08.00.14). М., 2000. С. 56-101
- Филипьева Т. Психологическое содержание труда бортпроводника воздушного судна гражданской авиации: автореф. дис. … канд. психол. наук: (19.00.03). М., 2006. С. 198-201
- Князьков П. Анализ и обеспечение надежности воздушных судов гражданской авиации в процессе их эксплуатации: автореф дис. … канд. техн. наук: (05.22.14). СПб., 2001. С. 67-98.
- Efron B. and Tibshirani R. J. An Introduction to the Bootstrap. New York: Chapman & Hall, 1993. P. 338-352.
- Гаскаров Д. В., Шаповалов В. И. Малая выбор- ка. М.: Статистика, 1978. 248 с.
