Application of the decision tree method for differentiating human groups

Author: Fedorchuk O.A., Goncharova N.N.
Journal: Archaeology, Ethnology & Anthropology of Eurasia @journal-aeae-en
Section: Anthropology and paleogenetics
Article in issue: 3 т.52, 2024.
Free access
One of the tasks of modern biological anthropology is to develop a system that could objectively classify humanity on the basis of measurements. Here, the decision tree algorithm was chosen to create a classification of groups. The method helps to evaluate the differentiating power of specific dimensions for separating samples and to assess the composition of clusters at each step of the analysis. Standard cranial measurements were used, and the entropy index was chosen as a heterogeneity measure. Classification units were 39 ethno-territorial groups from 13 major regions of the Old World. At the first step, differentiation is made between broad-faced and narrow-faced groups, demonstrating the classificatory value of this trait. The first cluster includes only Mongoloids, admixed Southern Siberian populations, and Ainu. The second cluster is heterogeneous, but its further subdivision is more in line with the traditional classification. Traits underlying the branching of the tree may be the same in different branches, evidencing their taxonomic importance. Capabilities of the decision tree method proved sufficient to construct a system largely similar to the traditional one. Certain traits separate large groups of populations, while others are efficient at the regional level. The method, therefore, can be recommended as a supplementary tool at the intraspecific level.
Short address: https://sciup.org/145147211
IDR: 145147211 | DOI: 10.17746/1563-0110.2024.52.3.148-156
Text of the scientific article Application of the decision tree method for differentiating human groups
Humanity classifications at various taxonomic levels could be developed owing to the high phenotypic polymorphism of the Homo sapiens species. Nowadays, numerous classification systems exist, each based on a different set of anthropological traits. The differences between underlying principles and selected fundamental and subordinate features are the key to such plethora and wide diversity of classifications. The main and basic requirement to such systems is their phylogenetic significance. This means that the structure devised must reflect the common ancestry of the entities in question. Nevertheless, this approach presents intractable challenges. The level of typological similarity is not necessarily indicative of kinship; therefore, in the construction of many classifications, both the geographical distribution of traits and the intrapopulation diversity of these traits are taken into account. This is reflected in the system of intragroup correlation coefficients. The features selection, as well as the interpretation of morphological similarity with consideration of the historical development of populations, trigger humanity classifications subjectivity, even at the level of major population groups.
The advancement of mathematical techniques has given rise to a new avenue in the pursuit of objective classification—numerical taxonomy. This methodology entails the comprehensive consideration of as much traits as possible and the assumption of their taxonomic equivalence. The latter is both an advantage and a significant disadvantage of any numerical classification. Nevertheless, this approach is widely employed across a range of biological research areas (Sokal, Sneath, 1963: 4; Cartmill, 2018; Hugenholtz et al., 2021).
The search for ways of objective numerical classification of human populations was first provided in the works of E.M. Tschepourkowsky (1905), and was also developed by foreign authors (Morant, 1928; Woo, Morant, 1932; Howells, 1973: 149–155; 1990: 71–79; Hanihara, 1996, 2000). In Russian anthropology, V.V. Bunak (1922) developed a numerical classification based on craniofacial features. His proposal was the use of three main diameters of the cerebral part of skull. Further work in this direction continued, involving new statistical methods (Alekseev, Trubnikova, 1984: 1–8, 115–116; Pestryakov, Grigoryeva, 2013). However, the problems of determining the taxonomic significance of different skull sizes, searching for new traits, and applying various mathematical approaches to solving this issue has not lost its relevance yet.
In order to construct a numerical classification according to skull size, correlation methods are mainly used, integrating the features into more complex structures (Alekseev, Trubnikova, 1984: 1–8, 115–116; Howells, 1990: 71–79). At the same time, there are few non-correlative methods in anthropology. Thus, the question of their applicability to the construction of anthropological classifications and the comparison of the results obtained by different methods is important.
In the present work, we use decision trees, also known as classifiers or regression trees (Breiman et al., 1984: 17; Quinlan, 1986). These names are synonymous; their use depends on the problem to be solved, since decision trees can be used either to classify objects or to construct regressions. Unlike canonical discriminant analysis, decision tree algorithm is not correlative. At the same time, unlike cluster analysis or multidimensional scaling, its mathematical apparatus does not involve the calculation of distances between objects. The possibility of using variables of different types (quantitative and categorical) in one set is also a peculiarity of the algorithm. The method’s results are simple and clear.
In general, a tree represents branches, which are dichotomously separated at a certain point (node).
Leaves are the final elements of branching. This means that branches will never merge, but will be divided into smaller and smaller sub-sets. This will produce a graph showing a multi-nodal classification tree and the final results from the classification, the leaves.
In every step of the analytical process, we can assess the discriminatory power of each dimension and the composition of the resulting linkages. It is clear that the highest differentiation occurs at the base of the tree. This allows us to understand the morphological similarity of the groups and to identify the features that make them similar. In addition, the marginal values of these features are also reflected. This method and the “random forest” algorithm generalizing it are widely used in various biological and medical studies (Wong et al., 2004; Djuris J., Ibric, Djuric Z., 2013; Feldman, 2020; Al Mamun, Keikhosrokiani, 2022).
Material and methods
The mathematical approach used in the classification tree algorithm is based on the stepwise splitting of samples with the maximum reduction of the measure of their heterogeneity. In other words, the probability of combining samples of different types is reduced. The splitting (branching) is carried out until there are no more objects of the same type left in the leaf of the tree. Thus, the criterion of sample heterogeneity at each point determines the need for further splitting. Therefore, the entropy and Gini indices are used. In this research, the former was chosen.
Shannon entropy calculation formula:
where k is the number of types; pk is the probability that an object belongs to type k .
The first branching is done on the features that distinguish the largest number of samples, the second step separates two group associations, and so on until homogeneous sets of samples remain. As a result, it is possible to get an idea of which of the features used are the most important for differentiating certain objects. Separation is based on the discreteness of the mean variation series.
The decision tree algorithm forms part of a broader methodological approach, known as random forest. Its fundamental principle is the construction of classification or predictive trees. The random forest algorithm is predicated on the preliminary stage of machine learning, whereby training and test samples are constructed. Notably, there are certain limitations to the construction of a single tree; there is no guarantee that the algorithm has chosen the optimal path. However, this method is suitable for differentiating groups based on the average values of traits. In this case, the predictive value of classification is not the key consideration, and the result obtained is clear and easily interpretable. The classification tree algorithm was implemented using the scikit-learn library in Python (Pedregosa et al., 2011).
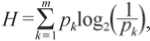
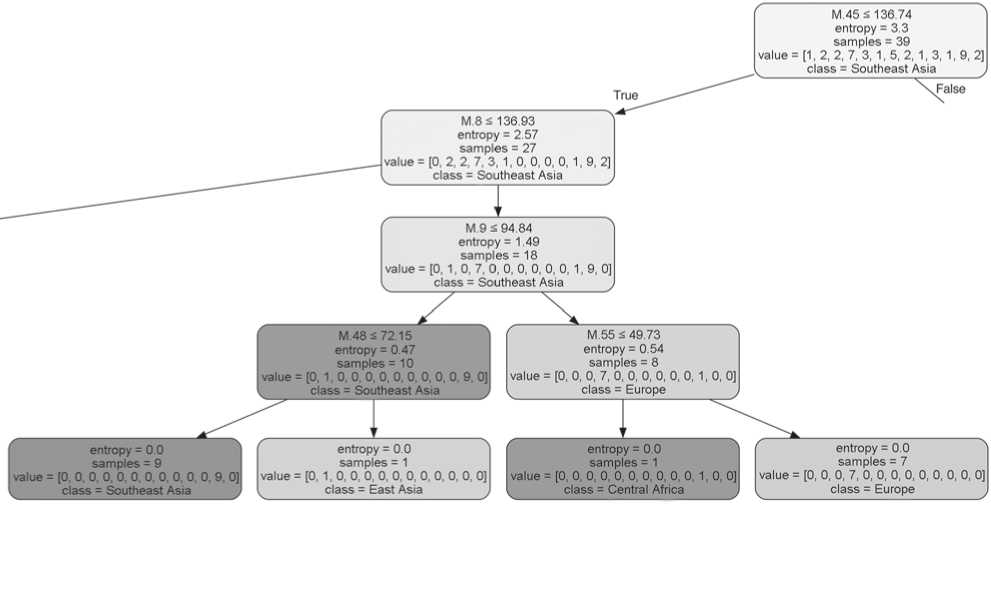
There are several differentiation parameters (Fig. 1) at each node (leaf) of the tree:
-
1) the absolute value of the feature that separates the two populations at a given level; the groups located to the left of the node in the figure have a lower value, those to the right of the node have a higher value;
-
2) the value of the Shannon entropy ( H ) for the samples divided at a given level;
-
3) the number of groups ( y ) constituting the populations at this level of segregation (samples = = n ( y ));
-
4) the number of samples in each class—the regional group we formed (value = [ n1 , n2 , n3 , … nk ]);
-
5) the dominant class at this stage of differentiation, i.e. the one with the most groups (class = macro-regional group).
Fifteen craniometric traits according to the standard methodology (Martin, 1928: 625–660; Alekseev, Debets, 1964: 52–74) were used in this work (designated according to the numbering in R. Martin’s program): cranial length (M.1), cranial breadth (M.8), cranial height (M.17), skull base length (M.5), minimum frontal breadth (M.9), frontal arc (M.26), parietal arc (M.27), occipital arc (M.28), bizygomatic breadth (M.45), midfacial breadth (M.46), facial length (M.40), upper facial height (M.48), nasal height (M.55), nasal breadth (M.54), orbital height (M.52).
The mean values for 39 ethno-territorial groups from 13 macro-regions of the Old World were used for the construction of the classification (see Table). The data were taken from literature sources. Some of the skulls from collections of the Research Institute and Museum of Anthropology (Moscow State University) and the Peter the Great Museum of Anthropology and Ethnography were measured by one of the authors. Only male skulls were included.
Results
In the initial stage of analysis, differentiation is based on bizygomatic breadth (M.45) (Fig. 1), which represents a linear dimension. The samples from Middle East, North and Central Asia, in addition to the Ainu and Khanty populations, exhibited higher values for this trait, exceeding 136.74 mm. A total of 12 samples were grouped together and designated as the “North Asia” category at this stage. The samples from Southeast, South, and East Asia, Europe, Africa, Melanesia, and Polynesia are characterized by narrower faces; this mixed group is named in accordance with the most numerous, “Southeast Asia”. The sample set consists of 27 samples.
Let us consider further differentiation within a subgroup characterized by a broader face (Fig. 2). The subsequent differentiation is based on the facial length (M.40). Four subgroups with smaller values of this trait (the class “Central Asia” plus one subgroup from Middle East) are distinguished from the remaining eight subgroups forming the class “North Asia”. The latter also encompasses the Khanty of Western Siberia and the Ainu.
The zero value of the entropy index for the class “Central Asia” is reached at the subsequent step; however, to divide the class “North Asia” into homogeneous groups, three additional steps were required, in which the values of traits M.52 (orbital height), M.28 (occipital arc), and M.9 (minimum frontal breadth) were used. As a result, we obtained
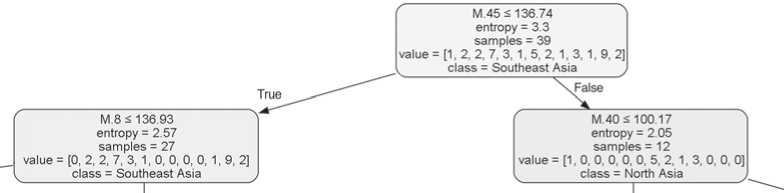
Fig. 1 . The initial stage of the analysis (differentiating by linear measurements).
The initial set of 39 groups was designated “Southeast Asia” owing to the fact that these samples constituted the majority. The content of each node is described in the text.
Groups analyzed and their origin
|
№ |
n |
Group |
Reference |
Region |
|
1 |
11 |
Teita |
(Kitson, 1931) |
East Africa |
|
2 |
39 |
Tigre |
(Sergi, 1912) |
|
|
3 |
88 |
Cameroon |
(Drontschilow, 1913) |
Central Africa |
|
4 |
24 |
Basques |
(Morant, 1929) |
Europe |
|
5 |
10 |
Bulgarians |
Data by O.A. Fedorchuk |
|
|
6 |
14 |
Italians |
" |
|
|
7 |
63 |
Armenians |
(Bunak, 1927) |
|
|
8 |
9 |
Irani |
Data by O.A. Fedorchuk |
|
|
9 |
15 |
Latvians |
" |
|
|
10 |
56 |
Ossetians |
" |
|
|
11 |
11 |
Chukchi |
" |
North Asia |
|
12 |
18 |
Eskimos of Chukotka |
" |
|
|
13 |
11 |
Aleuts |
" |
|
|
14 |
93 |
Eskimos of Alaska |
(Debets, 1986) |
|
|
15 |
11 |
Yakuts |
Data by O.A. Fedorchuk |
|
|
16 |
109 |
Kazakhs |
(Ismagulov, 1970) |
Middle East |
|
17 |
9 |
Kirghiz |
Data by O.A. Fedorchuk |
|
|
18 |
61 |
Khanty |
" |
Western Siberia |
|
19 |
26 |
Telengits |
" |
Central Asia |
|
20 |
154 |
Buryats |
Archival data by N.N. Mamonova (provided by D.V. Pezhemsky) |
|
|
21 |
17 |
Mongols |
Data by O.A. Fedorchuk |
|
|
22 |
7 |
Ainu |
" |
Far East |
|
23 |
36 |
Nepalese |
(Morant, 1924) |
East Asia |
|
24 |
32 |
Tibetans |
(Ibid.) |
|
|
25 |
22 |
Aeta |
(Bonin, 1931a) |
Southeast Asia |
|
26 |
19 |
Bantam |
(Ibid.) |
|
|
27 |
25 |
Jakarta |
" |
|
|
28 |
28 |
Dayaks |
" |
|
|
29 |
14 |
Madura |
" |
|
|
30 |
28 |
Javanese |
" |
|
|
31 |
15 |
Tagalogs |
" |
|
|
32 |
32 |
Central Java (pooled) |
" |
|
|
33 |
44 |
Burmese |
(Tildesley, 1921) |
|
|
34 |
15 |
Andamans |
(Bonin, 1931a) |
South Asia |
|
35 |
35 |
Tamils |
(Harrower, 1924) |
|
|
36 |
49 |
New Britain |
(Bonin, 1936) |
Melanesia |
|
37 |
72 |
North New Guinea |
(Hambly, 1940) |
|
|
38 |
25 |
South New Guinea |
(Ibid.) |
|
|
39 |
24 |
Easter Island |
(Bonin, 1931b) |
Polynesia |
Note. Macro-regional groups are formed on the basis of geographical criteria only.
tree leaves—homogeneous classes, comprising samples from a single macroregion: “Central Asia” (three samples), “Western Siberia” (one sample), “Ainu”, and “North Asia” (five samples). The Kazakh and Kyrgyz samples, which were initially assigned to the “Middle East” region, were subsequently divided into two distinct clusters. Interestingly, at the final stage of analysis, both samples diverged from those considered “similar” due to a larger frontal breadth (M.9). The differentiation of Middle East samples into distinct branches is attributed to variations in the facial length.
Following the initial dichotomy, additional groups exhibited increasingly narrower faces and greater
M 45 < 136 74
entropy = 3.3
samples = 39
value = (1, 2, 2, 7. 3. 1, 5, 2, 1, 3, 1, 9, 2)
4_______ class = Southeast Asia _______z \False
M 40 S 100.17 entropy = 2 05
M 9*95.87 entropy = 0.81 samples = 4 value = [0, 0, 0, 0, 0, 0, 0, 1, 0, 3, 0, 0, 0) < class = Central Asia > value = [1, 0, 0, 0, 0, 0, 5, 2,1, 3, 0, 0, 0] . class = North Asia , entropy = 0.0 samples = 3 value = [0, 0, 0, 0, 0, 0, 0, 0, 0, . class = Central Asia
entropy = 0.0
samples = 1
0, 0, 0, 0, 0, 0, 1, 0, 0, 0, 0] = Western Siberia
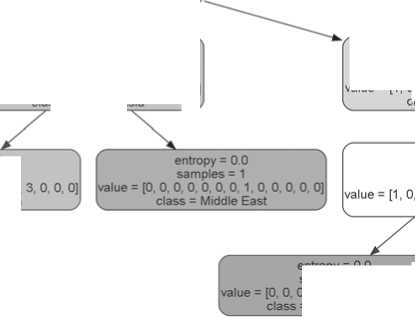
entropy. This indicated a higher level of differentiation, necessitating more complex steps for classification (Fig. 3). In the second step, the differentiating feature for this group is the cranial breadth (M.8). Then, for one of the branches, frontal breadth (M.9) proves to be a significant differentiating factor. This particular trait serves to distinguish the Asian samples from the union of European and Central African samples. The formation of homogeneous classes at the final stage is based on the measurements of height of the facial features: M.48 (upper facial height) and M.55 (nasal height). The final differentiation of populations of different macroregions of the leftmost branch of the
M 52 * 35.7 entropy =1.55 samples = 8 value = [1,0, 0, 0, 0, 0, 5, 1, 1, 0, 0, 0, 0] class = North Asia
M 28 £ 116 31 entropy =1.58 samples = 3 , 0, 0, 0, 0, 0,1,1, 0, 0, 0, 0] class = Ainu ,

entropy = 0.0
samples = 5
value = [0, 0, 0, 0, 0, 0, 5, 0, 0. 0. 0. 0. 0]
. class = North Asia .
M 9 S 94.72 entropy =1.0 samples = 2 value = (1, 0, 0, 0, 0, 0, 0, 1, 0, 0, 0, 0, 0J . class = Ainu .
entropy = 0.0 samples = 1 value = (1,0, 0, 0, 0, 0, 0, 0, 0, 0, 0, 0, 0] . class = Ainu , entropy = 0.0
samples = 1
value = [0, 0, 0, 0. 0, 0. 0. 1, 0. 0. 0. 0. 0]
. class = Middle East .
Fig. 2 . The tree branch for groups with a large zygomatic diameter, after the first dichotomy (illustrated in gray to indicate the prevalence of groups from a specific macro-regional group within a node or leaf).
Fig. 3 . Distribution of groups with a smaller
tree (Fig. 3) is conducted using a highly similar set of traits: facial length (M.40), cranial height (M.17), upper facial height (M.48), and minimum frontal breadth (M.9).
Discussion
The initial query is to ascertain to what extent the differentiation delineated by the decision tree aligns with an anthropological classification. The second, to identify the specific characteristics that were employed as the basis for the division of the total set into homogeneous groups.
The initial branching point along the bizygomatic breadth aligns with the prevailing notions regarding the importance of this feature for classification purposes. Indeed, the majority of North Asian groups within the Mongoloid lineage exhibit elevated values of facial breadth. Consequently, the initial dichotomy is a logical separation of northern and southern, more gracile Mongoloid populations. The latter are united with other samples exhibiting minimal facial breadths—those belonging to the African, European, East and South Asian, and Oceania groups. This second cluster comprises a heterogeneous array of groups. However, its further fragmentation results in an increasingly precise alignment with the anthropological classification, which is an expected outcome given that any system considers the distribution areas of populations, too. It is of interest to consider the regional associations that have diverged along different branches of the tree. Two such groups are the Middle East and the East Asian (Nepalese, Tibetan). Notably, both cases are associated with the differentiation of samples, which distribution areas fall within the contact zone of different subdivisions of humanity. The Middle East groups are of the admixed Southern Siberian lineage, while the East Asian groups originate from the region at the junction of the territories of distribution of small races belonging to the large Mongoloid lineage.
The traits that give rise to the formation of dichotomous divisions are replicated in nodes at various levels of the classification hierarchy, thus underscoring their inherent importance. The majority of these traits are typically employed for the purpose of population classification. However, there are certain traits whose significance is not immediately apparent, such as facial length (M.40) or frontal breadth (M.9).
The results obtained using the decision tree algorithm and the widely used multidimensional
zygomatic diameter, after the first dichotomy.
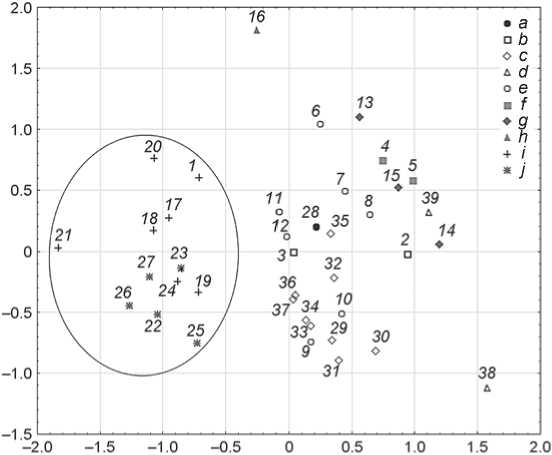
Fig. 4. The differentiation of groups on the basis of the results of multidimensional scaling.
1 – Ainu; 2 – Nepalese; 3 – Tibetans; 4 – Taita; 5 – Tigre; 6 – Basques; 7 – Bulgarians; 8 – Italians; 9 – Armenians;
10 – Irani; 11 – Latvians; 12 – Ossetians; 13 – New Britain; 14 – North New Guinea; 15 – South New Guinea; 16 – Easter Island; 17 – Chukchi; 18 – Eskimos of Chukotka;
19 – Aleuts; 20 – Eskimos of Alaska; 21 – Yakuts; 22 – Kazakhs; 23 – Kyrgyz; 24 – Khanty; 25 – Telengits; 26 – Buryats; 27 – Mongols; 28 – Cameroon; 29 – Aeta; 30 – Bantam; 31 – Jakarta; 32 – Dayaks; 33 – Madura; 34 – Javanese; 35 – Tagals; 36 – Central Java (pooled);
37 – Burmese; 38 – Andamanese; 39 – Tamils.
a – Central Africa; b – East Asia; c – Southeast Asia; d – South Asia; e – Europe; f – East Africa; g – Melanesia; h – Polynesia; i – North Asia; j – Middle East and Central Asia.
scaling method (Fig. 4) will now be compared. In this case, a Euclidean distance matrix is used. The alienation and stress coefficients were found to be 0.117 and 0.108, respectively.
The configuration of the groups within the coordinate system aligns with the classification derived from the decision tree method. It is evident that a subset of the samples from Middle East, North and Central Asia (encircled) exhibits notable separation from the remainder. Given the results of the classification tree analysis, it may be posited that the augmented distance between this cluster and all other groups was a consequence of disparities in bizygomatic breadth (M.45). The Ainu sample is also situated at the periphery of the cluster. Overall, the sample’s composition aligns precisely with that of the right branch of the classification tree (see Fig. 2).
The second, somewhat informal grouping of samples is equally indicative. The composition of this subset coincides with the left branch of the decision tree (see Fig. 3). Furthermore, the samples from Europe, Southeast Asia, and the craniological series from East Asia and Central Africa were also identified as a distinct subset. The results of the classification tree analysis allow us to conclude with a high degree of confidence that this artificial population is situated on a background of similarity in the cranial breadth (M.8). The differentiation of these disparate groups can be achieved through the utilization of minimum frontal breadth (M.9), a phenomenon that is clearly discernible within the decision tree. Furthermore, this approach permits the complete separation of these groups, whereas in the multidimensional scaling plot, two samples from Southern Europe (Irani and Armenians) fall within the Southeast Asian cluster.
Finally, at the periphery of the multidimensional scaling field, we find the groups that, within the classification tree, constituted the leftmost branch and unified the samples from Melanesia, Polynesia (Easter Island), East Africa, South Asia, and one additional sample from East Asia (Nepalese). The positioning of these clusters on the graph indicates that, in fact, they are quite disparate. For example, the samples from the Andamanese and Easter Island aborigines are situated at a considerable distance from the primary cluster, which is reflective of their uniquely distinct anthropological status.
Conclusions
The differentiation of humanity into discrete categories based on the linear measurements of skull size alone is inherently constrained by the existence of divergent differentiating characteristics across distinct geographical regions. It can thus be surmised that an attempt to divide a significant sample array using a limited set of features may not yield the desired result in all instances. Nevertheless, the capabilities of the decision tree method have proven sufficient to construct a classification that is consistent with classic notions of human differentiation. Notably, this method does not allow us to estimate the magnitude of distances between individual groups. However, it does enable us to identify the features by which samples are dichotomized up to the final stage.
Canonical discriminant analysis can be employed to ascertain the directions of intergroup morphological variability. However, it belongs to the class of correlation methods, which entails restrictions on the utilization of initial features and indices based on them, as well as categorical features, across a single set. A key advantage of classification trees is that they permit the analysis of data comprising both categorical features and indices. In conclusion, the toolkit of anthropological classification techniques has been expanded to include a further method that facilitates the acquisition of novel data and the use of disparate sets of features. Therefore, the decision tree algorithm should be proposed as an independent method of systematic classification at the intraspecific level.
Acknowledgements
This study was carried out in accordance with the research theme “Formation of Some Morpho-Functional Features of Humans in Phylo- and Ontogenesis”, as defined by the Department of Anthropology of Moscow State University, and in fulfilment of the State Assignment of the Bochkov Research Center for Medical Genetics.
