Applying Clustering to Predict Attackers Trace in Deceptive Ecosystem by Harmonizing Multiple Decoys Interactions Logs

Author: Jalaj Pateria, Laxmi Ahuja, Subhranil Som, Ashish Seth
Journal: International Journal of Information Technology and Computer Science @ijitcs
Article in issue: 5 Vol. 15, 2023.
Free access
Bluff and truth are major pillars of deception technology. Deception technology majorly relies on decoy-generated data and looks for any behavior deviation to flag that interaction as an attack or not. But at times a legitimate user can also do suspicious decoy interactions due to lack of knowledge and can be categorized under the “ATTACK” category which in a true sense should not be flagged that way. Hence, there is a need of doing collaborative analysis on honeypot, which are set up to monitor and log activities of sources that compromise or probe them. This goldmine provides ample information about the attacker intent and target, how it is moving forward in the kill chain as this information can be used to enhance threat intelligence and upgrade behaviors analysis rules. In this paper, decoys which are strategically placed in the network pointing to various databases, services, and Ips are used providing information of interactions made. This data is analyzed to understand underlying facts which can help in strengthening defense strategy, it also enhances confidence on the findings as analysis is not restricted to single decoy interaction which could be false positive or un-intentional in nature but analyzing holistically to conclude on the exact attack patten and progression. With experiment we have highlighted is reconciling various honeypots data and weighing IP visits and Honeypot interaction counts against scores and then using KNN and Weightage KNN to derive inclination of target IP against Source IP which can also be summarized as direction of Attack and count/frequency of interaction from highlights criticality of the interactions. Used KNN and W-KNN have shown approx. 94% accuracy which is best in class, also silhouette score highlighted high cohesion of data points in the experiment. Moreover, this was also analyzed that increasing the number of decoys in the analysis helps in getting better confidence on attack probability and direction.
Deception Technology, Log Data Analysis, Machine Learning, Cybersecurity, Network Monitoring, Intrusion Detection, KNN, Classification
Short address: https://sciup.org/15018949
IDR: 15018949 | DOI: 10.5815/ijitcs.2023.05.04
Text of the scientific article Applying Clustering to Predict Attackers Trace in Deceptive Ecosystem by Harmonizing Multiple Decoys Interactions Logs
Covid 19, was a trend shift where all industries have changed the way they operate. Even in the last few years there was a huge progression happening on AI front and uprise in cybersecurity compromises as organizations are not futureproofed to work in diverse and discrete networks and environment. Today, companies aim is to build a secure, resilient, and strengthened security backbone, and the expectation is threat analysis to come out of rule driven mode to behavior analysis, also progressing to collaborative behavior instead of point behaviors to gain more confidence on the analysis. Deception strategy defines Interactions and understanding of the prospective target, which in turn highlights intruder mindset and motive. Traditional deception Planning has been developed to deceive others, but rarely examined from counter-deception perspectives. To address these challenges this paper advocates a comprehensive approach to deception strategies which can be tailored to match context [1].
Growing Network and increased Internet traffic cybersecurity battlefield is becoming critical and deception technology platforms need come out of traditional point behaviors analysis and upgrade themselves from a level where it can learn from previous honeypots interactions reconciling the intelligence and can uncover various patterns related to insider attack, next probable action, and reduction of false positives. Honeypots are set up to monitor and log activities of sources which compromise or probe them. External honeypots interactions can be suspicious in nature and data generated due to intruder interaction with honeypots acts as a goldmine and provides ample information about attacker intent ended target, how it is moving forward in the kill chain as this information can used to enhance threat intelligence and upgrade behaviors analysis rules.
2. Related Works
An intrusion to the network is strategically categorized into Detection, Prevention and Hybrid techniques basis literature study. In this section, several studies in the field of Deception Technology have been analyzed.
For Example,[3] talks about malware analysis using machine learning and implementation of honeypots. With rise in IOT (Internet of Things) Detecting Behavioral Change is experimented using clustering [4]. In [5] stress has been given to increase attacker’s workload by dynamically sorting and manipulating interactions. The inability of existing deceptive systems in hiding identity due to impractical user activity is discussed in [6]. In [7] specific case of Ransomware is highlighted and dealt with situational awareness. Prediction of human performance and biases using an adaptive method is discussed in [8]. In [9], discussion was more around developing a deceptive setup combining fake data and bait attacker. Comprehensive study to gain confidence on analysis is discussed in [10]. In [11], talks about new attack trends evolved during Covid 19. Behavior modelling using behavior profiling and baiting adversaries is discussed on authentication aspects [12].
As highlighted above deception platforms are well versed to get unique highly suspicious behaviors at network and at host level. There are several efforts within the research community working to address the gap in empirical assessments of deception strategies and techniques Deception technology has evolved to a level where it can validate intruder behavior and raise various alerts to necessary teams to respond to the incident. Even detection models have evolved to confirm realistic simulations based on human behavior. An exhaustive and extensive literature study was done, and the result findings were segregated into various defense and prevention strategies. Furthermore, we validated that various algorithms are tested to get attack insights but are only restricted to specific data types and are more prone to false positives and might not be able to predict correctly. Research is still going on to ingest various multi-dimension data to generate enhanced insights.
3. Research Objective
When any suspicious activity happens in a network, I generate traces and intruder interacts with decoys of several types. Currently it is difficult to co-relate and get a good interpretation of various interactions sequences. Like an intruder IP interacting with various decoys IP’s (one-to-many relation) or various Intruder IP’s interacting with single decoys IP (many-to-one relation) [13]. Additionally, there could be too many relations getting established where many Intruders IP interacting with Many decoys IP [14]. Hence, Core objective of this research is to produce an approach where scoring and valuation of various decoys generated data on various relations patters to be established to interpret paramount trace of attack trajectory. Analysis could be fragmented to cater the ask as stated below.
-
• Validate if data of multiple decoys against an intruder interaction can be used to look for probable attack and reduce false positives
-
• Looking for a pattern in various decoy generated data against single interaction against probable insider attack.
-
• Building confidence score based on interaction series and number of decoys involved in the interaction
Honeypot data plays a vital role to enrich rules and automation on SOAR (Security Orchestration and Response) platforms. Whatever interactions happening on honeypot provides guidance on knowing enemy in a better way along with the probable network location or the area of interest for the intruder. Each honeypot is unique based on what type of service (DNS (Domain Name System), http, IMAP (Internet Message Access Protocol), ssh, telnet smtp) on which it is deployed, type of port it is running on, IP series etc. When any honeypot interaction is analyzed, it will give insights about specific instance, but we might miss vital information related to intruders or group of intruders when working in orchestration.
To understand the attack surface extensively framework is needed which can analyze various interactions of multiple decoys in a subnet, so that we can conclude on where intruders or group of intruders’ vexatious efforts are focused, this threat intel can be used to enrich SOAR platforms to work efficiently and retrain existing behavior analysis models to identify new intrusion behaviors. With this research stress has been given to understand and articulate below ask.
• What is the effect of any suspicious interaction on various decoys in and out of a subnet?
• Can interaction logs across various decoys be reconciled to get some sense of attack?
• Can various decoy logs be processed in such a manner to build confidence scoring and predict attack?
• Can prospective target be analyzed to get direction of attack intruder is progressing to?
• Can this type of various decoy data reconciliation help in reducing false positives?
4. Methodology
Threats appear in different dimensions; they can be malicious or accidental. Analysis of Interactions of external agents with decoys which are spread across the network, hosted on diverse services and ports assists in finding anomalous behavior by connecting attack series and sequences to get an attack coverage. Any interaction with decoys can be flagged as a risky attempt by validating multiple activity to raise alert to conduct further investigation to confirm if the behavior is truly malicious or just a natural progression this behavior can be fed back into the system to increase the accuracy of the behavior analysis and detection algorithm.
Various interaction outcomes like timestamps, logs, IP Source, registry entries, Cache etc. serve as debatable forensic attestation of intrusions or attack attempt into a network hierarchy. However, the information which is gathered from these honeypot interactions are based on knowledge and attackers change their approach constantly because they are continuously altering their techniques and compromise procedures [14]. The goal nowadays is not only attracting hackers with these “honeypots” but remain inconspicuous, mystify hackers, and highlight them as genuine assets [15]. Additionally, system false positives are a bigger issue, as analyzing single decoy interaction might translate to wrong judgement, hence it is required to validate an attacker interaction against various decoys and gain confidence on analysis [16].
As honeypot is strategically deployed to interact with traffic from multiple protocols and IP gives an idea as what type of service intruder is interested in, like if decoy traffic is more prominent on http which highlights intruder interest lean towards webserver also uncovers what systems are involved during reconnaissance [17].Additionally, honeypot can listen to any number of clients at the same time due to its multithreaded design number of clients per session showcases aggression of the intruder to perform attack. Data transmission volume can be evaluated by honeypots tracking all packets and its transmission rate for each connection and can summarizes if reconnaissance happened by human or bot. Its interactions can also translate sequence of steps performed by the attacker and honeypot captures it as a log helps in understanding its network dwelling pattern, general actions performed, commands executed and traverse time. This goldmine information, when co-related with multiple honeypot data, provides greater visibility to the intrusion that is going to happen and helps in immunizing the defense mechanism for any attack tracking similar behavior [18].
Finding out what intruder will do once it has gained access to the network is prime perspective to strategize network deception strategy with lucrative decoys, effective preventive measures, target location of decoys etc. also look for various other attack patterns and reduce false positives when various decoys data is reconciled to other [19]. Several types of decoys are intruded to capture respective statistics few used for this experiment are as below
Network Decoys
There is a behavior issue variation between regular user and an attacker. As a valid user enters the system, he is sure of which network location, host needs to be interacted with, the document servers or repository they need to get files from, and what are the target host they must interact remotely. Even dormant users can connect to a couple of hosts incorrectly or mistakenly, but they might not be interested to proceed as they are not confident about the source, but attacker tries to obtain more information until they are under a fear of getting exposed.
Endpoint Decoys
Remote computing device (laptops, desktops etc.) that communicates back and forth with a network to which it is connected faces multiple issues like Inability to install security patch, inability to produce logs, lateral movement blind spot and becomes vulnerable. However, a decoy file is strategically placed at various endpoints looks legitimate and fakes valuable content, is an ideal candidate to get accessed and exfiltrated with a rider of fake processes, and breadcrumbs provides an easy access pointing to endpoints as legitimate.
Application Decoys
Application deceptions facilitate setting up an internal decoy application like a web application along with database. Application deception facilitates more targets for an intruder to traverse freely in the deception environment. It is important to understand the attacker’s sequence of dwelling in the network as well as for identifying external and internal threats based on individual movement in the system.
Data Decoys
Perimeter Decoys
Perimeter breaches are considered anticipated. Once an attacker gets past certain data in perimeter defense, defense systems have no trace and become difficult in identifying and fortifying. Attackers move laterally within the organization waiting for appropriate time to act.
Decoys collaborative behavior analysis helps in identifying network attack sequences like DoS (Denial of Service), SQL Injection, Malware XSS (Cross Site Scripting) by their interaction time in network combined with packet rate enumeration. Filtering rules using Machine Learning are applied on packet data from decoys searching for unique and reoccurring patterns in each interaction. Precise filtering is required by using patterns detected current payload when corelated with existing intelligence. To detect patterns for long duration attacks, you need analysis on interactions for months. The scope of this paper is restricted to the analysis below.
• Grouping IPs with potential threat from high to low.
• Identifying if a series is a threat as a whole and the score against each IP can be used to interpret the direction of threat within series.
5. Architecture and Approach
Data from various decoys is co-related to numerous factors which will act as a feature for prediction. Below are the highest contributors for prediction.
-
• Protocol to capture traffic for, such as TCP, UDP (User Datagram Protocol).
-
• Packet filters can be used to capture only the traffic that meets specific criteria. For example, to capture traffic only from a specific IP address, you can use the filter src host
. -
• Port numbers to capture traffic for specific port numbers, such as HTTP (Hyper Text Transfer Protocol) (port 80) or SSH (Secure Shell) (port 22). For example, to capture only HTTP traffic, you can use the filter port 80.
-
• Packet size to capture only packets up to 1000 bytes.
-
• Source and destination IP addresses can help identify the origin and destination of network traffic.
-
• Timestamps to record the date and time of network events, which can help with troubleshooting and forensic analysis.
-
• Protocol information helps in getting information about the protocols used in network communications, such as TCP, UDP, HTTP, and FTP (File Transfer Protocol).
-
• User activity to capture information about user activity on the network, such as login attempts and file transfers.
-
• Network performance logs capture information about network performance, such as latency, bandwidth, and
packet loss.
Using above defined features from the dataset we shall be deriving various KPI’s like how many clusters of IPs are there which are flagged being interacted with decoys this will help us in understanding the attacker pattern and progress movement and direction in which attacker is intended to be and can help in predicting the probable attack target with enough confidence [20] Fig.1. Attacker’s IP weightage which will be uncovered with one-to-many relation, helps in interpreting that the said IP is an active attacker or the person who is an insider and have stroked to the honeypot by mistake or out of curiosity, as acting on the remote IP without ample pattern study could be a false positive and taking any action becomes extraneous. Honeypot interaction weightage against various attackers IP’s which is established with many-to-one relation assists in understanding the probable target of attack, with the interpretation that certain IP’s is getting targeted and has gained sudden interest to the attacker. Fig.1.
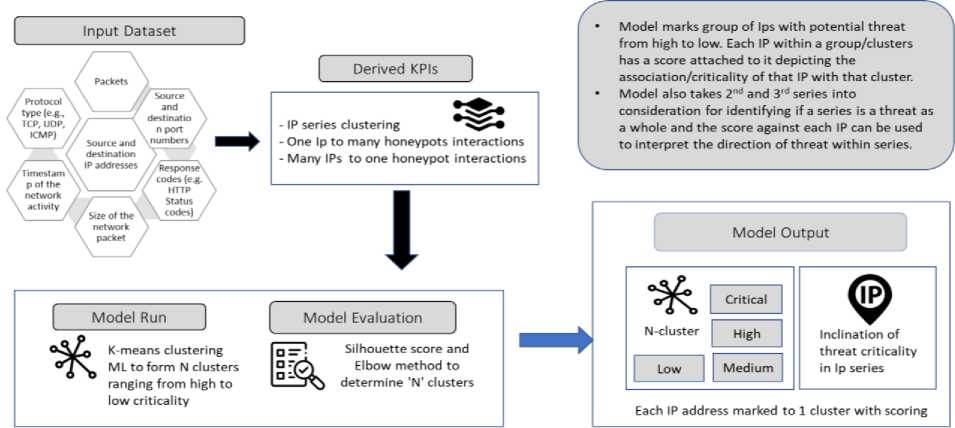
Fig.1. Overall solution workflow for collaborative analysis of decoy generated data
The data which is a multi-decoys interaction data build over the period be grouped, on intruder IP and Honeypot IP and counting the number of honeypots interacted by the IP in the network against total number of honeypots deployed in the network, Calculating the score S1 (Specific IP Honeypot Interaction Weightage) (1).
S 1 =
Number of Honeypots visited by an IP Total number Honeypots deployed to network
Calculating Score S2 (IP Specific Visits Weightage against specific honeypot) by grouping the data on intruder IP and Honeypot IP and counting the number of visits by an IP on a honeypot against total number of visits an IP made during the window. (2).
S 2 =
Number of visits by an IP on a Honeypot Total number of visits by the Intruder
Calculating score S3 (Honeypot weightage calculation) by Grouping the data on intruder IP and Honeypot IP and counting the honeypots those visits by the intruder and then Grouping the data to get the count of the intruder those engage to the honeypots (3).
S 3 =
Number of IP visited a Honeypot
Number of all IP ' s Visited a Honeypot
Merge the dataset and make a score, then applying K means Clustering and weightage K means to get the score calculation and inclination of threat criticality in IP series. Model evaluation to be performed using silhouette score which is calculating the coefficient using the mean intra-cluster distance and the mean nearest-cluster distance for the sample and elbow method which works on the concept of WCSS (Within-Cluster Sum) (4).
Number of honeypots visited by intruders Threat Criticality =
Total number of Visits on the honeypots
6. Experiment and Result Finding
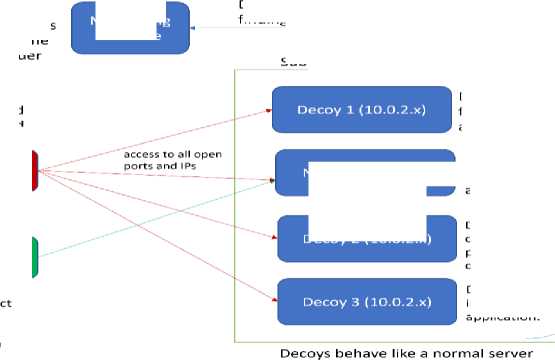
As a part of this experiment, we shall be using a VirtualBox configuring Six Virtual Machine with Eight Ubuntu
instance and a Kali Linux Instance. The type of architecture we put at its place has four machines in a Subnet Range in which 3 machines are decoy machines out of which Decoy1 has fake web login application decoy script, Decoy2 has SSH Connection decoy script and Decoy3 has Image upload decoy, all above three decoys behaves like a normal server. A normal machine on which a real web application is deployed is also placed in the same subnet as other decoys. A forwarder is placed on all decoy machines to forward the logs to a Monitoring Machine which captures, preprocesses, and processes the logs to determine the intruder and do necessary logs analysis. Fig.2.

Subnet Range 10.0.2.x
Monitoring Machine
Deployed a fake image upload application.
Deployed a real web application
Deployed a fake web login application
Detect the intruder by the findings from logs
Deployed a SSH . connection placed in
Normal (10.0.2.x)
Fig.2. Experiment Setup for harmonizing multiple decoys interactions logs
It consist the python scripts to determine the intrude
Attacker scan the network and found
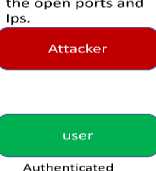
directly to the Real Machine and application

Decoy 2 (10.0.2.x)
in each decoy accessed by the intruder, logs will triggered and store in logs
When interaction happens, a real user will directly connect to correct server, but in case of a hacker which in the experiment is using Kali Linux is traversing and hitting various servers randomly creates a traces and decoy logs will be moved to Monitoring machine with the help of forwarder. Once said setup is ready below steps to be followed to conduct the experiment. The data generated with these suspicious interactions is first fed to the preprocessing where concatenation of those logs is being done. For the experiment, this data is of eight hours but for real and production purposes this analysis can be done for perennial period.
Below algorithm helps in clear articulation of the approach and identifying probable intruder IP.
Table 1. Algorithm PSEUDO code: Weightage calculation and series tracking
Input: traffic_stream_data à Merged N features of k honeypots = n’ k , n’ k , n’ k
Merging logic: Common features of k honeypots populated and uncommon marked as null
X: Transformed_features (x ,x , … x )
N: Merged features of k honeypots(∑n’ k )
X: Transformed_features(N)
T clusters of IPs & S scores of IPs ß ApplyWeightedKmeans(X)
If (T = “low” | T = “Medium”) then execute continue else take_action (IPs of T)
Trap_Intruder_IPs ß check_series_scores (S of 2 and 3 Series)
check_series_scores logic: Check pattern of Ips along with their scores within a series to target the next set of possible intruder IPs end if end procedure
As previously discussed in methodology section that there could be several types of honeypots like Web, Database etc. and data that is getting generated from those is also different. If any suspicious interaction happens relevant honeypots strategically spread across the network shall be getting an intruder interaction. Hence decoys log merging logic plays a crucial role where Common features of k honeypots (which got compromised n’ k , n’ k , n’ k ) due to intruder interaction are populated and uncommon are selected if they are supporting in the prediction. N which is Merged features of K honeypots (∑n’ k ) corelated to get X which is articulated as Transformed_features (N), T clusters of IPs and S scores of IPs which is calculated using Kmeans and Weighted Kmeans uncovers a pattern highlighting if the Intruder IP and its associated movement urgent to address, keep it in watch window or at least priority. Check series scores logic helps in understanding how deep (2 and 3 Series) attack has been targeted and till what IP level attacker has reached in which clusters are defined based on the IP root similarity.
Table 2. Output consumption and articulation
|
S. No. |
Intruder IP |
S1-h1,h2,h 3 |
S2-h1 |
S2-h2 |
S2-h3 |
S3 (h1) |
S3 (h2) |
S3 (h3) |
2nd Ser. |
3rd Ser. |
Criticality KM Score |
Criticality WKM Score |
Kmeans |
W Kmeans |
|
1 |
133.4.5.2 |
33 |
93 |
0 |
0 |
3 |
0 |
0 |
C2 |
C2 |
4.17 |
4.64 |
1 |
1 |
|
2 |
10.8.12.5 |
33 |
0 |
0 |
86 |
0 |
0 |
27 |
C1 |
C1 |
0.57 |
0.44 |
2 |
2 |
|
3 |
133.4.12.6 |
33 |
100 |
0 |
0 |
3 |
0 |
0 |
C2 |
C3 |
3.27 |
4.4 |
1 |
1 |
|
4 |
10.8.12.6 |
33 |
0 |
0 |
95 |
0 |
0 |
30 |
C1 |
C1 |
0.9 |
0.5 |
2 |
2 |
|
5 |
133.4.10.12 |
33 |
45 |
75 |
0 |
0 |
10 |
0 |
C2 |
C4 |
0.3 |
0.25 |
0 |
0 |
|
6 |
101.122.13.4 |
67 |
50 |
70 |
0 |
0 |
10 |
0 |
C3 |
C5 |
1.2 |
0.9 |
0 |
3 |
|
7 |
18.12.15.5 |
67 |
95 |
50 |
0 |
3 |
10 |
0 |
C4 |
C6 |
0.70 |
0.65 |
3 |
3 |
|
8 |
10.8.12.10 |
33 |
0 |
0 |
95 |
0 |
0 |
30 |
C1 |
C1 |
2.1 |
1.95 |
2 |
2 |
|
9 |
10.8.12.8 |
33 |
80 |
0 |
3 |
0 |
0 |
0 |
C1 |
C1 |
4.8 |
44 |
1 |
1 |
Calculating K means Table 3. and Weightage K means and calculate the distance. Table 4.
Table 3. K-means distance calculation
|
Sr. No |
0 |
1 |
2 |
3 |
min_distaince |
Clusters |
|
0 |
0.000000 |
143.710873 |
143.976118 |
130.973704 |
0.000000 |
0 |
|
1 |
0.000000 |
143.710873 |
143.976118 |
130.973704 |
0.000000 |
0 |
|
2 |
143.6454 |
3.273377 |
141.820741 |
67.112675 |
3.2733771 |
1 |
|
3 |
0.000000 |
143.710873 |
143.976118 |
130.973704 |
0.000000 |
0 |
|
4 |
143.6454 |
3.273377 |
141.820741 |
67.112675 |
3.2733771 |
1 |
Below are the takeaways from the above experimentation.
Model recommends that clusters in 4 stages of risk critical (3), high, Medium, Low. These risk factors can be recommended to engineers to take necessary action. For example: Ips in rows 2, 4 and 8 belong to same cluster with threat rating of IP2>IP4>IP8. Table 2. Fig.3.
Table 4. Weightage K-means distance calculation
|
Sr. No |
0 |
1 |
2 |
3 |
Weightage min_distaince |
Clusters by WKM |
|
0 |
0.000000 |
142.4734 |
143.9761 |
125.63638 |
0.000000 |
0 |
|
1 |
0.000000 |
142.4734 |
143.9761 |
125.63638 |
0.000000 |
0 |
|
2 |
143.6454 |
4.640197 |
141.8207 |
71.766984 |
4.6401971 |
1 |
|
3 |
0.000000 |
142.4734 |
143.9761 |
125.63638 |
0.000000 |
0 |
|
4 |
143.6454 |
4.640197 |
141.8207 |
71.766984 |
4.6401971 |
1 |
S1 score has more influence in weighted K-means ML (Machine Learning). Hence IP6 having high S1 score was marked to critical cluster. (3).
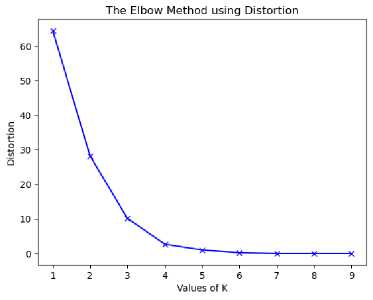
Fig.3. Result analysis using Elbow method
The interpretation of below graph highlights that plot of WCSS with the K value, the plot looks like an Elbow. As the number of clusters increases, the WCSS value will start to decrease. WCSS value is largest when K = 1. When analyzing the graph trend, we can see that the graph rapidly changes at a point and forms elbow shape. Fig.3. The silhouette value (5) is a measure of how similar an object is to its own cluster (cohesion) compared to other clusters (separation). The silhouette ranges from -1 to +1, where a high value indicates that the object is well matched to its own cluster and poorly matched to neighboring clusters. Table 5.
Silhouette Score =
b ( i ) - a ( i ) Max { a ( i ), b ( i )}
Table 5. K-means and weightage k means scores
|
K Means |
Weightage K-means |
|
0.94 |
0.93 |
Here in this case score near to 1 denotes the best, meaning that the data points or the IPs are very compact within the cluster of the timed interval of compromise window and far away from the other clusters and can be to a certain level defines active activity against a target, delta score provides an interpretation that attacker could have deflected from the real target surface due to available breadcrumbs and dwelled across the network due to persisting confusion due to decoys fake data generators.
7. Conclusions
Intrusion Detection Systems (IDS) are used in organization to screen networks in real-time and provide threat intelligence to develop a line of defense against any prospective attack. A honeypot is placed in the network cleverly and strategically aided with breadcrumbs and lures assists in uncovering various unique intrusion patterns to train behavior analysis entities effectively. But to understand and categorize attackers’ interaction with honeypot and bring good sense to the analysis, there is a need to co-relate the data what different type of honeypots generates during various interactions [21].
But in future, this research has opened the door to validate various decoys data against multiple optimization techniques like particle Swarm Optimization (PSO) etc. to even trigger fake data well evaluated as per attacker previous move instead of being operated like stubs and getting exploited back by the attackers, along with this focus should be on translating analysis to automated actions to avoid human workload [22]. Stress should be to validate various techniques that provide better handshaking between security and network performance during the attack lifecycle and early in network detection. So, to summarize from continuous improvement context for future scientific research, researchers should pay attention to the application of various consensus-based algorithms to even finetune research and analysis to stay ahead of the intruders and effectively defend against various cybersecurity incidents [23].
References Applying Clustering to Predict Attackers Trace in Deceptive Ecosystem by Harmonizing Multiple Decoys Interactions Logs
- A. Kharraz, W. Robertson, D. Balzarotti, L. Bilge, and E. Kirda, “Cutting the Gordian Knot: A Look Under the Hood of Ransomware Attacks,” in Detection of Intrusions and Malware, and Vulnerability Assessment, vol. 9148 of Lecture Notes in Computer Science, pp. 3–24, Springer International Publishing, Cham, 2015.View at: Publisher Site | Google Scholar
- A. L. Buczak and E. Guven, "A Survey of Data Mining and Machine Learning Methods for Cyber Security Intrusion Detection," in IEEE Communications Surveys & Tutorials, vol. 18, no. 2, pp. 1153-1176, Secondquarter 2016, doi: 10.1109/COMST.2015.2494502.
- Anand Handa; Rohit Negi; Sandeep Kumar Shukla, "Part I Deception Technologies & Threat Visibility – Honeypots and Security Operations," in Implementing Enterprise Cybersecurity with Open-Source Software and Standard Architecture, River Publishers, 2021, pp.3-3.
- A. Sivanathan, H. H. Gharakheili and V. Sivaraman, "Detecting Behavioral Change of IoT Devices Using Clustering-Based Network Traffic Modeling," in IEEE Internet of Things Journal, vol. 7, no. 8,
- B. K. Alese, F. M. Dahunsi, R. A. Akingbola, O. S. Adewale and T. J. Ogundele, "Improving deception in honeynet: Through data manipulation," The 9th International Conference for Internet Technology and Secured Transactions (ICITST-2014), 2014, pp. 198-204, doi: 10.1109/ICITST.2014.7038805.
- D. D. Updyke, G. B. Dobson, T. G. Podnar, L. J. Osterritter, B. L. Earl, and A. D. Cerini, “GHOSTS in the Machine: A Framework for Cyber - Warfare Exercise NPC Simulation,” 2018.Accessed: Jul. 03, 2020. [Online]. Available: http://www.sei.cmu.edu.
- D. Sgandurra, L. Mu±oz-Gonzßlez, R. Mohsen, and E. C. Lupu, “Automated Dynamic Analysis of Ransomware: Benefits, Limitations and use for Detection,” https://arxiv.org/abs/1609.03020.View at: Google Scholar
- E. A. Cranford, C. Gonzalez, P. Aggarwal, S. Cooney, M. Tambe, and C. Lebiere, “Toward Personalized Deceptive Signaling for Cyber Defense Using Cognitive Models,” Top. Cogn. Sci. ,vol. 12, no. 3, pp. 992 – 1011, 2020.
- Edwin K. Serem, David M. Mugo, and Boaz K. Too, DeceptiveDecoys: Combining Believable User and Network Activities and Deceptive NetworkSetup in Enhancing Effectiveness, International Journal of Electrical Engineering and Technology (IJEET),12(6),2021, pp. 281292.https://iaeme.com/Home/issue/IJEET?Volume=12&Issue=6
- E. Vasilomanolakis, S. Karuppayah, M. Muhlhauser, and M. Fischer, “Taxonomy and survey of collaborative intrusion detection,” ACM Computing Surveys, vol. 47, no. 4. Association for Computing Machinery, May 01, 2015, doi: 10.1145/2716260.
- J. Chigada and R. Madzinga, “Cyberattacks and threats during COVID-19: A systematic literature review,” South African J. Inf. Manag., vol. 23, no. 1, pp. 1 – 11, 2021.
- J. Kim, J. Nam, S. Lee, V. Yegneswaran, P. Porras and S. Shin, "BottleNet: Hiding Network Bottlenecks Using SDN-Based Topology Deception," in IEEE Transactions on Information Forensics and Security, vol. 16, pp. 3138-3153, 2021, doi: 10.1109/TIFS.2021 .3075845.
- Jiajia Liu; Abderrahim Benslimane, "3 Unmanned Driving Security and Navigation Deception," in Intelligent and Connected Vehicle Security, River Publishers, 2021, pp.117-165.
- Jonathan Voris, Yingbo Song, Malek Ben Salem, Shlomo Hershkop, Salvatore Stolfo, Active authentication using file system decoys and user behavior modeling: results of a large scale study,Computers & Security,Volume 87,2019,101412,ISSN 0167-4048, https://doi.org/10.1016/j.cose.2018.07.
- M. Beham, M. Vlad, and H. P. Reiser, “Intrusion detection and honeypots in nested virtualization environments,” in 2013 43rd Annual IEEE/IFIP international conference on dependable systems and networks (DSN), 2013, pp. 1 – 6.
- N. Provos and T. Holz,Virtual honeypots: from botnet tracking to intrusion detection. Pearson Education, 2007.
- N. Van Huynh, D. T. Hoang, D. N. Nguyen and E. Dutkiewicz, "DeepFake: Deep Dueling-Based Deception Strategy to Defeat Reactive Jammers," in IEEE Transactions on Wireless Communications, vol. 20, no. 10, pp. 6898-6914, Oct. 2021, doi: 10.1109/TWC.2021.3078439.
- Q. Cao, Y. Qiao and Z. Lyu, "Machine learning to detect anomalies in web log analysis," 2017 3rd IEEE International Conference on Computer and Communications (ICCC), 2017, pp. 519-523, doi: 10.1109/CompComm.2017.8322600.
- S. Allagi and R. Rachh, "Analysis of Network log data using Machine Learning," 2019 IEEE 5th International Conference for Convergence in Technology (I2CT), 2019, pp. 1-3, doi: 10.1109/I2CT45611.2019.9033737.
- William Steingartner, Darko Galinec, Andrija Kozina. "Threat Defense: Cyber Deception Approach and Education for Resilience in Hybrid Threats Model", Symmetry, 2021
- Yaoqing Liu; Garegin Grigoryan; Charles A. Kamhoua; Laurent L. Njilla, "Leverage SDN for Cyber‐Security Deception in Internet of Things," in Modeling and Design of Secure Internet of Things, IEEE, 2020, pp.479-503, doi: 10.1002/9781119593386.ch21
- Z. H. Wang, X. Wu, C. G. Liu, Q. X. Liu, and J. L. Zhang, “RansomTracer: Exploiting Cyber Deception for Ransomware Tracing,” in Proceedings of the IEEE Third International Conference on Data Science in Cyberspace, pp. 227–234, 2018.View at: Google Scholar
- Mohan, P.V.; Dixit, S.; Gyaneshwar, A.; Chadha, U.; Srinivasan, K.; Seo, J.T. Leveraging Computational Intelligence Techniques for Defensive Deception: A Review, Recent Advances, Open Problems and Future Directions. Sensors 2022, 22, 2194. https://doi.org/10.3390/s22062194
