Appropriate Tealeaf Harvest Timing Determination Based on NIR Images

Author: Kohei Arai, Yoshihiko Sasaki, Shihomi Kasuya, Hideto Matusura
Journal: International Journal of Information Technology and Computer Science(IJITCS) @ijitcs
Article in issue: 7 Vol. 7, 2015.
Free access
Method for most appropriate tealeaves harvest timing with Near Infrared (NIR) camera images is proposed. In the proposed method, NIR camera images of tealeaves are used for estimation of nitrogen content in tealeaves. The nitrogen content is highly correlated to Theanine (amid acid) content in tealeaves. Theanine rich tealeaves taste good. Therefore, tealeaves quality can be estimated with NIR camera images. Also, leaf area of tealeaves is highly correlated to NIR reflectance of tealeaf surface. Therefore, not only tealeaf quality but also harvest mount can be estimated with NIR camera images. Experimental results shows the proposed method does work for estimation of appropriate tealeaves harvest timing with NIR camera images.
Tealeaves, Nitrigen Content, Amino Accid, Leaf Are
Short address: https://sciup.org/15012317
IDR: 15012317
Text of the scientific article Appropriate Tealeaf Harvest Timing Determination Based on NIR Images
Published Online June 2015 in MECS
It is highly desired to monitor vitality of crops in agricultural areas automatically with appropriate measuring instruments in order to manage agricultural area in an efficient manner. It is also required to monitor not only quality but also quantity of vegetations in the farmlands. Vegetation monitoring is attempted with red and photographic cameras [1]. Grow rate monitoring is also attempted with spectral observation [2].
This paper deals with automatic monitoring of a quality of tealeaves with earth observation satellite, network cameras together with a method that allows estimation of total nitrogen and fiber contents in tealeaves as an example. Also this paper describes a method and system for estimation of quantity of crop products by using not only Vegetation Cover: VC and Normalized Difference Vegetation Index: NDVI but also Bidirectional Reflectance Distribution Function: BRDF because the VC and NDVI represent vegetated area while BRDF represents vegetation mass, or layered leaves.
Total nitrogen content corresponds to amid acid which is highly correlated to Theanine: 2-Amino-4-(ethylcarbamoyl) butyric acid for tealeaves so that total nitrogen is highly correlated to tea taste. Meanwhile fiber content in tealeaves has a negative correlation to tea taste. Near Infrared: NIR camera data shows a good correlation to total nitrogen and fiber contents in tealeaves so that tealeaves quality can be monitored with network NIR cameras. It is also possible to estimate total nitrogen and fiber contents in leaves with remote sensing satellite data, in particular, Visible and near infrared: VNIR radiometer data. Moreover, VC, NDVI, BRDF of tealeaves have a good correlation to grow index of tealeaves so that it is possible to monitor expected harvest amount and quality of tealeaves with network cameras together with remote sensing satellite data. BRDF monitoring is well known as a method for vegetation growth [3],[4]. On the other hand, degree of polarization of vegetation is attempted to use for vegetation monitoring [5], in particular, Leaf Area Index: LAI together with new tealeaves growth monitoring with BRDF measurements [6].
It is obvious that nitrogen rich tealeaves tastes good while fiber rich tealeaves tastes bad. Theanine: 2-Amino-4-(ethylcarbamoyl) butyric acid that is highly correlated to nitrogen contents in new tealeaves are changed to catechin [7],[8],[9] due to sun light. In accordance with sunlight, new tealeaves grow up so that there is a most appropriate time for harvest in order to maximize amount and taste of new tealeaves simultaneously.
Optical properties of tealeaves and methods for estimation of tealeaves quality and harvest amount estimation accuracy are well reported [10]-[17].The method proposed here is to determine tealeaves harvest timing by using NIR camera images together with meteorological data.
The following section describes the proposed method together with some research background. Then experimental results are described followed by some tealeaves harvest timing related discussions. Finally, conclusions are described.
-
II. Proposed Method
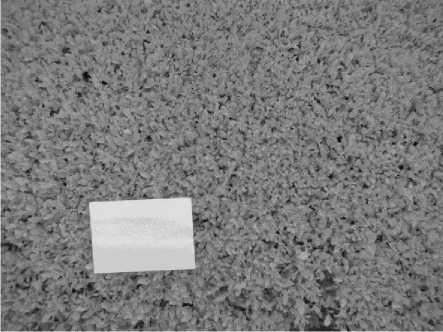
The proposed method for most appropriate tealeaves harvest timing is based on Near Infrared (NIR) camera images of tealeaves which are acquired in tea farm areas. The most appropriate tealeaves harvest timing is defined of when theanine in tealeaves and harvest amount are to be maximized. Theanine is highly correlated to the nitrogen content in tealeaves. Nitrogen content in tealeaves is proportional to NIR reflectance of tealeaf surfaces. Meanwhile, harvest amount is proportional to leaf area of tealeaves which depends on NIR reflectance of tealeaf surfaces. Therefore, theanine content in tealeaves and harvest amount can be estimated with NIR camera images. NIR reflectance can be obtained from the acquired NIR camera images if a standard reflectance panel or plaque is acquired simultaneously with tealeaves in concern. Standard panel, for instance Spectralon, is not so cheap. In order to minimize a required cost for acquisition of NIR camera images, typical print sheets are used as standard panel. Therefore, cross comparison of reflectance between Spectralon and the print sheet is needed. Fig. 1 shows acquired NIR image of Spectralon and the print sheet. Correction curve for conversion of NIR reflectance with the print sheet to Spectralon based NIR reflectance can be obtained from the acquired reflectance measured for Spectralon and the print sheet.

Fig. 1. Acquired NIR image of Spectralon and the print sheet.
Fig. 2 shows the ratio of the Spectralon based NIR reflectance and the print sheet based NIR reflectance. Fig. 3 (a) and (b) shows an example of NIR camera image of tealeaves which is acquired just before harvest together with the print sheet and of tealeaves which is acquired just after harvest together with the same print sheet, respectively.
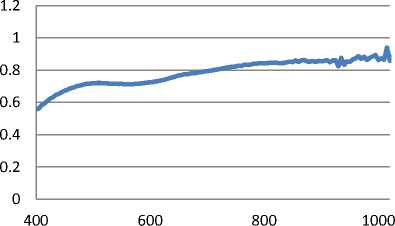
Wavelength(nm)
Fig. 2. Ratio of the Spectralon based NIR reflectance and the print sheet based NIR reflectance.
-
III. Experiments
-
A. NIR reflectance and leaf thickness, length and width
Experiments are conducted at the tea farm areas of Kakegawa in Shizuoka prefecture, Japan in both July and August time frame (first) as well as September and
October time frame (second). Usually, tealeaves are harvested three times, (1) begging in May, (2) middle in July, (3) middle in October. Therefore, tealeaves are growing in the July and August time frame while tealeaves are harvested in the September and October time frame.

(a)Before harvest
(b)After harvest
Fig. 3. Examples of NIR camera images which are acquired just before (a) and after (b) harvest of tealeaves together with the print sheet as secondly standard panel
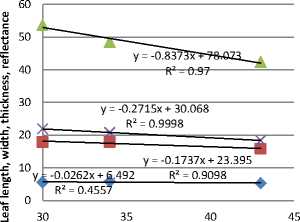
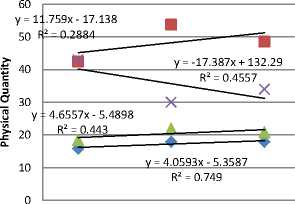
Table 1 and 2 shows NIR reflectance of tealeaves situated at the same Kakegawa tea farm areas in the July and August time frame and in the September and October time frame, respectively. Through the comparison of NIR reflectance measured in both time frames, it is found that theanine which is proportional to the measured NIR reflectance is increased for the time being. Also, it is found that the theanine is decreased for the short term periods (around one month). During the short term periods, tealeaf thickness (T), length (L), and width (W) are increased as shown in Fig. 4 (a) and (b) for the July and August time frame and the September and October time frame, respectively. Fig. 4 also shows 10 times of NIR reflectance (Ref). These relations between the date in the time frame and tealeaf thickness, length, width as well as NIR reflectance are obtained through regressive analysis results in the linear regression equation with determination coefficient R2 in the Figures where R denotes correlation coefficient.
Table 1. NIR reflectance of tealeaves situated at the Kakegawa tea farm areas in the July and August time frame
|
July 22 |
July 29 |
Aug.8 |
Aug.21 |
|
|
3 |
0.272644 |
0.338441 |
0.32357 |
0.350379 |
|
4 |
0.306725 |
0.386264 |
0.328259 |
0.315341 |
|
6 |
0.287791 |
0.327405 |
0.356396 |
0.280303 |
|
9 |
0.215843 |
0.353156 |
0.356396 |
0.297822 |
|
10 |
0.295365 |
0.320047 |
0.379843 |
0.267164 |
|
13 |
0.325658 |
0.301654 |
0.332949 |
0.350379 |
|
15 |
0.355952 |
0.371549 |
0.300123 |
0.324101 |
|
Mean |
0.294283 |
0.342645 |
0.339648 |
0.312213 |
|
Standard Deviation |
0.043982 |
0.029691 |
0.026369 |
0.032453 |
-
B. Relation between Total nitrogen and leaf thickness, length as well as width and between Nitrogen content and leaf thickness, length as well as width
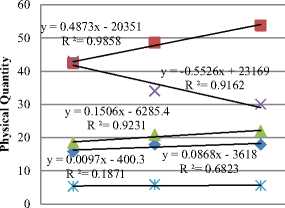
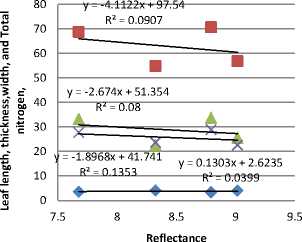
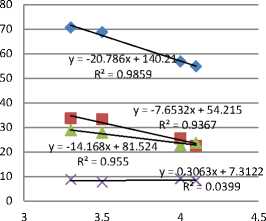
From these changes of NIR reflectance, nitrogen content in tealeaves, leaf thickness, length, and width for the time being in the July and August time frame as well as September and October time frame, it can be clarified the relations between total nitrogen content and leaf thickness, length, and width as well as NIR reflectance together with the relation between NIR reflectance and tea leaf thickness, length and width as well as total nitrogen content in tealeaves as shown in Fig. 5 and 6 for the July and August time frame, and for the September and October time frame, respectively.
Table 2. NIR reflectance of tealeaves situated at the Kakegawa tea farm areas in the September and October time frame
|
Sep. 17 |
Sep. 26 |
Oct. 2 |
Oct. 14 |
|
|
1 |
0.470422 |
0.46271 |
0.478134 |
0.393304 |
|
2 |
0.508981 |
0.474278 |
0.447287 |
0.404871 |
|
3 |
0.485846 |
0.385592 |
0.458854 |
0.439575 |
|
4 |
0.501269 |
0.428007 |
0.489702 |
0.478134 |
|
5 |
0.512837 |
0.559108 |
0.478134 |
0.512837 |
|
7 |
0.532117 |
0.539829 |
0.485846 |
0.520549 |
|
14 |
0.497413 |
0.532117 |
0.466566 |
0.520549 |
|
Mean |
0.501269 |
0.483091 |
0.472075 |
0.467117 |
|
Standard deviation |
0.19787 |
0.638157 |
0.15239 |
0.547771 |
Total nitrogen:10(%)
♦ Ref*10
■ T*100
L
X W
Linear(Ref)
Linear(T)
Linear(L)
Linear(W)
(a)Relation between Total nitrogen content and physical qualities
7-25 7-30 8-4 8-9 8-14 8-19 8-24
Date in 2014
♦ T*100
■ L
▲ W
X TN*10
ж Ref*10
Linear(T)
Linear(L)
Linear(W)
Linear(TN)
Linear(Ref)
5.2 5.3 5.4 5.5 5.6 5.7 5.8 5.9
NIR Reflectance
♦ T*100
■ L
W
X TN*10
Linear(T)
Linear(L)
Linear(W)
Linear(TN)
(a)July and August time frame
7y0 =
0.647x - 27053
R² = 0.8212
y = 0.448x - 18746 R² = 0.8208
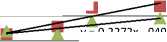
y = 0.2272x - 9496.8
y = 0.0068x - 276.74 R² = 0.7098
R² = ; 0.0169 3 y = -0.0322x + 1 351.8
R² = 0.8894
9-8 9-18 9-28 10-8 10-18
Date in 2014
♦L
■T*100
▲W
X Ref*10
ж TN
Linear(L)
Linear(T)
Linear(W)
Linear(Ref)
(b)September and October time frame
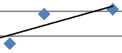
Fig. 4. Tealeaf thicknesses (T), length (L), and width (W) measured in the short term periods in the July and August time frame and in the September and October time frame
(b)Relation between NIR reflectance and physical quantities
Fig. 5. Relations between total nitrogen content and leaf thickness, length, and width as well as NIR reflectance together with the relation between NIR reflectance and tea leaf thickness, length and width as well as total nitrogen content in tealeaves for the July and August time frame
♦ TN
ZL
АT*100
XW
Linear(TN)
Linear(L)
Linear(T)
Linear(W) 线性 (W)
(a)Relation between Total nitrogen content and physical qualities
Total nitrogen(%)
оL
■T*100
▲W
X Ref*10
Linear(L)
Linear(T)
Linear(W)
Linear(Ref)
(b)Relation between NIR reflectance and physical quantities
Fig. 6. Relations between total nitrogen content and leaf thickness, length, and width as well as NIR reflectance together with the relation between NIR reflectance and tea leaf thickness, length and width as well as total nitrogen content in tealeaves for the September and October time frame
0.7
0.6
0.5
0.4
0.3
0.2
0.1
Ref
StDev*
.)
0.3 0.35 0.4 0.45
TN
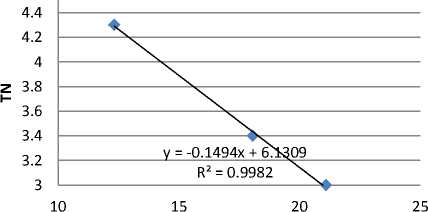
Fig. 7. Relation between total nitrogen content in tealeaves and NIR reflectance
TLWx0.1
Fig. 8. Relation between total nitrogen content in tealeaves and tealeaf volume (TLW)
Tealeaf volume is increased for the time being while total nitrogen content in tealeaves is decreased. The reason for this decreasing of total nitrogen is that theanine content in tealeaves which is proportional to total nitrogen content changed to catechine due to solar light. Also, total nitrogen content in tealeaves is proportional to NIR reflectance of tealeaf surfaces as shown in Fig. 7. Therefore, Fig. 5 and 6 are reasonable results in negative correlation between total nitrogen content in tealeaves and tealeaf volume as shown in Fig. 8.
-
C. Method for appropriate tealeaf harvest timing with meteorological data
An attempt is made for determination of most appropriate tealeaf harvest timing based on meteorological data. Tealeaf grow depends on airtemperature (sun appearance time a day) and relative humidity as well as difference between high and low airtemperature and high and low relative humidity. Water, nitrogen, fiber, caffeine, tannine, amino-acid, theanine, and vitamin C contents in tealeaves are also investigated for the harvested tealeaves which are harvested in 2011, 2012, 2013, 1nd 2014. These are correlated each others as shown in Table 3.
Although correlation coefficients are different by year by year, nitrogen content is highly and negatively correlated with fiber content while amino acid caffeine, and theanine are positively correlated. Therefore, nitrogen content in tealeaves is one of the representatives of the tealeaf quality.
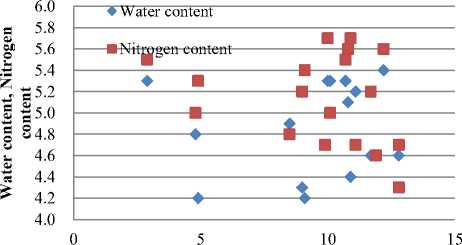
One of the examples of relations between tealeaf quality and meteorological data for 2014 is shown in Fig. 9. Although tealeaf quality is decreased slightly during 20 days from April 24 and May 13 in 2014, these are very stable enough for harvest. There seems to be no significant relation between tealeaf quality and sun appearance time and difference between high and low airtemperature. Also, there seems to be no significant relation between differences between high and low airtemperature and water and nitrogen contents in tealeaves as shown in Fig. 10. On the other hand, if accumulated sun appearance time and averaged air-temperature are taken into account, then relation between both of them and total nitrogen content in tealeaves is clarified.
Table 3. Correlations between nitrogen content in tealeaves and water, fiber, caffeine, tannine, amino acid, theanine, as well as vitamin C
|
Water content |
Fiber content |
Caffeine content |
Tannin content |
Amid acid |
Theanine |
Vitamin C |
|
|
2011 |
0.354 |
-0.977 |
0.955 |
0.848 |
0.900 |
0.8754 |
0.0363 |
|
2012 |
0.418 |
-0.976 |
0.937 |
0.570 |
0.979 |
0.983 |
-0.723 |
|
2013 |
0.473 |
-0.956 |
0.953 |
0.556 |
0.919 |
0.9123 |
-0.731 |
|
2014 |
0.0913 |
-0.949 |
0.932 |
0.848 |
0.894 |
0.860 |
-0.483 |
Fig. 11 shows relation between total nitrogen content in tealeaves and accumulated sun appearance time and averaged air-temperature since April 1 2014. Therefore, appropriate tealeaf harvest timing can be determined with these accumulated sun appearance time and averaged airtemperature when these are exceeded 300 hours and 550 degree Celsius since April 1.
♦ sun apearance time
-----X
ж ж^ЖЖ ^
жжжжжж Жжж
---А water content
ж
X fiber content
ж caffeine content
-Q tannine content
amid acid
■ theanine
2^жхж^х— Хм*ж^*жж1* vitamin C
score
♦♦♦♦♦ft»__♦$♦♦♦♦♦♦*♦
0 5 10 15 20 25
Days since Apr.24 to May 13 in 2014
Fig. 9. One of the examples of relations between tealeaf quality and meteorological data for 2014
Diff. btw Highest and Lowest Air-Temperature
Fig. 10. Relation between difference between high and low airtemperature and water and nitrogen contents in tealeaves
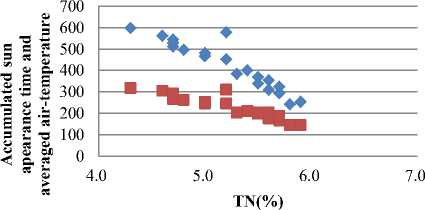
Fig. 11. Relation between total nitrogen content in tealeaves and accumulated sun appearance time and averaged air-temperature since April 1 2014
This method is applied to the tealeaf harvest in the September and October time frame. Fig. 12 shows trends of tealeaf quality of total nitrogen content in tealeaves and tealeaf volume (harvest amount) as well as accumulated air-temperature and accumulated difference between high and low air-temperature. In this case, appropriate tealeaf harvest timing can be determined as the accumulated air-temperature is exceeded around 600
degree Celsius and as the accumulated difference between high and low air-temperature is exceeded around 200 degree Celsius.
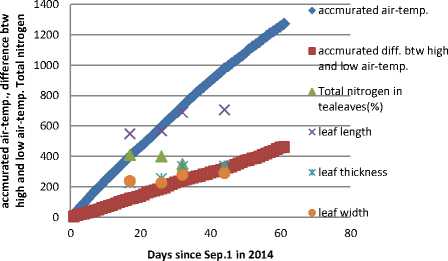
Fig. 12. Tealeaf harvest in the September and October time frame, trends of tealeaf quality of total nitrogen content in tealeaves and tealeaf volume (harvest amount) as well as accumulated air-temperature and accumulated difference between high and low air-temperature
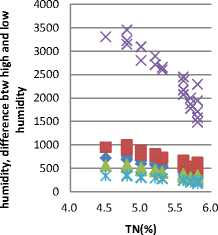
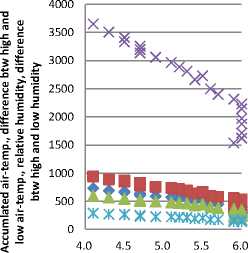
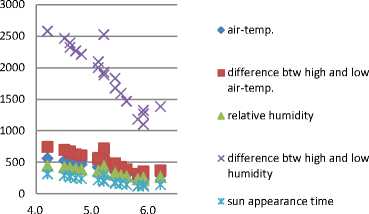
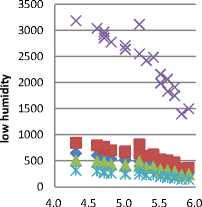
In order to determine the most appropriate meteorological data for determination of appropriate tealeaf harvest timing, relations between meteorological data and total nitrogen content in tealeaves which are harvested in 2011, 2012, 2013, and 2014 are investigated. Fig. 13 (a)-(d) shows these relations. In this case, accumulated air-temperature, difference between high and low air-temperature a day, relative humidity and difference between high and low relative humidity a day as well as sun appearance time duration a day are selected for meteorological data.
♦ air-temp.
■ difference btw high and low air-temp.
А relative humidity
X difference btw high and low humidity
Ж sun apearance time
(a)2011
♦ air-temp.
■ differnce btw high and low air-temp.
А relative humidity
X difference btw high and low humidity
Ж sun appearance time
TN(%)
(b)2012
TN(%)
(c)2013
♦ air-temp.
■ differnce btw high and low air^temp.
▲ relative humidity
X difference btw high and low humidity ж sun appearance time
TN(%)
(d)2014
Fig. 13. Relations between meteorological data and total nitrogen content in tealeaves which are harvested in 2011, 2012, 2013, and 2014
Although, in particular, appropriate tealeaf harvest timing in 2013 differ from the others, accumulated relative humidity seems reasonable and most appropriate meteorological data which allows finding appropriate tealeaf harvest timing followed by accumulated airtemperature, accumulated difference between high and low air-temperature and accumulated difference between high and low relative humidity as well as sun appearance time duration a day. Table 4 shows the averaged values of these meteorological data and standard deviation as well as the ratio of standard deviation and averaged values. Therefore, tealeaf harvest timing can be determined as the accumulated humidity is exceeded around 380 (%) since April 1 of that year.
-
IV. Conclusion
Method for most appropriate tealeaves harvest timing with Near Infrared (NIR) camera images is proposed. In the proposed method, NIR camera images of tealeaves are used for estimation of nitrogen content in tealeaves. The nitrogen content is highly correlated to Theanine (amid acid) content in tealeaves. Theanine rich tealeaves taste good. Therefore, tealeaves quality can be estimated with NIR camera images. Also, leaf area of tealeaves is highly correlated to NIR reflectance of tealeaf surface. Therefore, not only tealeaf quality but also harvest mount can be estimated with NIR camera images. The most recommendable method for tealeaf harvest timing determination is to use nitorogent content which is derived from NIR images with threshold value of 5.27 (%) of nitrogent content in tealeaves.
Table 4. averaged values of these meteorological data and standard deviation as well as the ratio of standard deviation and averaged values
|
Nitrogen |
Air-temp. |
Diff.air-temp. |
Humidity |
Diff. humidity |
Sun appear |
|
|
2014 |
5.21 |
447.220 |
587.004 |
361.713 |
2339.063 |
223.633 |
|
2013 |
5.24 |
387.983 |
509.948 |
332.857 |
1866.004 |
202.713 |
|
2012 |
5.24 |
503.261 |
653.256 |
423.279 |
2662.65 |
201.5 |
|
2011 |
5.38 |
511.725 |
685.768 |
395.779 |
2477.711 |
263.371 |
|
StDev |
0.076 |
57.361 |
77.775 |
39.45 |
340.435 |
28.890 |
|
Mean |
5.268 |
462.547 |
608.993 |
378.407 |
2336.357 |
222.805 |
|
Ratio |
0.0145 |
0.1240 |
0.1277 |
0.1043 |
0.1457 |
0.1296 |
Experimental results shows the proposed method does work for estimation of appropriate tealeaves harvest timing with NIR camera images. Also, the method for determination of appropriate tealeaf harvest timing with meteorological data is proposed. Therough four years tealeaf quality data which are represented with total nitrogen content in tealeaves and actual tealeaf harvest timing data, it may concluded that accumulated relative humidity is most appropriate meteorological data for determination of appropriate tealeaf harvest timing. It is found that tealeaf harvest timing can be determined as the accumulated humidity is exceeded around 380 (%) since April 1 of that year followed by air-temperature with 463 degree Celsius, difference between high and low airtemperature with 609 degree Celsius, sun appearance time during with 223 hour, and difference between high and low relative humidity (%).
References Appropriate Tealeaf Harvest Timing Determination Based on NIR Images
- J.T.Compton, Red and photographic infrared linear combinations for monitoring vegetation, Journal of Remote Sensing of Environment, 8, 127-150, 1979.
- C.Wiegand, M.Shibayama, and Y.Yamagata, Spectral observation for estimating the growth and yield of rice, Journal of Crop Science, 58, 4, 673-683, 1989.
- S.Tsuchida, I.Sato, and S.Okada, BRDF measurement system for spatially unstable land surface-The measurement using spectro-radiometer and digital camera- Journal of Remote Sensing, 19, 4, 49-59, 1999.
- K.Arai, Lecture Note on Remote Sensing, Morikita-shuppan Co., Ltd., 2000.
- K.Arai and Y.Nishimura, Degree of polarization model for leaves and discrimination between pea and rice types of leaves for estimation of leaf area index, Abstract, COSPAR 2008, A3.10010-08#991, 2008.
- K.Arai and Long Lili, BRDF model for new tealeaves and new tealeaves monitoring through BRDF monitoring with web cameras, Abstract, COSPAR 2008, A3.10008-08#992, 2008.
- Greivenkamp, John E., Field Guide to Geometrical Optics. SPIE Field Guides vol. FG01. SPIE. ISBN 0-8194-5294-7, 2004.
- Seto R H. Nakamura, F. Nanjo, Y. Hara, Bioscience, Biotechnology, and Biochemistry, Vol.61 issue9 1434-1439 1997.
- Sano M, Suzuki M ,Miyase T, Yoshino K, Maeda-Yamamoto, M.,J.Agric.Food Chem., 47 (5), 1906-1910 1999.
- Kohei Arai, Method for estimation of grow index of tealeaves based on Bi-Directional reflectance function: BRDF measurements with ground based network cameras, International Journal of Applied Science, 2, 2, 52-62, 2011.
- Kohei Arai, Wireless sensor network for tea estate monitoring in complementally usage with Earth observation satellite imagery data based on Geographic Information System(GIS), International Journal of Ubiquitous Computing, 1, 2, 12-21, 2011.
- Kohei Arai, Method for estimation of total nitrogen and fiber contents in tealeaves with ground based network cameras, International Journal of Applied Science, 2, 2, 21-30, 2011.
- Kohei Arai, Monte Carlo ray tracing simulation for bi-directional reflectance distribution function and grow index of tealeaves estimation, International Journal of Research and Reviews on Computer Science, 2, 6, 1313-1318, 2011.
- K.Arai, Monte Carlo ray tracing simulation for bi-directional reflectance distribution function and grow index of tealeaves estimations, International Journal of Research and Review on Computer Science, 2, 6, 1313-1318, 2012.
- K.Arai, Fractal model based tea tree and tealeaves model for estimation of well opened tealeaf ratio which is useful to determine tealeaf harvesting timing, International Journal of Research and Review on Computer Science, 3, 3, 1628-1632, 2012.
- Kohei Arai, Method for tealeaves quality estimation through measurements of degree of polarization, leaf area index, photosynthesis available radiance and normalized difference vegetation index for characterization of tealeaves, International Journal of Advanced Research in Artificial Intelligence, 2, 11, 17-24, 2013.
- K.Arai, Optimum band and band combination for retrieving total nitrogen, water, and fiber in tealeaves through remote sensing based on regressive analysis, International Journal of Advanced Research in Artificial Intelligence, 3, 3, 20-24, 2014.
