Artificial Neural Networks for Earth-Space Link Applications: A Prediction Approach and Inter-comparison of Rain-influenced Attenuation Models

Author: Joseph S. Ojo, Chinedu K. Ijomah, Shittu B. Akinpelu
Journal: International Journal of Intelligent Systems and Applications @ijisa
Article in issue: 5 vol.14, 2022.
Free access
The impact of rain-influenced attenuation (RIA) has a more pronounced effect as frequency increases, especially in the tropical zones with heavier rainfall than the temperate zones. The International Telecommunication Union (ITU) has recommended a universal model which may not fit well in this tropical region due to the temperate data used to develop the model. It is therefore necessary to adopt locally measured data to develop a suitable model for each region, as also recommended by ITU recommendation 618-13. The experimental site for this study is at the Department of Physics, Federal University of Technology, Akure, Nigeria (7.299° N, 5.147° E) in the tropical rainforest region of Nigeria. In the present work, the backpropagation neural network (BPNN) of the artificial neural network (ANN) is trained based on time-series rain rates data collected between 2015 and 2019 to predict time-series RIA. Based on four inputs (rain rate, rain heights, elevation angle, and polarization angle), the generated data was subjected to training, validation, and testing. The ANN was further trained using the Levenberg-Marquardt algorithm to fit the inputs and the targets to create a dynamic model for RIA forecasting. Further validation was tested using actual data of rain attenuation from a Ku-band beacon at the site. Subsequently, the RIA model created by the ANN was compared to those generated using the synthetic storm technique, ITU, and the actual rain attenuation obtained from a beacon measurement. The highest rain rate observed was about 225.8 mm/hr with a corresponding rain attenuation of about 61 dB as estimated by the SST model and about 68 dB by the ITU model, while the predicted attenuation by the ANN is 55 dB. This implies that an extra power of 6 dB and 13 dB is added by the SST model and ITU model, respectively, for the downlink signal, to compensate for the rain attenuation link. The results also reveal that during 0.01 percent of an average year that signal may be attenuated, a relatively tiny margin of error between anticipated rain attenuation using ANN and the SST model is exceeded. In general, the new ANN-generated RIA model had the lowest root mean square error, average relative error, and standard deviation at the selected time percentages, according to the model validation. Hence, the new ANN model can predict more effective RIA in the region when compared with the global ITU-R model.
Artificial Neural Networks, intercomparison of models, synthetic storm techniques, tropical regions, Earth-Space Links
Short address: https://sciup.org/15018971
IDR: 15018971 | DOI: 10.5815/ijisa.2022.05.05
Text of the scientific article Artificial Neural Networks for Earth-Space Link Applications: A Prediction Approach and Inter-comparison of Rain-influenced Attenuation Models
Published Online on October 8, 2022 by MECS Press
In the last few decades, communication technology has advanced dramatically, generating congestion in lower bands of the spectrum and demanding the use of higher-frequency (HF) bands. In addition, the benefits provided by HF bands are gaining the attention of industry and researchers [1-5]. HF bands are linked to a wide bandwidth, frequency reuse, short wavelength, interaction with atmospheric elements, and low foliage penetration, especially in dense green vegetation [6, 7]. The introduction of 5G and, eventually, 6G technologies results in increased bandwidth, faster speeds, and lower latency of 1 millisecond or less. However, rain is the most significant signal transmission obstacle in radio communication systems, especially when transmitting at near 10 GHz frequency bands, and it occurs more frequently in tropical areas [8, 9]. High rain intensity is seen in the tropical area, which is frequently accompanied by severe downpours and thunderstorms [10]. Considering the interruption caused by rain and other associated hydrometeors, it becomes necessary to lessen the effect of rain attenuation on signals to achieve good quality in the faster speeds, and lower latency of 1 millisecond or less. However, rain is the most significant signal transmission obstacle in radio communication systems, especially when transmitting at near 10 GHz frequency bands, and it occurs more frequently in tropical areas [8, 9]. High rain intensity is seen in the tropical area, which is frequently accompanied by severe downpours and thunderstorms [10]. Considering the interruption caused by rain and other associated hydrometeors, it becomes necessary to lessen the effect of rain attenuation on signals to achieve good quality in the propagation paths. Hence, a dynamical measure is needed to corroborate the fade prediction models to forecast the condition of the propagation link in addition to the existing models. Consequently, such a measure will ensure the availability of good quality signals even under intense bad weather conditions. The main goal of this paper is to create a countermeasure model based on the backpropagation neural network (BPNN) of the artificial neural network, which has taken into account all the characteristics of BPNN that can forecast rain-influenced attenuation (RIA) along the propagation links under intense tropical weather conditions. Most of the previous models are developed based on data generated from temperate regions, which may not fit well in the tropical zones like Nigeria.
In recent times, researchers have shifted focus to the application of machine learning (ML) for forecasting the future occurrence of events. ML is associated with a variety of benefits, such as automation, applications in different fields of study, and the ability to handle large data banks. Although it is time-consuming and requires more resources, the benefits outweigh the drawbacks. An artificial neural network (ANN) is rapidly gaining attention in machine learning (ML) due to its ability to tolerate faults, produce output even with insufficient data or information, and simplicity [11, 12]. Based on recent studies, the ANN can produce an acceptable output after training even with insufficient data [13]. Among the types of ANN, the backpropagation neural networks (BPNNs) have several advantages, such as simplicity, being very fast and easy to program; being very flexible, only depending on the input; and working well. In order to achieve the best from BPNN, a locally derived dataset should be used for optimum performance, hence the additional reason that necessitated this study.
In this study, BPNNs are used to forecast new rain-influenced attenuation (RIA) prediction algorithms in order to develop efficient mitigation measures for signal deterioration in tropical environments. The other sections of the paper are organized as follows: Section two provides a summary of past work while including the ANN unit; section three examines the approach taken; section four contains the results and discussion; and section five concludes.
2. Brief on Previous Work and the ANN Tool
An artificial neural network was primarily designed to focus on biological processes and their applications to artificial intelligence [14]. As a follow-up to the applications of neural networks to intelligence algorithms, most of the rain intensity related studies based on ANN are directed towards weather forecast and hydrology [15, 16]. For example, according to [13], the BPNN, as well as other types of neural networks, can be used to predict rainfall with better results than statistical and numerical methods. Others, such as [17], employed ANN on a three (3) year rainfall intensity to develop a model for 30-second intervals between a time (t-2) and a time (t). When given three neighboring historical rain rates, the developed model produces better future rain rate values. [18] have also proposed two neural network models for forecasting monthly rainfall rates. From the data from 2001 to 2013, the suggested model's performance was evaluated for a few selected places. The experimental results reveal that the first model's mean square error (MSE) accuracy is substantially superior to the second model's MSE accuracy. However, both models tend to perform better when rainfall fluctuation is low. [19] utilized the ANN model in computing for rain attenuation at 25 GHz and comparing the output result with the ITU-R model. The RIA was calculated theoretically using ITU-R P.618 and compared with the RIA generated based on the ANN algorithm. In comparison to the ITU R model, it was inferred that the ANN model is comparatively better. Theoretical and practical values are compared in the studied location, but the artificial neural networks gave the best results in their research.
Based on data from South Africa (subtropical region), [20] created long-term RIA databanks derived from rain rates generated using ANN and compared them to real and ITU-R models. The results show that the trained ANN can effectively forecast signal losses in the region during heavy rain events. [21] also applied a semi-empirical approach based on exceedance of rain rate, size distributions , of raindrop and scattering properties to propose a model for RIA using the ITU-R technique. Both the rainfall data and the RIA generated were used to train the ANN. The results obtained were compared with already established results from ITU and the MSE and showed that the ANN prediction model is effective in predicting rain attenuation. [22] applied a neural network-based rainfall prediction algorithm to three years of rainfall data. The model was created as part of their research and accurately forecasted rainfall rates in a sliding window configuration. The model shows that a BPNN can be trained and be adopted to formulate RIA on an earth-satellite communication link. The majority of the aforementioned works were carried out using data from temperate and subtropical regions, with only a few from tropical regions, which may not perform well in tropical regions with high rainfall intensities, such as Nigeria. This is the motive behind this study.
The BPNN is a sort of ANN that uses the error rate of the previous epoch to adjust the weights of a neural network. The rates at which the error occurs can be reduced by adjusting the weights, which enhances the model's generalization and reliability [23]. The method can be used to calculate the gradient of a loss function when all of the network's weights are considered. Fig. 1 shows a representation of the ANN computing network's training structure. The summing unit presented in Fig. 1 is categorized into two sections: the part that integrates the data, p, which is the summing unit; and the end result, f, which produces the outcome of the neuron section. The sigmoid function produces the most frequent refreshing part, and it has the advantage of error function differentiability and continuity during network training. The integration and activation pat for the BPNN are described as:
EN wi n=1 n n
n can take the form of 1, 2, 3, . . ., N
and
f (p)=I+Tp where p is the part that integrated the data, b denotes the bias input, f represents the refreshing function, N is the available number of inputs, wn denotes the weight of nth order, and in is the input of n th order.
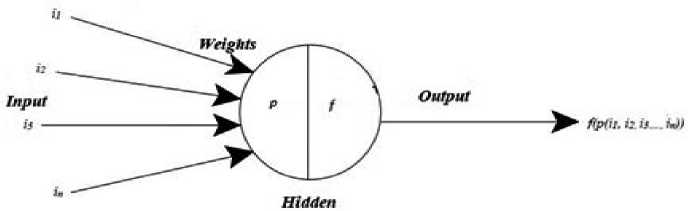
Fig.1. Training structure of an ANN computing units with BPNN features
Summing up the activation function gives the expected output of the BPNN. An error, E r is computed to obtain the network performance evaluation as:
E r = 21 y ( Q - Q t )
where Q t denotes the expected output, Qs is the expected end results and J is the total number of the data. The errors generated in equation (3) are reduced by taken the derivate of the total error as:
d E totai d Qt
- ( Qs - Qt )
The following expressions can be used to update the associated weights, based on an optimized weight vector, w that provides the lowest error part:
fa e a e a e a e
A E = i —, —, —.......,—
(5 w1 a w 2 a w з a w
and
л ■ 5 E
A wi = n d Q1
i = 1, 2, 3, . . ., i
where n is the rate at which the algorithm learnt, i denotes the feed-in data, Δ wi is the weight change on the i th feed-in data and the output controls the i th input.
From equation (3) error function with 7 E = 0 for prediction of the targeted time-series RIA Ap(t + 1) dB is given by [6].
A p ( t + 1) = f ( A t ( t - 3)), A t ( t - 2), A t ( t - 1), A t ( t )
where A t (t) denotes the expected RIA at time t, A t (t-1) is the expected RIA at time (t – 1), A t (t – 2) is the expected RIA at time (t – 2), R t (t – 3) is the expected RIA at time (t – 3).
3. The Approach for the Study
The data was collected at the Federal University of Technology's Department of Physics in Akure, Ondo State, Nigeria (7.299° N, 5.147° E; 328 m). An automated vantage-vue weather station (AVVWS) was used to collect the data, which includes a sleek yet durable outdoor Integrated Sensor Suite (ISS) and a comprehensive console (with datalogger). The AVVWS collects the rain rate among other parameters every 10 seconds and integrates it over 1 minute. The data used was collected over a period of four years (2016–2019). Due to the paucity of space, details of the equipment set up are not iterated here due to the paucity of space but are available in the work of [24]. The total number of training data points used was 102,868. The datasets were further divided into three parts, consisting of 70%, 20%, and 10% for training, validation, and testing, respectively. The artificial neural network was trained using the Levenberg-Marquardt algorithm to fit the inputs and targets using equations (1) and (2). Further validation was tested using actual data of rain attenuation from a Ku-band beacon installed at the same department.
The ANN was created using a feed-forward backpropagation neural network learning algorithm with other network parameters. After the ANN object has been created, it is therefore trained with the four inputs data, which is the rainfall rate data collected from the Physics Department and the corresponding SST-generated rain-influenced attenuation others are the rain heights, elevation angle, and polarization angle. The ANN continues to learn the correlation between the rainfall data and the corresponding attenuation values until the performance goal is met. When the generalization stops improving, as evidenced by a rise in the mean square error of the validation samples and the target values, the training ceases automatically. The correlation between outputs and targets is then calculated to see whether the current output may be utilized to forecast future rain attenuation at time (t + 1).
The predicted rain attenuation based on equation (7) is a time-series RIA which is intercompared with the attenuation generated using a time-series model proposed by [25] known as synthetic storm techniques (SST).
The vertical structure of rain in SST is divided into two layers: layer A (hydrometeors in the form of rain drops) and layer B (water droplets arising from the melting of hydrometeors) as presented in equation (8). Additional comparison was made with the ITU-R P.618-13 [26] for predicting RIA exceedance for various time exceedances.
A(t) = kR (t)La + г^'КвК^" (t)(Lb - La ) (8)
where A(t) is the time series RIA, RαA(t) is the time-series rain rate at rain layer A , RαB(t) is the time-series rain rate at melting layer B , L A and L B are the slant paths at layer A and B , respectively. a A , and k A are the constant that are estimated for layer A (where the temperature of precipitation is 20 °C as reported by the ITU-R Recommendation P.838-3 [27] and a B , and kB are the constant that are estimated for layer B (where temperature of the precipitation is 0 °C as stated by [28].
To determine the appropriate allowance for the signal fading in the propagation path, the ITU-R model and SST time-series of RIA were compared with the time-series of RIA generated by the ANN, which will provide information on different percentages of parameter exceedance for an average year using the complementary cumulative distribution functions (CCDTs).
4. Results and Discussion
Based on the datasets generated using the BPNN, the analyses are discussed and presented in this section. This allows us to have coherent results and discussion on the output of the BPNN based on ANN, the model generated, model comparison and validation.
-
4.1. Output of the ANN
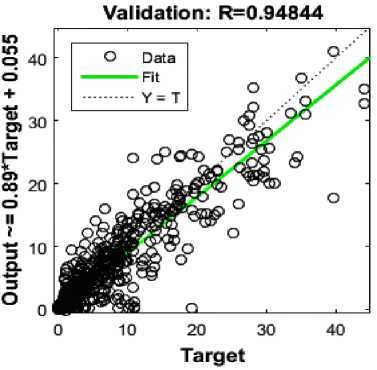
The performance function chosen for this ANN training is the Mean Squared Error (MSE). The MSE assists in data training tracking to ensure that the error gradient decreases at every iteration, up to a specific error function limit. The performance plot based on Fig. 2, while the training, testing, the training, testing and validation performance plots are presented in Figs. 3, 4, and 5, respectively. The prime mapping of the end results and the target at epoch 7 out of 13 epochs with a MSE of 0.84168 was the best performance attained during the ANN training, as shown in Fig. 2. This implies that as the training progressed, the error became constant after the seventh epoch, which is the reason the ANN came to an abrupt end at the thirteenth epoch, producing an enhanced weight vector at epoch 7. Based on the plots (Figs. 3, 4, 5), the dotted lines indicate a situation whereby the real neural network end results are equal to the expected values while the solid lines represent the best fit linear regression between the end results of the actual and targets. It is noted that a regression coefficient of greater than 0.9 shows a good fit between the outputs and their related targets, as indicated in Figs. 3, 4, and 5. Following successful prediction training, the data for the input weight matrix (IW1_1 and IW1_2) in equations (9 and 10) and the output weight from hidden layer to output layer (LW2_1) in equation (11) were obtained. In addition, equations (12) to (13) show the optimum bias input to hidden and output layers, b1 and b2, respectively.
The correlation between the ANN predicted output and the SST predicted output is shown in Fig. 6. The correlation reveals that there is a significant and positive relationship between the two-model variables as they both move in the same direction with a correlation value of about 0.9835.
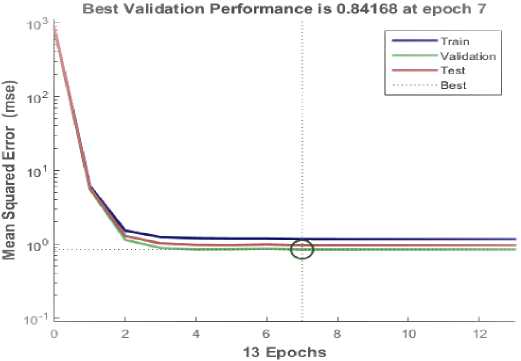
Fig.2. Performance plot based on MSE
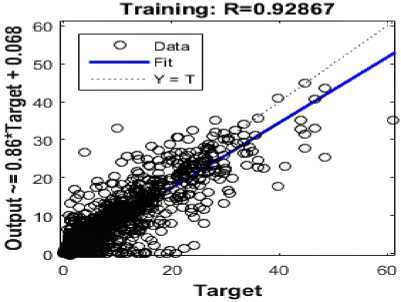
Fig.3. Training Performance
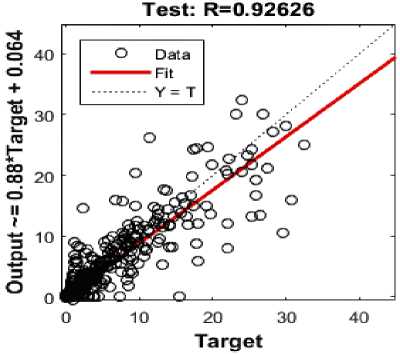
Fig.4. Test performance
|
"- 0.4079 |
- 0.7167 |
0.2871 |
- 0.4896 |
0.7659 |
0.0380 |
- 0.2337 |
- 0.3181 |
- 0.4439 |
0.8331 |
||
|
0.2693 |
- 0.0495 |
0.5084 |
0.1496 |
0.4024 |
0.4527 |
0.6815 |
- 0.2036 |
- 0.2433 |
- 0.2456 |
||
|
- 0.5581 |
- 0.1194 |
0.3779 |
- 0.4716 |
0.0641 |
0.7067 |
0.8453 |
- 0.3357 |
- 0.3169 |
- 0.6217 |
||
|
IW 1 1 = ^^^™ |
0.4350 |
- 0.0912 |
- 0.1485 |
- 0.0574 |
0.1850 |
0.0197 |
0.5491 |
0.6911 |
- 0.4782 |
- 0.7753 |
|
|
0.9775 |
- 0.6772 |
0.0951 |
- 0.0220 |
- 0.2614 |
0.4413 |
- 0.0058 |
- 0.7730 |
- 0.3429 |
- 0.3843 |
||
|
0.9349 |
- 0.5123 |
- 0.2006 |
0.4829 |
- 0.2423 |
0.2211 |
- 0.1348 |
- 0.7142 |
0.7697 |
- 0.1228 |
||
|
0.0953 |
- 0.6411 |
0.3576 |
- 0.9142 |
-- 0.1181 |
0.0663 |
- 0.5230 |
- 0.6080 |
0.6990 |
- 0.4587 |
. |
Fig.5. Validation performance
IW 1 2 =
0 . 2116 0 . 0320
0 . 2808 - 0 . 9117
-
- 0 . 3888 - 0 . 3630
-
- 0 . 6166 0 . 4753
0
.
5295
-
1
.
0620
-
- 0 . 2226 0 . 4065
-
- 0 . 2710 0 . 3900
0
.
9385
0
.
3375
0
.
7108
0
.
5550
LW2_1 = [0.0008 0.4213 -1.2480 - 0.1856 0.3683 -1.0974 1.5954]
b1 =
1 . 6504
1 . 0537
1 . 9748
b 2 = [ - 0 . 6250 ]
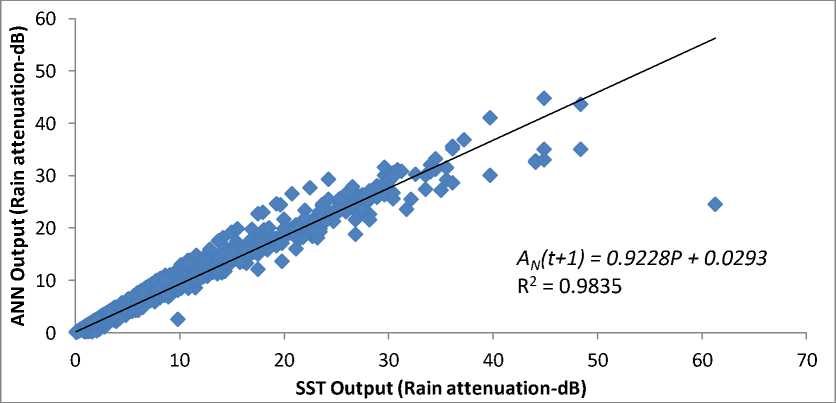
Fig.6. The ANN projected output and the SST outputs are correlated.
The implication is that the correlation presented in Fig. 6 can be utilized to forecast future attenuation at a given time A N (t+1) . A model is therefore generated for the relationship in the form of:
AN ( t + 1 ) = cAs ( t ) + d
where c and d are the regression parameters whose values are 0.9228 and 0.0293. A s is the attenuation from SST. Based on the SST of equation (8), the link attenuation of the location study at a predicted time (t+1) to modify the SST for the location is given as:
An (t + 1) = TLa + ф(Lb - La )
where
T = k A R p ( t + 1 ) “ A (16)
and ф = /^-квКр (t + 1)aB (17)
-
4.2. Complementary Cumulative Distribution Functions of RIA for ANN Predicted Model, SST Model and ITU-R Model
0.0001 0.001 0.01 0.1 1 10 100
-
4.3. Time Series RIA Prediction and Model Validation
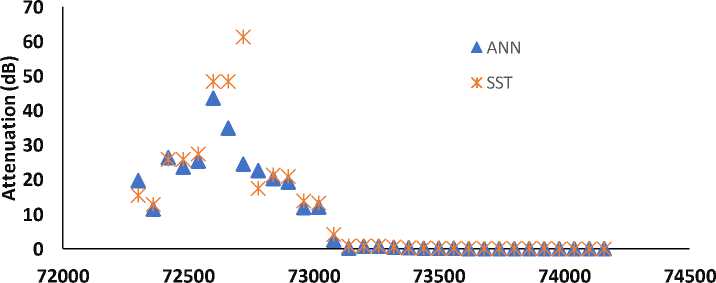
The suitability of the trained neural network and the SST model was tested on different rain attenuation values. The suitability of the proposed model in the prediction of RIA for mitigating signal degradation is demonstrated using five attenuation classes at thresholds of 10, 20, 40, and 60 dB. The applicability of the developed model based on ANN and the SST model was examined for varied rain attenuation settings. The categorizations of the attenuation are presented in Table 2. On April 24th, 2017, between the hours of 8:00 am and 8:30 am, the peak rain rate was 225.8 mm/hr on the selected day as seen in Fig. 7. The events are shown in Figs. (9, 10), respectively. It was observed that five categories of attenuation classes are seen up to the maximum attenuation class, which is level 5. When the anticipated attenuation class exceeds the real, it is regarded as safe since attenuation is overestimated, implying that an appropriate mitigation strategy will be adopted. The results show that the ANN model can successfully forecast deep fades on the propagation link, which is particularly relevant for the good quality of signals.
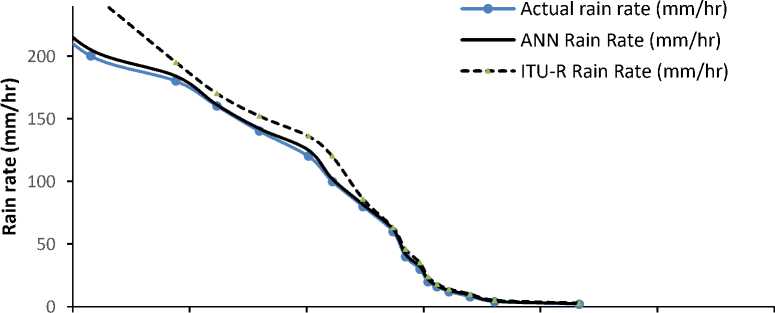
The Complementary Cumulative Distribution Functions (CCDFs) provide information for various percentages of parameter exceedance for an average year, which aids in determining the acceptable margin for signal loss along the propagation link. The parameter that is of great importance is the rain rate, which is exceeded for 0.01% (R 0.01 ) and 0.001% (R 0.001 ) of time in a year. Fig. 7 presents the CCDFs of rain rate at different time percentages for actual rain rate, ANN predicted rain rate, and ITU rain rate. It was observed that the average rain rate exceeded for 0.01% of the time was about 104 mm/hr and about 106 mm/hr for the actual and ANN output rain rates, respectively. The ITU model gives about 132 mm/hr. It can be affirmed that the ITU model overestimated rain rate values in this region. It is also seen that the highest recorded rain rate is about 225.8 mm/hr. Table 1 presents typical results of the rain attenuation generated using BPNN, SST, and ITU-R model at different time percentages. Fig. 8 also presents the results of CCDFs of intercomparison of rain attenuation obtained through the SST model, ANN technique, and ITU-R model. In general, as the time percentage increases, the attenuation value decreases, with the ITU-R model agreeing with the ANN and SST values at time percentages greater than 0.05% of time, while the ITU model overestimated at 0.01% and 0.001% of time when compared to the ANN and SST models. For example, at 0.01% of the time (which is equivalent to about 52.6 minutes of signal outage in a year) the attenuation is about 21.2 dB as predicted by ANN, while the value is about 23. 1 dB as generated using the SST and 26 dB as generated by the ITU-R model. This produces about 1.9 dB differences between the ANN and SST models and about 4.8 dB between ANN and ITU-R models, with a percentage difference of about 22.6% between the highest and lowest attenuation observed within the models. At 0.001% of the time, the percentage differences can be as high as 64%. The magnitude of the additional attenuation in dB can result in serious signal degradation and, if not properly compensated, may lead to total signal outage along the propagation path.
Percentage abscissa exceeded
Fig.7. Rain rate CCDF (2016 – 2019)
Table 1. Rain attenuation exceeded generated based on ANN, SST and ITU-R model
|
% |
A p (t +1) BPNN output (dB) |
A p (t +1) SST Model (dB) |
A p (t +1) ITU-R Model (dB) |
|
1 |
0.1 |
0.1 |
1 |
|
0.1 |
6 |
6 |
8 |
|
0.01 |
26 |
30 |
18 |
|
0.001 |
44 |
48 |
29 |
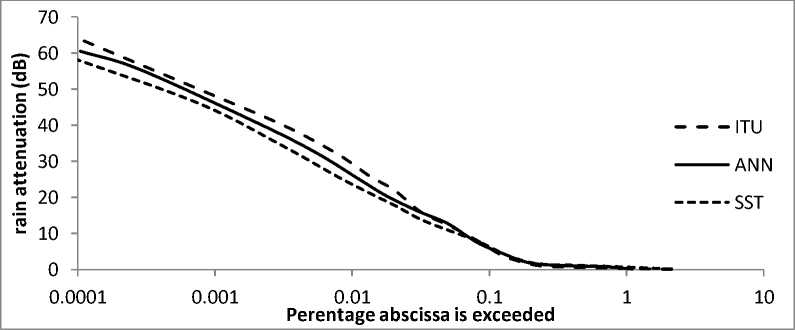
Fig.8. Comparison of CCDFs of RIA for SST, ANN and ITU models.
Table 2. Rain attenuation categorizations in dB
|
Attenuation categorization |
Attenuation ranges within the categorization (dB) |
|
1 |
A<10 |
|
2 |
10≤A p <20 |
|
3 |
20 ≤ A p < 40 |
|
4 |
40 ≤ A p <60 |
|
5 |
A p ≥60 |
Time (Seconds)
Fig.9. Rain rate attenuation prediction model comparison.
5 со g ю д го
О 3
го с 2 го
ЖЖЖ ЖААЖЖ

А ANN
Ж SST
72000 72500 73000 73500 74000 74500
Time (Seconds)
Fig.10. Categorization of predicted RIA levels on the 24th of April, 2017
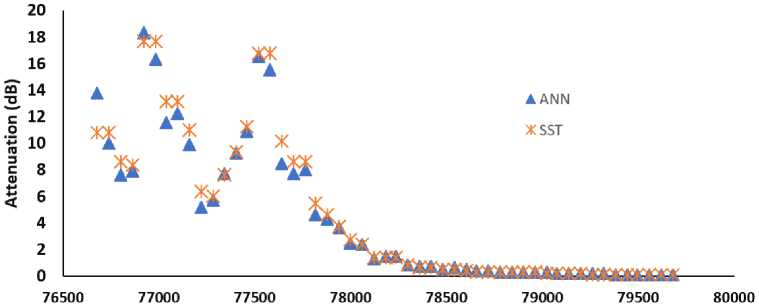
Taking a typical day, for example, with a 30 min (9:20 – 9:50 pm) span of rainfall intensity on May 22nd, 2016 as presented in Fig. 11, a rain attenuation of 19.5 dB was observed to be the highest as generated by the ANN, and about 18 dB was predicted by the SST. Two attenuation classes up to the peak category of the RIA of level 2 were also observed as shown in Fig. 12. It is noted that the ‘▲ ‘marker is above the ‘x’ marker, which could be considered safe.
Time (seconds)
Fig.11. Rain rate attenuation prediction on model comparison on 22nd of May, 2016.
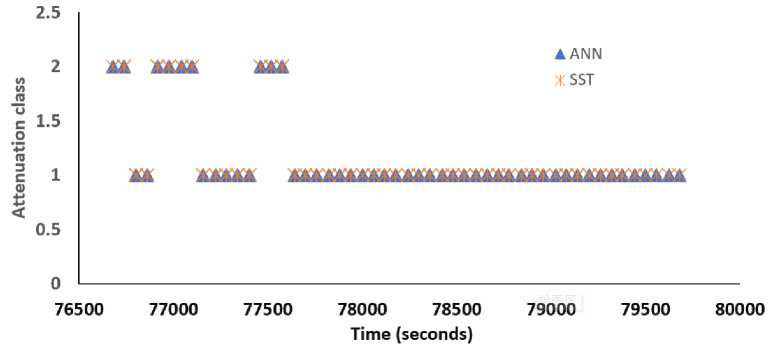
Fig.12. Categorization of predicted RIA levels for 22nd of May, 2016.
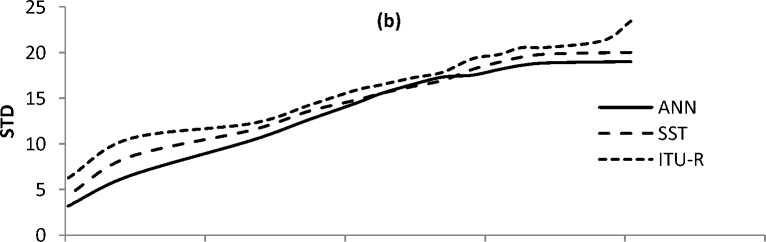
t able 3. s ummary of the predicted model performances .
|
Models |
ARE |
RMS |
STD |
|
New ANN |
1.17 |
1.99 |
18.99 |
|
SST |
2.62 |
3.52 |
20.02 |
|
ITU-R |
3.54 |
3.85 |
23.45 |
4.4. Model Comparison at Different Time Percentages
0.0001 0.001 0.01 0.1 1 10
5. Conclusions
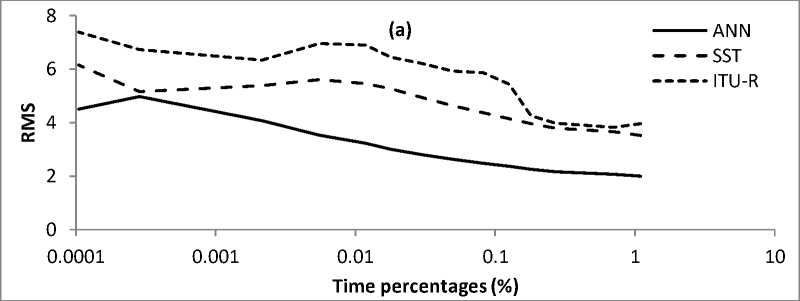
The generated ANN model has been compared to the ITU-R rain attenuation model and the SST rain model, which generates values at different time percentages. The model comparison has been based on the recommendation ITU-R. P. 311-17 [29]. For each of the time percentages, each of the models is evaluated using the statistics of the test variables: the average relative error (ARE), root mean square (RMS), and the standard deviation (STD). Table 3 presents the overall results of the comparison. Generally, the rain-influenced attenuation generated using the ANN gave the lowest ARE, RMS, and STD at the selected time percentages. Figs. (13a, 13b) also show the results for the RMS, and STD, respectively where the new ANN model presents the lowest values of the ARE, RMS, and STD at most of the time percentages. The RIA generated using the SST performs next to the ANN model, while the ITU-R model performs the least. Hence, the ANN model is adjudged the best model for this location through its accuracy and fitness under ranges of time percentages.
Time perentages (%)
Fig.13. Model performance test for the models based on (a) RMS and (b) STD
A BPNN was effectively employed in this study to forecast the condition of the link during rainy events. The results show that the ANN model can successfully forecast deep fades on the propagation link, which is particularly relevant for a good quality of signals. Furthermore, as long as the sampling period is kept to a minimum, i.e., one minute or less, the suggested model can be applied in many places with various geographical characteristics. When employed with data samples taken at a long integration time, however, the proposed model may produce inaccurate findings. The sampling time to deduce the model should be one minute or shorter for best results, as recommended by the ITU radio communication. This enables the identification of shorter rain surges and more accurate link-state prediction. The maximum rain rate measured was 225.8 mm/hr, resulting in a rain attenuation of 61 dB as computed by SST. However, the highest potential anticipated attenuation by the ANN is 45 dB, so the SST model added 16 dB to the downlink signal to compensate for the rain attenuation link. In an average year, this will allow a satellite link to have 99.9% availability. An adaptive power control system, which adjusts the power to provide allowance for fluctuations in signal along the transmission channel, might be used to do this. In addition, the ANN-generated RIA had the lowest ARE and is recommended to be used in this region for effective performance of radio and satellite communication networks.
References Artificial Neural Networks for Earth-Space Link Applications: A Prediction Approach and Inter-comparison of Rain-influenced Attenuation Models
- P. A Owolawi,, "Raindrop size distribution model for the prediction of rain attenuation in Durban,". PIERS Online, Vol. 7, No. 6, pp. 516-523, 2011
- F. Qamar, U. Maraj, S. Ahmed, MHD Nour Hindia, Rosilah Hassan and Quang Ngoc Nguyen, "Issues, Challenges, and Research Trends in Spectrum Management: A Comprehensive Overview and New Vision for Designing 6G Networks". MDPI Electronics, 9(9), p. 1416, 2020.
- J.S Ojo, E.O Olurotimi and O.O Obiyemi, "Assessment of Total Attenuation and Adaptive Scheme for Quality of Service Enhancement in Tropical Weather for Satellite Networks and 5G Applications in Nigeria", Journal of Microwaves, Optoelectronics and Electromagnetic Applications (JMOe), 20(2), AoP 228–247, 2021
- Satish S. Bhojannawar, Shrinivas R. Managalwede, "Distributed and Dynamic Channel Assignment Schemes for Wireless Mesh Network", International Journal of Computer Network and Information Security(IJCNIS), Vol.14, No.2, pp.39-53, 2022. DOI:10.5815/ijcnis.2022.02.04
- Kok Yeow You, "Propagation Channel Modeling for Low-Altitude Platform Non-Terrestrial Networks from 275 GHz to 3 THz", International Journal of Wireless and Microwave Technologies(IJWMT), Vol.12, No.3, pp. 1-17, 2022. DOI:10.5815/ijwmt.2022.03.01
- K. C Robert, Propagation Handbook for Wireless Communication System Design. CRC Press LLC.2000N.W, Chapter two, 2003.
- J.S Ojo, D.B Akoma, O. Adetan, and S.E Falodun, "Analysis of Rain-Induced Attenuation at Ku-V Band Using Gamma Drop Size Distribution Model over a Tropical Region", Wireless Personal Communications, 124, pp. 29–48, 2022.
- J. Roy, R. Archaya, and S.K Sivaraman, "Attenuation prediction for fade mitigation using neural network with in situ learning algorithm", Advances in Space Research, Vol. 49, Issue 2, 15 January 2012, Pp. 336-350.
- J.S Ojo, A.T Adediji., J.S Mandeep and M. Ismail, "Variation of slant path Ka/V-band rain attenuation over seven tropical locations in Nigeria using synthetic storm techniques” Theoretical and Applied Climatology, Vol. 124, pp. 487-496, 2016..
- J.S Ojo, M.O Ajewole and S.K Sarkar, "Rain rate and rain attenuation prediction for satellite communication in Ku and Ka bands over Nigeria" Progress in Electromagnetics Research B, Vol. 5, pp. 207–223, 2008.
- Rashid G. Alakbarov, "Challenges of Mobile Devices' Resources and in Communication Channels and their Solutions", International Journal of Computer Network and Information Security(IJCNIS), Vol.13, No.1, pp.39-46, 2021. DOI:10.5815/ijcnis.2021.01.04
- Rajesh Chakraborty, Uttam Kumar Mandal, Rabindra Nath Barman, " A Comparative Study of ANN and GEP Model to Predict the Pressure Drop in the Water Transportation System", International Journal of Information Engineering and Electronic Business(IJIEEB), Vol.12, No.5, pp. 47-57, 2020. DOI:10.5815/ijieeb.2020.05.05
- Nayak D. R., Mahapatra A. and. Mishra P, “A Survey on Rainfall Prediction using Artificial Neural Network,” Int. Journal of Computer Applications, Vol. 72, No. 16, June 2013.
- McCulloch W and Walter P A logical calculus of ideas immanent in nervous activity. Bulletin of Mathematical Biophysics, pp. 115-133, 1943.
- N. Hung N. Q, Babel M. S., Weesakul S., and Tripathi N. K., “An artificial neural network model for rainfall forecasting in Bangkok, Thailand,” Hydrol. Earth Syst. Sci., 13, pp. 1413-1425,. 2009.
- Oluseun.D.Oyeleke, Sadiq Thomas, Olabode Idowu-Bismark, Petrus Nzerem, Idris Muhammad. “Absorption, Diffraction and Free Space Path Losses Modeling for the Terahertz Band", International Journal of Engineering and Manufacturing(IJEM), Vol.10, No.1, pp.54-65, 2020. DOI:10.5815/ijem.2020.01.05
- M.N Ahuna, T. J. Afullo and A.A Akintunde, "Rainfall Rate Prediction Based on Artificial Neural Networks for Rain Fade Mitigation over Earth – Satellite Link", IEEE Africon 2017 Proceeding, Cape Town, 18-20 September 2017, pp. 579-584.
- H.D Purnomo, K.D Hartomo, and S.Y.J Prasetyo, "Artificial Neural Network for Monthly Rainfall Rate Prediction?. IOP Conf. Series: Materials Science and Engineering, 180 (1-9), (2017). doi: 10.1088/1757-899X/180/1/012057.
- K. C Sri Kavya, Kotamraju, S. K., Rani, G.L, "Prediction of rain attenuation using artificial neural networks". International Journal of Pure and Applied Mathematics, Vol. 117, No. 18, pp. 171-175, 2017..
- M. N Ahuna, T.J Afullo and A.A Alonge, "Rain Attenuation Prediction Using Artificial Neural Network for Dynamic Rain Fade Mitigation", South African Institute of Electrical Engineers, Vol. 110 (1). pp. 11-18, 2019.
- I.D Olatunde, K.O Babatunde, and.D O Afolabi, "Rain Attenuation Prediction in Nigeria Using Artificial Neural Network (ANN)" , International Journal of Electrical and Electronic Science, 6(1): pp. 1-7, 2019.
- N,Kolisetti Janani, V, Sritha, G., Sri Lekha, S. C, Siddharth S, "Rainfall Rate Prediction Using an Artificial Neural Network". Juni Khyat (UGC Care Group I Listed Journal) Vol-10 Issue-5 No. 7, pg 69-76 (2020)
- R. Rojas, “The Backpropagation Algorithm” in Neural Networks: A systematic Introduction, Berlin, Germany: Springer-Verlag, 1996, pp. 151-182.
- J.S Ojo, A.K Adenugba, O.M Durodola, and J.T Ibitokun, "Assessment of rainfall rate and fade event duration for earth-space satellite links design in Nigeria". Indian Journal of Radio and Space Physics 49, pp. 139-143, 2020.
- E. Matricciani, "Prediction of fade durations due to rain in Satellite Communication System,” Radio Science, Vol. 32, No. 3, pp. 935-941, 1997.
- ITU-R Recommendation P.618-13. Propagation and prediction methods required for design of earth-space telecommunication systems. ITU-R, Geneva, Switzerland, 2017.
- ITU-R Recommendation P.838-3.. Specific attenuation model for rain for use in prediction methods. International Telecommunication Union, Geneva, Switzerland, 2005
- D. Maggiori (1981) Computed Transmission through Rain in the 1-400 GHz Frequency Range for Spherical and Elliptical Drops and Any Polarization. Alta Frequenza (Italy), 50, 262-273.
- ITU-R Recommendation P.311-17, Acquisition, presentation and analysis of data in studies of tropospheric propagation”. ITU. International Telecommunications Union, Geneva, 2019. 8pp
