Aspect sentiment identification using random Fourier features

Author: Thara S., Athul Krishna N. S.
Journal: International Journal of Intelligent Systems and Applications @ijisa
Article in issue: 9 vol.10, 2018.
Free access
The objective of the paper was to show the effectiveness of using random Fourier features in detection of sentiment polarities. The method presented in this paper proves that detection of aspect based polarities can be improved by selective choice of relevant features and mapping them to lower dimensions. In this study, random Fourier features were prepared corresponding to the polarity data. A regularized least square strategy was adopted to fit a model and perform the task of polarity detection Experiments were performed with 10 cross-validations. The proposed method with random Fourier features yielded 90% accuracy over conventional classifiers. Precision, Recall, and F-measure were deployed in our empirical evaluations.
Aspect Based Sentiment, Kernel, Least Square Regression, Random Fourier Feature, Sentiment
Short address: https://sciup.org/15016524
IDR: 15016524 | DOI: 10.5815/ijisa.2018.09.04
Text of the scientific article Aspect sentiment identification using random Fourier features
Published Online September 2018 in MECS
Social networking websites like microblogging, Facebook, Twitter, blogs, etc. are used widely by people, to share opinions and sentiments on a variety of their real- world experiences. Such discussion forums, provide researchers valuable information about people’s personal notions and reflections. Sentiment analysis is one of the hot topics which falls under the realms of natural language processing (NLP), and data mining [1]. It is a variant of parsing text to decipher the underlying sentiment. Scrutiny of emotional feelings facilitates understanding the polarities of opinions conveyed on various topics of interest. Emotions, attitudes, perception, anticipation, and feelings are different aspects of sentiment, usually considered as delicate confidential information. Generally, human beings communicate their feelings using subjective expressions [2]. Their opinions are neither objective information nor amenable to authentication.
Each day, massive amounts of text streams are generated by the social media [1]. The text strings, present a prime source of main-stream data for data scientists, in private and public sector enterprises. These online diaries, in essence offer a broadcast media/outlet for people to share their personal user experiences, recommendations, suggestions vis-à-vis a service or a product offered by a company. Such information present a valuable resource that reflect current trends in the market-place These chronicles are frequently embellished by sentimental polarity values, like positive or negative, about a product or a service, which act as direct feedback to the product manufacturer or service provider. A customer’s review of a restaurant may state: "Exceptional service, the place is quite small however the service and meals are awesome"; overall, this review clearly has a positive polarity.
This paper presents an efficient approach to derive the underlying sentiment from a piece of text in social media (e.g., product reviews or customer feedback). The Aspect Based Sentiment Analysis (ABSA) dataset, consists of information available in the public domain, from two dissimilar domains (restaurants, laptops). The restaurant dataset contained 2035 English sentences whereas the laptop dataset had 2849 English sentences from 394 online customer reviews. We decoded a sentiment polarity (positive, negative or neutral) for the datasets from these two domains. The prime objective of polarity identification at the message level, was to avoid misclassification. For example, erroneous labelling of an expression with positive aspect, as negative, is of more serious consequence than misclassifying it into the neutral category.
-
II. Related Work
In reference [7], the authors discuss various sentimental classification models, on a Turkish news site, that conform to the domain of politics. . The authors have compared several supervised machine learning algorithms, such as Support Vector Machines (SVM), Maximum
Entropy model, the N-Gram Model and Naive Bayes, for classification of sentiments of Turkish political news. Their study showed that SVM and Naive Bayes were outperformed, by the Maximum Entropy and character based N-Gram Language models. By using a different feature set [7] all these methodologies attained accuracies, ranging from of 65% to 77%.
In reference [3], the author proposes feature-based opinion summarization using various techniques such as Part-of-Speech Tagging (POS), Frequent features Identification, Opinion Words Extraction etc.
In Ref. [4], the Hillard, et al, summarize automatically transcribed meetings which utilizes word-based features. In Ref. [5], Gonzalez-Ibanez, et al, pursued detection of sarcasm in tweets. Tweet’s linguistic and pragmatic features were used to appraise sarcasm classification. Accuracy by automatic classification was found to be no better than human classification, both at a low level.
In Ref. [8], Kawamae et.al proposed a probabilistic topic model, which identifies a particular aspect, from articles related to reviews, and its corresponding sentiment polarity value. Their paper reported a structure, comprised of multiple levels, for analysis of sentiments, which identified a term and its rating, by allocating topics, into aspect and sentiment topics. The probabilistic topic model discussed in that paper was receptive to subjective and unbiased information; this helped the authors determine smaller meaningful topics, and elaborate a randomly generated process, for each article in a consolidated approach.
In [9] Bressan et.al, used tenses and contrary words for assessment of the sentiments, in informal texts derived from Twitter. They used a system, called SentiMeter-Br, [9] for analysis of the sentiments. The paper compared the efficiencies of the SentiStrength and the SentiMeter-Br schemes, against annotator’s opinion resulting in correlation factors of 0.89 and 0.75. Thereby proving that the measurement used in the SentiStrength preferred to the one used in the Sentimeter-Br. The sentiment polarity of content was obtained via machine learning techniques, using Sequential Minimal Optimization (SMO) algorithm. The SMO algorithm classifies instances with an accuracy of 71.79% and F-Measure is in the range of 0.80 to 0.90 for positive and negative phrases respectively.
The Paper [6] developed a system that could correctly detect 101 of the 135 sarcastic tweets, adopting the Balanced Winnow classification algorithm. In Paper [10] Chen, et.al, have proposed a procedure to handle sentiment analysis of Cantonese opinions. Their paper also proposes an approach for orientation and summarization of features. Hidden Markov Model (HMM) [10] was used to handle Cantonese word distribution.
In Paper [11] Duan, et al, discuss extensive views of user-generated online content. Several papers, as in [1214], published a method, to ascertain the polarity of adjectives. The authors also developed SentiWordNet (SWN), [12-14] using supervised classifiers and manual annotation. A minimal supervised algorithm was developed, to determine the polarity of a word, by deciding whether, its probability to co-occur with a limited set of positive seed words is greater than its probability to coexist with a limited set of negative seed words.
Studies in [15-17] included various approaches to construct dictionary-related sentiment words. Typical machine learning methodologies like Maximum Entropy,
SVM and Naive Bayes, were explored in those investigations.
Arun, et al, in [18] dealt with sentiment analysis in the Tamil language, of a movie review data, and a formulabased study, estimating opinion on a film review data set. In the former approach, the analysis considered recurrent count as its main feature. The data collected was hand tagged as negative or positive sentiments.
In reference [20], the authors explain a technique to extract sentiment from documents, which were related to product reviews, reviews of novels, and movies. Feature generation was carried out by considering the linguistic familiarization of the content. In reference, [32] the author describes various techniques to do classification based on supervised machine learning approach.
-
III. Proposed Method
In our paper, we have derived the sentiment polarities, from the constrained dataset of the hotel and restaurant reviews of SemEval 2015 [25], using a regularized least square (RLS) method. Fig. 1 shows various procedures comprising our proposed method, for labeled and unlabeled data: pre-processing, feature generation, finding least-square weighted matrix and classification.
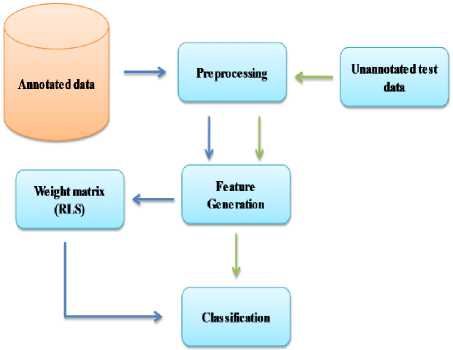
Fig.1. Proposed Method
Our scheme used the training and test data set of hotel and restaurant reviews, from SemEval-2015 [25]. After importing the extensible markup language (XML) related packages, Document Builder object was created. The root element was obtained next, the attributes and subelements from the XML file were identified. Text along with the corresponding polarity was extracted from the XML file and written into a text file. Table 1 and Table 2 provide information about the data and polarity distribution in each domain.
Table 1. Data description
|
Domains |
Positive |
Negative |
Neutral |
|
Laptop |
1103 |
765 |
404 |
|
Restaurant |
1198 |
404 |
53 |
Table 2. Polarity distribution for each domain
|
Domains |
Positive |
Negative |
Neutral |
|
Laptop |
48.54% |
33.67% |
17.78% |
|
Restaurant |
72.38% |
24.41% |
3.20% |
-
A. Pre-processing
Text parsed from the XML contained different symbols in which few punctuations like full stop, comma, braces, stop words etc. were removed from the sentences since they do not convey any meaning to the texts. In this paper, we created a domain specific stop word list. A list was maintained per following criteria:
-
• Terms which were least frequently used
-
• Terms which were most frequently used
-
• Terms which had low inverse document frequency (IDF) [34]
Suppose there are X texts and a particular term ti occurred in Y of the X documents then IDF of t i is calculated as: IDF (t i ) = Log N/M. Mostly stop words, coordinating conjunctions and prepositions were removed, since they occurred the most number of times. Suppose the input text is: Being a PC user my whole life. Here 'a', 'my', 'whole' are stop words. Output will be Being PC user life.
-
B. Feature Generation
The features were extracted after pre-processing was performed. Different feature generation methods were used: (1) unique part-of-speech (POS) Tagger [21] list, (2) unique Named Entity Recognition (NER) [22] list and (3) unique vocabulary list. For POS tagging, Stanford POS Tagger [22] was used for assignments of POS such as noun, a verb, adjective etc. to each word in the sentence. For Named Entity Recognition, Stanford NER [22] was used for assignment of text into different categories such as the names of persons, location, and organization. A unique vocabulary list was created where it had one word per line in the text file.
Table 3. Feature length
|
Data set |
Feature Length |
|
Unique dictionary list |
14600 |
|
POS tagger |
37 |
|
NER |
3 |
The resultant unique vocabulary list was written as a row vector where each word in a text is mapped to the word in the row vector, if present it is assigned a 1 to its corresponding position else 0. It denotes a one-hot vector representation [24]. For a review text which has multiple occurrences of similar words, its term frequency (number of times a particular word has occurred) was calculated.
Similarly, the same step is applied to the NER file and POS tagger. Finally a matrix was created. Table 3 represents the length of various features.
Since the matrix that we prepared was sparse in nature, a random Fourier mapping was applied to find a lowdimensional dense representation [23-24]. Therefore, a concise feature list was created wherein a linear classification could be applied [23-24]. The main aim was to outline the input which contains the feature set into a concise feature space using a randomized function map as shown in Equation (1), where z is as an explicit mapping function, which maps the data to a finite dimensional space
z : Rd → RD (1)
The mapping of the feature set is done to a Euclidean inner product space as shown in Equation (2), where the function ∅ is a mapping function which is implicit in nature and maps to a higher dimensional infinite space, as in SVM ke(p, q) = (∅(p),∅(q)) ≈ z(p)T z(q) (2)
When the data dimension is large, the implicit mapping (via random mapping technique) has a problem in kernel computation as the computational cost will be heavy. However, the kernel computation will not be heavy when the data is mapped using explicit mapping method [24]. A nonlinear function map z (.) was used to perform this mapping [23]. The algorithm put forward by Ali Rehimi, et.al, Random Kitchen Sink (RKS), ensures that the data in the explicitly mapped space can be linearly separated. RKS approximates shift-invariant kernels or translationinvariant kernels like radial basis function (RBF) or Laplacian function [23]. The shift-invariant or translation-invariant kernel will be of the form as shown in Equation (3).
ke ( p , q ) = ke ( p - q ) (3)
In [23], the investigators explain the RKS algorithm using radial basis function (RBF) as shown in Equation (4), ke(p,q)=e-γ||p-q||2 =e-γ(p-q)T(p-q) (4)
where γ =
2 σ 2
Mathematically, RKS algorithm is well supported using Bochner's theorem [25]. This theorem, relates RBF shift-invariant kernels with its Fourier transform, as shown in Equation (5)
ke ( p - q ) = ∫ F ( ω ) e - j ( p - q ) T ω d ω (5)
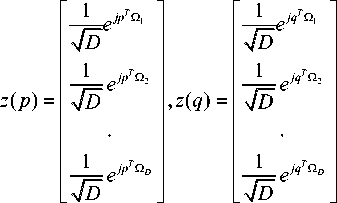
The Fourier transform, if scaled correctly, , will become a probability distribution as shown in Equation (6), where Ω is described as a random variable which follows a Gaussian distribution [23-24].
FT ( ke ( p , q )) = FT ( ke ( p - q )) =
FT ( ke ( p - q)) = E ( e ( p - q ) T Q ) (6)
The kernel [23-24] is defined as shown in Equation (7), ke(p, q) =(z(pT) z(q))
-
C. Regularized least square (RLS) method:
Classification of random mapped features was implemented using RLS method. It is an example of supervised learning classification method. In the current method the data is being mapped explicitly to a feature space, as defined by the kernel. A linear classifier is trained in that space. The n-dimensional data vectors along with their class labels are represented as, P = { p i , p 2 ,..., p n } e^ n , Q = { q i , q 2 ,..., qn } e^ n The objective function for RLS is shown in Equation (9), where λ is a control parameter.
min J 1| Q - W p\ F + я| W | I F . I (9)
The objective function finds a weight matrix W using a regression equation.
W = ( p T p + X I ) - 1 P T Q (10)
The W on to which the test data is projected so as to get the label vector. The index of the maximum value in the label vector denotes the corresponding class label of the test data [23-24].
-
IV. Results and Discussion
Our investigation shows the effectiveness of using random Fourier features in classification problems. The computations were performed on a 64-bit, Windows computer using NetBeans platform [38] and MATLAB [36]. We used Java programming [37] language for preprocessing and MATLAB for later stages of experiments.
The data we used was part of the SemEval-2015 [25] shared task competition. There were 5 major tracks in the competition, which used the data corresponding to the task –Aspect based Sentiment Analysis [25]. The objective of this task was to find the entity and identify the polarity (positive, negative and neutral) of sentiments from the aspects expressed. The laptop domain data contains 22 entities – Display, Memory, CPU, Hard Disk, etc. and 9 attribute labels – Quality, Price, General etc. The restaurant domain data contains 6 entities – Location, Food, Ambience, Restaurant, Drinks, Service etc. and 5 attributes like Price, Style_Options, General, Quality, Miscellaneous etc. [25]. Sample text from each of the domain data is shown below:
-
1) [laptop] The applications are also very easy to find and maneuver→{SOFTWARE#USABILITY }
-
2) [restaurant] The staff is incredibly helpful and attentive→{SERVICE#GENERAL}
The task associated with our method was to find the polarity sentiment of the entity-attribute texts. The sentiment of the text had to be classified into any one of the three categories – Neutral, Negative and Positive. Examples are:
-
1) Neutral:
-
a. It does run a little warm, but that is a negligible concern ^ { LAPTOP # QUALITY}
-
b. The fajitas are nothing out of the ordinary.→{FOOD#GENERAL neutral}
-
2) Positive:
-
a. It's a nice place to relax and have a conversation. ^ {AMBIENCE#GENERAL positive}
-
b. We love the food, drinks, and atmosphere.→{FOOD#QUALITY positive}
-
3) Negative:
-
a. I've waited over one hour for food. →{SERVICE#GENERAL negative}
-
b. The food was bland oily.
→{FOOD#GENERAL negative}
Experiments were performed with 10 cross-validations. It produced 10 equal sized sets, wherein 90% of the data was taken for training and 10% data was used for testing. The features used to represent the data were unique vocabulary vector (one-hot representation), unique POS Tagger (one-hot representation) and unique NER (one-hot representation). As the data vectors (both training and testing data vector) were sparse in nature, they were mapped to a lower dimension using the RKS algorithm random mapping. The different lower dimension values chosen were 500, 1000, 1500, and 2000. The dimensions were chosen manually. The features thus formed were random Fourier features [23-24].
According to the theory of RKS [23], a vector representation in such explicitly mapped finite dimension space should be linearly separable. As discussed in [24], regularized least square method (RLS) was used, to classify the data [26-27]. In order to perform classification, we used two kernels – linear and RBF kernel. In the linear kernel operation, the weight matrix was derived using regularized least squares approach. In case of RBF kernel, the data was mapped using RBF kernel and the weight matrix was calculated using regularized least squares approach. The linear kernel for all the finite dimensions yielded an average accuracy 79%, whereas, the corresponding result with RBF kernel had an average accuracy of 80% for dimension-1500 and, 79% for the remaining dimensions. This shows that RBF kernel gave better accuracy than linear kernel in this explicitly mapped finite dimension, using regularized least square approach.
Figure 2 shows the average accuracy obtained for linear and RBF kernel for the explicitly mapped finite dimension feature vectors using RLS method. The results obtained shows that the random features were effective to give comparable results for polarity detection problems discussed in this paper.
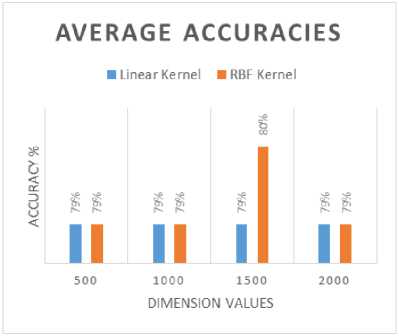
Fig.2. Average Accuracies of Linear and RBF Kernel
Naive Bayes [30-31] is the most commonly used classifier for its simple probabilistic classification. It is based on Bayes theorem with strong independent assumptions. SMO classifier [30-31] was used to resolve quadratic programming complications that emerge via the training instructions of support vector machines. SMO globally changes all lost values and translates formal attributes into binary values. The memory required for SMO was linear with the size of the training set. IBk procedure, which implements the KNN algorithm, was used to classify a test instance. J48 is another classifier, which builds the decision tree from labeled training data set.
Random Forest is a random tree and it is an ensemble learning algorithm that generates many individual learners [30-31]. It employs a bagging idea to produce a random set of data for the construction of a decision tree. After training and testing the classifier, WEKA [29] displays the results of classification, and a comparative analysis based on the results was tabulated, as shown in Table 4 and Table 5. The metrics used are
Pr ecision =
Re call =
TP
TP + FP
TP
TP + FN
2*(Pr ecision *Re call ) Pr ecision + Re call
Accuracy =
TP + TN
TP + FN + FP + TN
We evaluated our model against most of the popular machine learning algorithms [25, 28] using WEKA (Waikato Environment for Knowledge Analysis) tool [29]. An experiment was performed using the WEKA Explorer classification tool [29]. Some of the well-known classifiers used for our comparative study included Decision tree, Sequential minimal optimization (SMO), Naive Bayes, Random Forests, K-Nearest neighbor (KNN) [30-31] etc. The output feature matrix was converted into an (Attribute-Relation File Format (ARFF) file, which describes a list of instances, sharing a set of attributes. The pre-process tab in WEKA [29] enables loading and processing the feature matrix. All the classifiers such Decision tree, SMO, Naïve Bayes, Random Forests, K-Nearest Neighbor [30-31] chose default parameter settings
where TP, FP, TN, FN denotes true-positive, falsepositive, true-negative and false-negative.
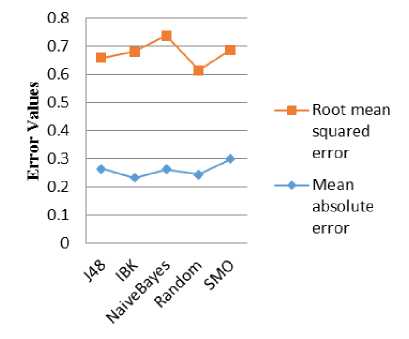
Fig.3. Error-measure comparison for various classifier
-
Table 4. Class-wise evaluation measures of TPR and FPR in WEKA:
-
Table 5. Class-wise evaluation measures of Precision and Recall in WEKA:
Class
Methods
True Positive Rate(TPR)
False Positive Rate(FPR)
1
J48
0.843
0.456
IBk
0.833
0.495
NaiveBayes
0.704
0.343
RandomForest
0.880
0.471
SMO
0.833
0.355
2
J48
0.556
0.173
IBk
0.505
0.129
NaiveBayes
0.538
0.191
RandomForest
0.538
0.095
SMO
0.653
0.150
3
J48
0.089
0.012
IBk
0.177
0.041
NaiveBayes
0.291
0.127
RandomForest
0.165
0.037
SMO
0.152
0.038
Class
Methods
Precision
Recall
ROC Curve
1
J48
0.710
0.843
0.765
IBk
0.690
0.833
0.752
NaiveBayes
0.731
0.704
0.752
RandomForest
0.712
0.880
0.821
SMO
0.756
0.833
0.743
2
J48
0.631
0.556
0.771
IBk
0.675
0.505
0.776
NaiveBayes
0.600
0.538
0.755
RandomForest
0.750
0.538
0.852
SMO
0.698
0.653
0.772
3
J48
0.412
0.089
0.580
IBk
0.280
0.177
0.602
NaiveBayes
0.173
0.291
0.689
RandomForest
0.289
0.165
0.679
SMO
0.267
0.152
0.660
References Aspect sentiment identification using random Fourier features
- J. Wang. Encyclopedia of Data Warehousing and Mining, 2nd edn., vol 2. , Idea Group Inc., Hershey, 2008
- R.Quirk, S.Greenbaum, G. Leech and J. Svartvik. A Comprehensive Grammar of the English Language. 1st edn. vol 2., Longman Publication Company: London, 1985.
- Minqing Hu and Bing Liu.. 2004. “Mining and summarizing customer reviews,” in Proceedings of the 10th ACM SIGKDD International Conference on Knowledge Discovery and Data Mining, KDD,04, pages 168–177.
- Dusti Hillard, Mari Ostendorf, and Elizabeth Shriberg 2003. “Detection of agreement vs. disagreement in meetings: Training with unlabeled data,” in Proceedings of the 2003 Conference of the North American Chapter of the Association for Computational Linguistics on Human Language Technology: Volume 2, NAACL ’03, pages 34–36.
- Roberto Gonzalez-Ibanez, Smaranda Muresan and Nina Wacholder (2011). “Identifying sarcasm in Twitter: a Closer Look,” in Proceedings of the 49th Annual Meeting of the Association for Computational Linguistic, ACLHLT ’11, pages 581–586.
- Christine Liebrecht, Florian Kunneman, and Antal Van den Bosch,” The perfect solution for detecting sarcasm in tweets,” in Proceedings of the 4th Workshop on Computational Approaches to Subjectivity, Sentiment and Social Media Analysis, pages 29–37.
- M. Kaya, G. Fidan, and I. H. Toroslu, “Sentiment analysis of Turkish political news, “in Proceedings of the The 2012 IEEE/WIC/ACM International Joint Conferences on Web Intelligence and Intelligent Agent Technology-. IEEE Computer Society, Volume 01,pp. 174–180
- Noriaki Kawamae, “Hierarchical Approach to Sentiment Analysis,” 2012 IEEE Sixth International Conference on Semantic Computing. May, pp.140-146.
- Lopes Rosa, R., Zegarra Rodríguez, D., & Bressan, G. (2013). “SentiMeter-Br: A Social Web Analysis Tool to Discover Consumers' Sentiment,” in Mobile Data Management (MDM), IEEE 14th International Conference, 2013, Vol. 2, pp. 122-124.
- J. Chen, Y. Liu, G. Zhang, Y. Cai, T. Wang and H. Min, "Sentiment Analysis for Cantonese Opinion Mining," Emerging Intelligent Data and Web Technologies (EIDWT), Fourth International Conference on, Xi'an, 2013, pp. 496-500.
- W. Duan, Q. Cao, Y. Yu, “Mining online user generated content: Using sentiment analysis technique to study hotel service quality,” in Proceedings 46th Hawaii International Conference on System Sciences, pp. 3119-3128.
- V.Hatzivassiloglou and K.R. McKeown, “Predicting the semantic orientation of adjectives,” in Proceedings of the 35th Annual Meeting of the ACL and the 8th Conference of the European Chapter of the ACL (1997), pp 174–181.
- A. Esuli and F. Sebastiani, “Determining term subjectivity and term orientation for opinion mining,” in Proceedings of the European Chapter of the Association for Computational Linguistics, 2006, pp. 193–200.
- P. D. Turney and M. L. Littman, “Measuring praise and criticism: Inference of semantic orientation from association,” ACM Transactions on Information Systems (TOIS), 2003, vol. 21, pp. 315–346.
- Bo P, Lee L, Vaithyanathan S, “Thumbs up? Sentiment classification using machine learning techniques” in Proceedings of the Conference on Empirical Methods in Natural Language Processing (EMNLP); 2002. p. 79-86.
- Kreutzer, J., Witte N.: Opinion Mining using SentiWordNet. Uppsala University (2013).
- Wiebe J., Mihalcea R.: “Word sense and subjectivity,” in Proceedings of COLING/ACL-06, 2006, Pages 1065-1072.
- Arun, S., Anand Kumar, M., Soman, K. P, “Sentiment Analysis of Tamil movie reviews via Feature Frequency Count,” IJAER, 2015, pp.17934-17939.
- Deepu, S. N., Jisha, P. J., Rajeev, RR, Elizabeth, S.: SentiMa-Sentiment Extraction for Malayalam, ICACCI, 2014, pp. 1719-1723.
- Sandeep, C., Bhadran, V.K., Santhosh, G., Manoj, K. P.: “Document level Sentiment Extraction for Malayalam Feature based Domain Independent Approach,” IJARTET, 2015.
- Stanford Named Entity Recognizer (NER). Available: https://nlp.stanford.edu/software/CRF-NER.shtml. Date accessed: 07/03/2017
- Stanford Log-linear Part-Of-Speech Tagger. Available: http://nlp.stanford.edu/software/tagger.shtml. Date accessed: 07/03/2017
- A. Rahimi and B. Recht, “Random features for large-scale kernel machines, “in Proc. 21st Ann. Conf. Advances in Neural Information Processing Systems (NIPS), 2007, pp. 1-8.
- S. Sachin Kumar, B. Premjith, M. Anand Kumar, K.P.Soman:AMRITA_CEN-NLP@SAIL2015: “Sentiment Analysis in Indian Language Using Regularized Least Square Approach with Randomized Feature Learning,” MIKE 2015, pp. 671-683.
- Aspect Based Sentiment Analysis. Available: http://alt.qcri.org/semeval2015/task12/. Date accessed: 07/02/2017
- R. Rifkin, G. Yeo, and T. Poggio, “Regularized least-squares classification,” Nato Science Series Sub Series III Computer and Systems Sciences, 2003, pp. 131–154.
- Andrea Tacchetti and Pavan K. Mallapragada and Matteo Santoro and Lorenzo Rosasco, “GURLS: A Least Squares Library for Supervised Learning,” Journal of Machine Learning Research, 2013, vol 14, pp. 3201-3205.
- W. Rudin. Fourier Analysis on Groups. Wiley Classics Library. Reprint of the 1962 edition A Wiley-Interscience Publication, New York, 1994
- Weka 3: Data Mining Software in Java. Available: http://www.cs.waikato.ac.nz/ml/weka/. Date accessed: 14/04/2017
- Jotheeswaran J, Koteeswaran S. “Feature Selection using Random Forest Method for Sentiment Analysis,” Indian Journal of Science and Technology, 2016 Jan, 9(3), pp. 1-7.
- Sasikala, S.; Bharathidason, S.; Jothi Venkateswaran, C., “Improving Classification Accuracy Based On Random Forest Model Through Weighted Sampling For Noisy Data With Linear Decision Boundary,” Indian Journal Of Science And Technology, April 2015, pp. 614-619
- Thara.S, Sidharth S, “SVD feature based Aspect Sentiment Classication” ICACCI, 2017, pp.2370-2374.
- Ibrahim S. I. Abuhaiba, Hassan M. Dawoud,"Combining Different Approaches to Improve Arabic Text Documents Classification", International Journal of Intelligent Systems and Applications (IJISA), Vol.9, No.4, pp.39-52, 2017. DOI: 10.5815/ijisa.2017.04.05
- Ayman E. Khedr, S.E.Salama, Nagwa Yaseen,"Predicting Stock Market Behavior using Data Mining Technique and News Sentiment Analysis", International Journal of Intelligent Systems and Applications(IJISA), Vol.9, No.7, pp.22-30, 2017. DOI: 10.5815/ijisa.2017.07.03
- Sudhir Kumar Sharma, Ximi Hoque,"Sentiment Predictions using Support Vector Machines for Odd-Even Formula in Delhi", International Journal of Intelligent Systems and Applications(IJISA), Vol.9, No.7, pp.61-69, 2017. DOI: 10.5815/ijisa.2017.07.07
- MATLAB. Available :https://in.mathworks.com/ products/matlab.html
- JavaProgramming.Available: https://www.javapoint.com/java-programs
- NetBeans. Available: http://netbeans.org/downloads/
