Assessing population's quality of life on the basis of intelligent algorithms and dynamic modeling

Author: Gainanov Damir A., Zakieva Elena Sh.
Journal: Economic and Social Changes: Facts, Trends, Forecast @volnc-esc-en
Section: Modeling and forecast of socio-economic processes
Article in issue: 5 т.13, 2020.
Free access
The article deals with the issues of research, modeling and management of society as a societal system. The authors propose a methodology for studying society based on the system composition of the main structures of activities organization, as well as the integration of general scientific laws and approaches. The peculiarity of the methodology is that society is represented as system integrity and a unity of economic, political, social, spiritual, and cultural sub-systems. Improving population’s quality of life is considered a criterion for society’s development and, at the same time, the effectiveness of its management. The paper proposes the models for assessing the quality of life as an integral indicator of the society’s quality of functioning and development, which allow evaluating this indicator, studying its structure, and the dynamics of its changes. An algorithm for managing the functioning quality of the societal system, based on the assessment of the integral index, is developed. A special feature of the algorithm is the complex application of data mining and dynamic modeling methods. The algorithm includes two main stages. At the first stage, data mining is performed on the quality of the system functioning in the selected area in the regional context. The results of the analysis allow identifying the clusters of regions and determining their characteristic features. The second stage involves developing the integral index structure and a dynamic model for assessing the functioning quality of the societal system on the basis of the integral index calculation, producing control actions in the form of changes in the volume of investments taking into account the characteristics of the constructed clusters. The authors consider the case of the developed algorithm implementation for quality management of social infrastructure in the regions of the Russian Federation, which allowed determining the recommended change in the level of investment in social infrastructure development by the regional clusters.
Societal system, quality of life, integral index, management algorithm, sampling, principal component method, regional clusters, dynamic model, social infrastructure quality
Short address: https://sciup.org/147225484
IDR: 147225484 | UDC: 330.59:004.942 | DOI: 10.15838/esc.2020.5.71.7
Text of the scientific article Assessing population's quality of life on the basis of intelligent algorithms and dynamic modeling
The current stage of civilization development is characterized by a high degree of dynamism, instability and uncertainty, the acceleration of mutual influence and interdependence of the world’s regions, and the globalization processes strengthening [1]. Global community is now in fundamentally new conditions that can define our era as an era of change, planetary vulnerability, and emerging new conditions for humanity existence. Global transformations and technological development led to the formation of a new world order, where the leading positions will be occupied by the countries that have moved to a post-industrial society [2]. The principal difference between this society and the previous socio-economic formations is that the main goal of development is to improve the quality of human life based on technological progress and fundamental science [3].
Under these conditions, there is an increasing need to study society as an organized system integrity, as a societal system, which is understood as a system of phenomena and processes considered at the level of society as a whole [4, 5].
The analysis of social systems features has shown that society as a whole and its individual spheres of life are complex dynamic objects that can be considered in statics at certain (fixed) moments of time, and in dynamics at continuous changes in time. Social statics reflects the conditions and laws of society functioning, and social dynamics describes the laws of society’s development and changes [6].
Modeling the dynamics of social systems is one of the most difficult scientific tasks. This is caused by the presence of a large number of system parameters, the dynamic instability of social processes, its multi-level and multiscale (micro- and macro-processes), weak formalizability of parameters and structures, the need of taking many factors into account, the weak predictability of the system behavior, and other reasons.
The purpose of this paper is to study society as a complex dynamic system, which involves developing a conceptual framework for research, a set of models and algorithms to support decision-making in society management. The scientific novelty and significance of the proposed approach to society studying is in the methodology of research, modeling and management of society, which allows studying the features of its functioning and development and working out recommendations for its management.
Methodology of research, modeling and management of society as a societal system
The proposed methodology includes the following main components:
– the concept of the societal system models building, which is based on the system composition of the main structures of activities organization, as well as the integration of general scientific approaches and laws [7];
– a set of models (system, cognitive, dynamic, simulation) of the societal system, its sub-systems, an integral index of the quality of the system and its components functioning;
– intelligent decision support algorithms for managing the societal system.
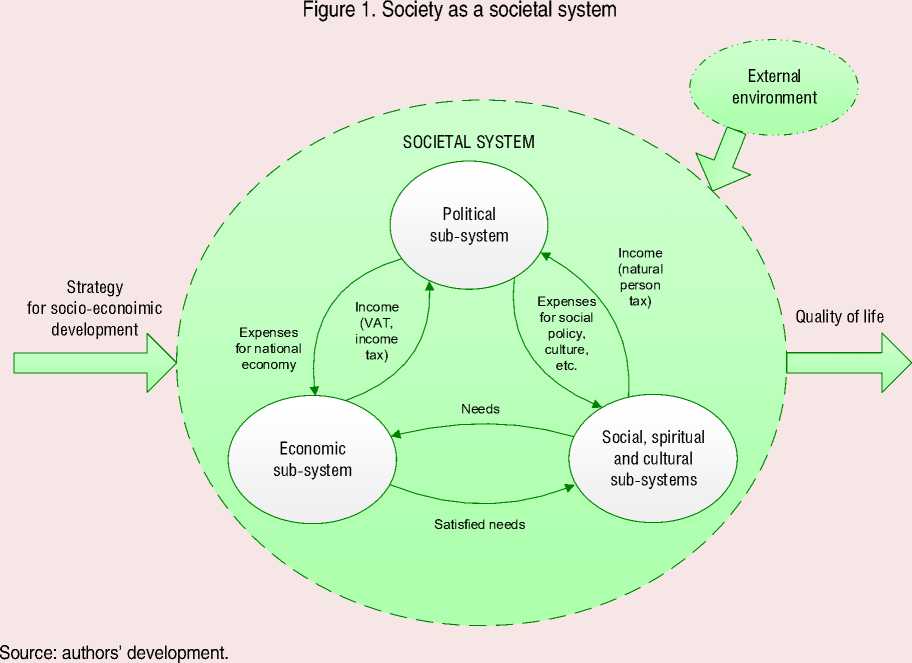
When studying society’s properties, the authors followed a structural and functional approach [8], according to which society is considered a societal system capable of selforganization and representation of a unity of economic, political, social, spiritual, and cultural sub-systems ( Fig. 1 ).
Each sub-system performs its own functions, and all of them are closely related to each other and interact giving the system a new quality that is not reducible to the properties of its individual sub-systems. Such an integral property is, for example, the property of society to develop in conditions of uncertainty.
The quality of life indicator, based on which the government determines the policy of resource allocation, is considered the main
indicator of society’s functioning and development. Improvement of the population’s quality of life is the most important strategic task of public administration. The quality of life indicator serves as a criterion for the society’s socio-economic development and a criterion for the efficiency of public administration bodies [9].
Quality of life assessment models
The concept of quality of life is used in various sciences: medicine, philosophy, sociology, economics, geography, and others, and it is interdisciplinary. Each science interprets this concept in its own way. Along with the variety of definitions of quality of life, there is a large number of methods for measuring it [10–15]. There are two main approaches to assessing the quality of life: an objective approach based on the analysis of statistical data, and a subjective approach based on the sociological surveys results processing [9, 16]. In international practice, a combined approach is also common, according to which objective and subjective indicators are considered equivalent [17].
The quality of life indicator is integral, it is a complex system consisting of many elements and links between them. To study its structure, it is advisable to apply a systematic approach, according to which the integral indicator is sequentially decomposed into a set of interrelated components and presented as their hierarchy. The authors proposed a model of quality of life in the form of a hierarchy of triads [18]. Each level has a triad of interrelated private indicators forming a system indicator of the corresponding level. There are three levels: the bottom one characterizing the quality of life (/i) and including components such as income and expenses, housing conditions, quality of food; the average one characterizing the quality life potential (/2), and including such components as level of education, quality of health, level of culture; the upper one characterizing the quality of living environment (/3) and including components such as environmental quality, quality of social infrastructure and quality of working life. System indicators form an integral indicator of quality of life (Q).
To calculate the integral index, a weighted assessment is used, which is common in most existing methods for assessing the quality of life :
q - (1) i=1
where а ; is the significance coefficient of the system indicator of the i level. The values of a ; coefficientsare determined by expert analysis or based on statistical data, while г ^ = 1.
We have considered a different view on the formation of an integral index of quality of life, where this indicator is represented as a multiconnected multi-layer dynamic object, while maintaining the transition from vertical links in the hierarchical structure to horizontal ones. The peculiarity of this model is that each system and particular integral index has its own mechanism of self-organization, implemented in the form of the corresponding feedback coefficients. Based on this approach, a dynamic model for assessing the quality of life is developed, presented in the form of continuous nonlinear differential equations.
The dynamics of changes in the integral index is described by a differential equation as follows:
Q = -Q + « 1/1 + « 2/2 + (X 3 J 3 . (2)
The dynamics of changes in system indicators is described by differential equations as follows:
f/ = -A1(z1)J1 + X^h + X^h + /ю,
[A = ^^h + W1 + Wa + /20, (3) v з = -Аз(^]з + А31Л + Л32/2 + ho, where /i0, i = 13 are the initial values of indicators; Ji; AiV, i * j are the weight coefficients reflecting the mutual influence of h indicators. The values of Xtj coefficients are determined by experts based on the analysis of statistical data; At (zt) are feedback coefficients of system integral indicators that depend on zt administrative and legal control actions at the level of federal government structures.
The initial values of Ji indicators are defined as the weighted sum of xt1, xt2, xt3 particular indicators of i level:
ho = 3 i1xi1 + 3 i2xi2 + ei3xi3 > (4)
where р0- are coefficients of significance of xt1, xt2, xt3 particular indicators. The values of eiy coefficients are determined by expert analysis or based on statistical data, while £ 3=1 P iy = 1 .
The x t1 , x t2 , x t3 particular indicators are calculated by solving a system of equations:
Г хц = -ail(zil)%il + k^x^ + ki3Xt3 + Un, t xi2 = -at2(Zi2')xi2 + k21xn + k23xl3 + U12, (5) (Xi3 = -ai3(zi3')xi3 + кз1Хц + кз2^ + ий, where ktj, i * j are the coefficients of mutual influence of xt1, xt2, xi3 particular indicators. Numerical values of ktj coefficients are determined by expert analysis; cttj(ztj) are the coefficients of feedbacks of private integral indicators that depend on ztj administrative and legal control actions at the level of regional management structures; ut1, ui2, ui3 are financial and economic control actions.
The proposed models of quality of life as an integral index of the quality of the societal system functioning and development allowed us to study the structure, evaluate this indicator and study the dynamics of its changes.
Algorithm for managing the quality of the societal system functioning
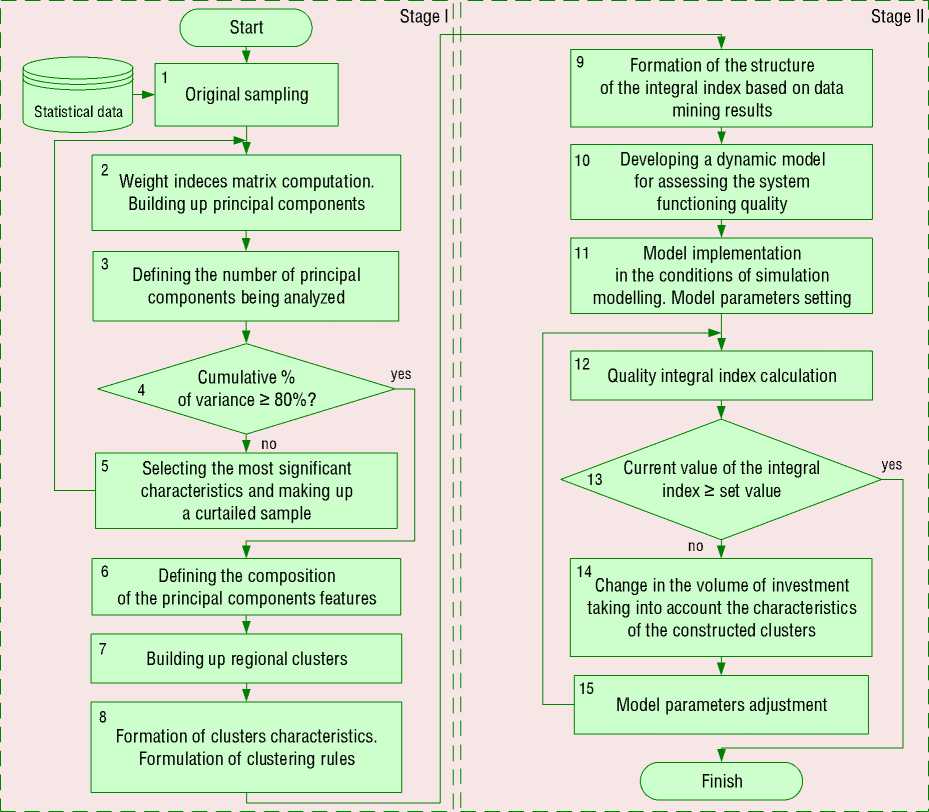
The algorithm developed by the authors is designed to work out recommendations for managing the societal system based on an assessment of the integral index of its functioning quality. The algorithm includes two main stages (Fig. 2).
The first stage involves data mining on the functioning quality of the societal system in the regional context in the selected area. The second stage includes developing a dynamic model of quality assessment and recommendations for managing the societal system in the form of changes in the volume of investments. Let us look at these stages in more detail.
The first step of the algorithm includes the formation of the original sample of data on the quality of the societal system functioning in the selected area.
At the second step , a component analysis of the original sample is performed using the static data analysis package StatGraphics : a table of feature weights in the principal components is constructed; significant features with large modulo weight coefficients are identified; the composition of the main components is determined based on the information coefficients calculation.
The StatGraphics package was chosen due to its advantages, such as a combination of scientific methods for processing various types of data with the ability to create modern high-quality interactive graphics; extensive interaction with other software products (spreadsheets, databases); high-quality twodimensional and three-dimensional graphics, and more. A comparative analysis of software products for static data analysis is given, for example, in [19].
The third step determines a number of principal components to be analyzed.
The fourth step involves checking up whether the required cumulative percentage of variance is reached. If this condition is not
Figure 2. Algorithm scheme of quality management of the societal system functioning
Source: authors’ development.
met, then the fifth step is as follows: the weight coefficients of the features are analyzed and the most significant features having highest weight are selected. Next, a component analysis of the curtailed sample is performed (steps 2–4).
If the condition is met, then the sixth step includes determining the composition of the principal component features, based on the information coefficients calculating.
At the seventh step , the regional clusters are built.
At the eighth step , the clusters’ characteristics, relative to the principal components and relative to the features, are formed. The rules of assigning regions to clusters are formulated.
On the ninth step , the structure of the integral index of quality of the societal system functioning based on the principal components and the composition of features is formed: a number of the subsystems and their elements are determined, and the coefficients of the relations between elements and subsystems are calculated.
A number of subsystems corresponds to a number of principal components being analyzed, and a number of subsystem elements corresponds to a number of features of corresponding components.
The values of the influence coefficients of i component of at on the integral index of the system functioning quality are calculated using the following formula :
A ;
-=^
where A; is the percentage of variance of the i component; ∆∑ is the cumulative percentage of variance for the constructed principal components.
The values of the coefficients of influence of j attribute on i component eiy are calculated using the formula:
P ty =
Wy ^Wy,
where wtj is weight coefficients of the features of i component, m is a number of features of i component.
At the tenth step , a dynamic model for assessing the quality of the societal system functioning, based on the calculation of an integral index, is developed. The model is presented in the form of continuous differential equations and is used for conducting experimental studies to assess the quality of the societal system functioning in different areas, as well as to study the dynamics of changes in the integral index under controlling and disturbing influences.
At the eleventh step, a simulation model based on the dynamic model is developed, and the model parameters are set. The model is implemented by means of the MatLab Simulink mathematical modeling package. The choice of this package is caused by the fact that it has a wide range of functions for plotting and visualizing results, the ability to develop a user interface, as well as opportunities for dynamic modeling and development of control systems. A comparative analysis of software products for simulation modeling is given, for example, in [20].
At the twelfth step , an integral index of the system’s functioning quality is calculated.
At the thirteenth step , the calculated (current) value of the integral index is compared with the specified (target) value and the deviation is calculated. If the deviation is greater than zero (the current value is greater than or equal to the target value), the algorithm terminates. If the deviation is less than zero, then the transition to the fourteenth step is performed, which involves changing the investment volume taking into account the characteristics of the built clusters.
At the fifteenth step , the model parameters are adjusted, and the transition to step 12 is performed.
It should be noted that the proposed algorithm does not limit the choice of tools for its implementation, and other tools available to the researcher can be used for statistical data analysis and dynamic modeling.
Social infrastructure quality management
Let us consider the application of the proposed algorithm for managing the quality of social infrastructure, based on the assessment of an integral index and working out recommendations by changing the volume of investments in social infrastructure development.
In modern conditions, infrastructure plays an important role in the formation of a single economic space, and it is considered a special social and market institution [21].
There are production and non-production (social) infrastructure. Social infrastructure in a broad sense refers to industries and economic activities that meet the needs of the population in maintaining health, getting education, spending leisure time, etc. in order to form and accumulate social capital, reproduce intangible assets to support the country’s global competitiveness [22]. In a narrow sense, social infrastructure includes health care, education, housing and communal services, social services, culture and sports, and employment organizations. Thus, the social infrastructure provides the necessary level and quality of life.
One of the most important problems in Russia today is the problem of financing social infrastructure. The main investor providing financial resources in social infrastructure development is the government. The analysis of theoretical and methodological approaches to assessing the effectiveness of public investment in infrastructure is given in [22]. The authors’ works [23] devoted to the study of the impact of public investment on social infrastructure as the most powerful factor contributing to the growth of labor productivity, the creation of new jobs, and the equalization of the pace of regions’ socio-economic development are particularly noted.
However, public funds are not enough for the social sphere development, and private investors need to be attracted. To this end, public-private partnership projects are being implemented, most of them are in the field of health and education, much less are in the field of tourism, culture, physical education, sports, and social services [24].
Given the complex territorial organization of the Russian Federation and its considerable territorial extent, it is advisable to consider the social infrastructure of the country as a whole and its regions. It should be noted that one of the key priorities of regional policy is balanced spatial development, and this task should be addressed at the federal and regional levels [25]. However, according to the authors of the study [26], there is currently no systematic approach to development of infrastructure in Russia’s regions: there is no clear plan for integrated development of territories, a unified assessment of the infrastructure state, investments are determined based on the current needs, the planning horizon does not exceed two or three years, and development strategies are often not implemented.
We prepared a sample of data describing the state of various areas of social infrastructure in the context of the Russian Federation’ regions. The sample is based on data published by the Federal State Statistics Service of the Russian Federation1. Initially, we considered twenty-two features that characterize the state of housing and communal services, education, health, culture and art, information communications, and retail trade.
A component analysis of the original sample was carried out; based on the results of the analysis, the most significant features for each area were selected, and a curtailed sample was formed. Then a component analysis of the curtailed sample was performed and four principal components (PC) were constructed. The weight coefficients of the indicators of the constructed principal components are presented in table 1.
The authors identified significant indicators having large modulo weight coefficients (they are highlighted in tab. 1 in bold) and calculated the values of the information coefficients of the principal components, which made it possible to determine their composition. The first principal component includes the following indicators: coverage of children by preschool education, number of organizations of secondary vocational education, number of hospital beds, capacity of outpatient clinics, number of museums, number of gyms.
Table 1. Weight coefficients of the principal components’ features
|
Indicator |
Weight coefficients |
|||
|
PC1 |
PC2 |
PC3 |
PC4 |
|
|
Total area of residential premises, on average per inhabitant |
0.146 |
-0.321 |
-0.398 |
0.224 |
|
Volume of public services per capita |
0.218 |
-0.438 |
0.145 |
0.021 |
|
Coverage of children by preschool education |
0.336 |
-0.277 |
-0.232 |
-0.018 |
|
Number of comprehensive educational organizations |
0.288 |
0.400 |
0.122 |
-0.097 |
|
Number of organizations of secondary vocational education |
0.415 |
0.157 |
0.112 |
0.075 |
|
Number of organizations of higher education |
-0.103 |
-0.195 |
0.383 |
0.505 |
|
Number of hospital beds |
0.363 |
-0.014 |
0.163 |
0.089 |
|
Capacity of outpatient clinics |
0.358 |
-0.137 |
-0.004 |
0.153 |
|
Number of theaters |
-0.011 |
0.103 |
0.422 |
0.543 |
|
Number of museums |
0.385 |
0.111 |
0.102 |
-0.071 |
|
Number of flat sports facilities |
0.016 |
-0.001 |
-0.469 |
0.437 |
|
Number of gyms |
0.379 |
0.150 |
-0.068 |
-0.101 |
|
Population using the Internet |
0.005 |
-0.293 |
0.377 |
-0.338 |
|
Retail trade turnover per capita |
0.015 |
-0.506 |
0.104 |
-0.182 |
All indicators have positive coefficients. The second principal component includes two indicators with negative coefficients (volume of public services per capita and retail trade turnover per capita) and one indicator with a positive coefficient (number of comprehensive educational organizations). The third principal component included two indicators with negative coefficients (total area of residential premises, on average per inhabitant and number of flat sports facilities), and one indicator with a positive coefficient (population using the Internet). The fourth main component includes two indicators with positive coefficients: number of organizations of higher education and number of theatres. The signs of the coefficients are taken into account when making recommendations for changing the volume of investments in infrastructure development.
The authors constructed two-dimensional and three-dimensional scattering diagrams of principal components. After its analysis, 9 regional clusters with different levels of social infrastructure development were identified. The clusters characteristics relative to the principal components are shown in table 2 .
Table 2. Clusters characteristics relative to the principal components
|
Development level |
Cluster number |
PC1 |
PC2 |
PC3 |
PC4 |
|
Most developed infrastructure |
4 |
low |
low |
high |
average |
|
5 |
high |
average |
high |
average |
|
|
9 |
high |
low |
high |
high |
|
|
Medium developed infrastructure |
1 |
average |
average |
low |
low |
|
2 |
average |
average |
average |
low |
|
|
7 |
low |
low |
average |
low |
|
|
Least developed infrastructure |
3 |
low |
average |
high |
low |
|
6 |
average |
high |
high |
average |
|
|
8 |
low |
high |
high |
low |
Source: compiled by the authors based on the results of the analysis of the location of clusters in the space of principal components.
The regional clusters with most advanced infrastructure include Moscow, St. Petersburg, Nenets AO, Chukotka AO, Kamchatka Krai, Jewish AO, Sakhalin Oblast, Magadan Oblast, and others.
The clusters with medium-developed infrastructure include the Republic of Bashkortostan, Sverdlovsk Oblast, Chelyabinsk Oblast, Bryansk Oblast, Kaluga Oblast, Astrakhan Oblast, Volgograd Oblast, Novosibirsk Oblast, and others.
The clusters with the least developed infrastructure include Murmansk Oblast, Tula Oblast, Republic of Kalmykia, Altai Republic, Zabaykalsky Krai, Dagestan, Ingushetia, and other.
It should be noted that, when determining the level of infrastructure development, the signs of the indicators’ weight coefficients, included in the principal components, are taken into account. Thus, the first and fourth principal components include indicators that have only positive coefficients, so the higher their values, the higher the level of infrastructure development. And the second and third principal components include indicators that have negative coefficients: “Volume of public services”, “Retail trade turnover”, “Total area of residential premises, on average per inhabitant” and “Sports flat structures”. Therefore, the lower the values of these indicators are, the higher the level of infrastructure development is.
Based on the constructed principal components and the composition of their indicators, the structure of the integral index of social infrastructure quality is formed. A number of subsystems corresponds to a number of principal components, and it is equal to four, a number of subsystems elements is equal to a number of indicators included in the corresponding principal component. Thus, for the first principal component, a number of indicators is six, for the second and third principal components – three, for the fourth principal component – two.
The integral index of social infrastructure quality I s is calculated similarly to the integral index of the quality of life as a weighted sum of the components K :
Ss = ^ atKt , (8)
i=1
where a coefficients are found by the formula (6).
The dynamics of changes in the integral index I s is described by a differential equation as follows:
I s = -Is + a J K + a2K + ^3 . (9)
The dynamics of changes in K components is described by differential equations as follows:
Ki = ЛцК 1 + X12K2 + X 13 K 3 + X14K4 + Ию , K = -Х зз К + X 21 K 1 + X 23 K 3 + X 24 K 4 + K2 o , K3 = -X33K3 + X31K1 + X32K2 + X34K4 + K30 , . K 4 = -X44K4 + X41K1 + X42K2 + X43K3 + K40 ,
where Kto, i = 1,4 are the initial value of K components; X^ , i Ф j are the weight coefficients reflecting the mutual influence of K components. The values of xi7- coefficients are determined by expert analysis based on statistical data.
The initial values of K components are defined as the weighted sum of the indicators values included in the corresponding principal component :
K 10 — 3 11- ^ 11 + 3 12- ^ 12 + 3 13- ^ 13 + 3 14- ^ 14 + + 3 15-15 + 3 16-16 ,
K20 = 321-^21 + 322-^22 + 323-^23,
K30 = Зз1Х31 + 332^32 + $33X33>(13)
K40 = 341^41 + 342^42, where 3;; coefficients are calculated by the formula (7).
The dynamics of indicators’ changes based on statistical data; и^ are the financial and x1j, j = 16 for the first principal component is described by the differential equations as follows:
fhi =
*12 =
*13 =
*14 =
* 15 =
1* 16 =
-* 11 + ^ 112 * 12 + 113 * 13
-* 12 + 121 * 11 + 123 * 13 -* 13 + 131 * 11 + 132 * 12 -* 14 + 141 * 11 + 142 * 12 -* 15 + 151 * 11 + 152 * 12 -* 16 + 161 * 11 + 162 * 12
+ 114 * 14 + 115 * 15 + 116 * 16 + “ 11 .
+ 124 * 14 + 125 * 15 + 126 * 16 + “ 12 .
+ 134 * 14 + 135 * 15
+ 143 * 13 + 145 * 15
+ 153 * 13 + 154 * 14
+ ^ 163 * 13 + 164 * 14
+ ^ 136 * 16 + “ 13. , .
+ ^ 146 * 16 + “ 14 . (15)
+ 156 * 16 + U15 , + ^ 165 * 15 + “ 16 .
economic control effects (investment volume).
Based on the clusters’ characteristics relative to the principal components, given in table 2, we developed recommendations for changing the volume of investment ( Ut ) in social infrastructure by regional clusters (Tab. 3) . The up arrow “ ↑ ” indicates the need to increase
The dynamics of indicators’ changes x2j, j = 1,3 for the second principal component is described by the differential equations as follows:
t ^ 21 = ^ 21 + ^ 212 ^ 22 + ^ 213- ^ 23 + u21 , j% 22 = -X 22 + ^ 221 X 21 + U 223 X 23 + U 22 , X23 = —X23 + ^ 231X21 + ^ 232X22 + U23 ,
The dynamics of indicators’ changes x3j, j = 1,3 for the third principal component is described by the differential equations as follows:
Г x3i = jX32 =
X33 =
X31 + ^ 312X32 + ^ 313X33 + u31 ,
X32 + ^ 321X31 + ^ 323X33 + ^ 32 , (17)
X33 + ^ 331X31 + ^ 332X32 + ^ 33 ,
The dynamics of indicators’ changes x4j , j = 1,2 for the fourth principal component is described by the differential equations as follows:
[ X41 =
IX42 =
X41 + ^ 412X42 + U 41 ,
X42 + ^ 421X41 + U 42 ,
where k iji are weight coefficients reflecting the mutual influence of indicators. Numerical values of k ijl coefficients are determined by expert analysis
investment in the relevant areas. For example, for cluster 8, the PC1 value is “low”, therefore, to increase the level of development of social infrastructure for cluster 8, it is necessary to increase the amount of investment in those areas (indicators) that are included in the specified component. The signs of the weight coefficients of the indicators included in the principal components are taken into account. For example, for cluster 7, the PC2 value is “low”, but it includes indicators with a negative sign, and a low sign of the indicator means a high level of development in this area, so no additional investment is required.
It should be noted that no additional investment was planned for the regional clusters with the most developed infrastructure.
The volume of investment in social infrastructure in the regions of the Russian Federation for 2016 and 2017 is compared, and the relative changes in the values of investment in different areas by cluster are calculated. Taking into account the recommended changes in investment volume for regional clusters and
Table 3. The recommended change in investment volume
|
Cluster no. |
recommended change in investment volume |
|||
|
U 1 |
U 2 |
U 3 |
U 4 |
|
|
Cluster 8 |
↑ |
↑ |
↑ |
↑ |
|
Cluster 6 |
↑ |
↑ |
||
|
Cluster 3 |
↑ |
↑ |
↑ |
|
|
Cluster 7 |
↑ |
↑ |
||
|
Cluster 2 |
↑ |
↑ |
||
|
Cluster 1 |
↑ |
|||
Table 4. Assessment of social infrastructure quality
the volume of investments, taking into account the characteristics of the constructed clusters.
Developed recommendations may be used by federal and regional authorities while developing strategic documents aimed at improving population’s quality of life.
References Assessing population's quality of life on the basis of intelligent algorithms and dynamic modeling
- Shtompka P. Sotsiologiya. Analiz sovremennogo obshchestva [Sociology. Analysis of Modern Society]. Translated from Polish by S.M. Chervonnaya. Moscow: Logos, 2005. 664 p.
- Bell D. Gryadushchee postindustrial’noe obshchestvo. Opyt sotsial’nogo prognozirovaniya [The Coming Post-Industrial Society. A Venture of Social Forecasting]. Moscow: Akademiya, 1999. 462 p.
- Ivanov V.V., Malinetskii G.G. Rossiya XXI vek. Strategiya proryva. Tekhnologii. Obrazovanie [Russia 21st Century. Breakthrough Strategy. Technologies. Education]. Nauka. Izd. 3-e, stereotip. Moscow: LENAND, 2018. 304 p.
- Lapin N.I. Socio-cultural approach and the societal and functional structures. Sotsiologicheskie issledovaniya=Sociological Studies, 2000, no. 7, pp. 3–12 (in Russian).
- Morozov V.A. The structure of society, interaction of its subsystems and elements. Ekonomicheskie strategii=Economic Strategies, 2017, no. 6, pp. 202–211 (in Russian).
- Podvoiskii D.G. Subject-methodological self-determination of the new science of human society: Auguste Comte and his theory. Vestnik RUDN, seriya Sotsiologiya=RUDN Journal of Sociology, 2002, no. 1, pp. 100–115 (in Russian).
- Zakieva E.Sh. Analysis of the properties of the society as a dynamical system on the basis of simulation modeling. Informatizatsiya obrazovaniya i nauki=Informatization of Education and Science, 2019, no. 3 (43), pp. 148–160 (in Russian).
- Parsons T. Sistema sovremennykh obshchestv [The System of Modern Societies]. Translated from English. Ed. by M.S. Kovaleva. Moscow: Aspekt Press, 1998. 270 p.
- Aivazyan S.A. Analiz kachestva i obraza zhizni naseleniya [Analysis of the Quality and Lifestyle of the Population]. Moscow: Nauka, 2012. 432 p.
- Sinha B.R.K. Multidimensional Approach to Quality of Life Issues: A Spatial Analysis. Springer Nature, 2019. 457 p.
- Discoli C., Martini I., San Luan G., Barbero D., Dicroce L., Ferreyro C., Esparza J. Methodology aimed at evaluating urban life quality levels. Sustainable Cities and Society, 2014, no. 10, pp. 140–148.
- Massam B.H. Quality of life: public planning and private living. Progress in planning, 2002, no. 58, pp. 141–227.
- Mellor D., Cummins R.A., Loquet T. Life quality and wealth: A qualitative and quantitative comparison of affluent and poor people. Journal of Social Research and Policy, 2012, vol. 3, no 2, pp. 7–18.
- Ruževičius J., Akranavičiūtė D. Quality of life and its components measurement. Engineering economics, 2007, vol. 2, pp. 43–48.
- Somarriba N., Pena B. Synthetic indicators of quality of life in Europe. Social Indicators Research, 2009, no. 94(1), pp. 115–133.
- Rossoshanskii A.I., Chekmareva E.A. Current state and development of the theory and the method to study quality of life of the population. Problemy razvitiya territorii=Problems of Territory’s Development, 2016, no. 1 (81), pp. 145–159 (in Russian).
- Cummins R.A. Objective and subjective quality of life: An interactive model. Social Indicators Research, 2000, vol. 52, no. 1, pp. 55–72.
- Ilyasov B.G., Gerasimova I.B., Makarova E.A., Zakieva E.Sh. Objective-subjective approach to the assessment of quality of life. Kachestvo. Innovatsii. Obrazovanie=Quality.Innovation.Education, 2016, no. 2 (129), pp. 47–57 (in Russian).
- Gorokhov M.M., Saetova L.G. Comparison of software for statistical data analysis. Sotsial’no-ekonomicheskoe upravlenie: teoriya i praktika=Socio-Economic Management: Theory and Practice, 2018, no. 2 (33), pp. 61–63 (in Russian).
- Skorodumov P.V. Simulation modelling of economic systems: Software tools and areas of improvement. Problemy razvitiya territorii=Problems of Territory’s Development, 2015, no. 2 (76), pp. 62–72 (in Russian).
- Logacheva N.M. Social infrastructure as a factor of regional development. Vestnik Ural’skogo instituta ekonomiki, upravleniya i prava=Bulletin of the Ural Institute of Economics, Management and Law, 2011, no. 2(15), pp. 57–65 (in Russian).
- Smirnova T.L. Trends in budget financing of infrastructure in Russia. Ekonomicheskie otnosheniya=Journal of International Economic Affairs, 2019, vol. 9, no. 3, pp. 2093–2106. DOI: 10.18334/eo.9.3.40658 (in Russian).
- Chatterjee S., Gibson J., Rioja F. Public investment, debt, and welfare: A quantitative analysis. Journal of Macroeconomics, 2018, pp. 204–217. DOI: 10.1016/j.jmacro.2018.01.007.
- Voronina V.S. Characteristics of social infrastructure financing. Gosudarstvenno-chastnoe partnerstvo=Public-Private Partnership, 2016, vol. 3, no. 4, pp. 235–246. DOI: 10.18334/ppp.3.4.37415 (in Russian).
- Gainanov D.A., Biglova G.F., Ataeva A.G. Strategic management of key development potential of split-level territorial socio-economic systems. Ekonomicheskie i sotsial’nye peremeny: fakty, tendentsii, prognoz=Economic and Social Changes: Facts, Trends, Forecast, 2017, vol. 10, no. 2, pp. 77–89. DOI: 10.15838/esc/2017.2.50.4 (in Russian).
- Zhundrikov A. et al. Infrastruktura Rossii: indeks razvitiya [Infrastructure of Russia: Development Index]. Available at: https://infraone.ru/analitika/Index_razvitiia_infrastruktury_Rossii_InfraONE_Research.pdf (accessed: 08.06.2020).
