Assessment and Feedback as Predictors for Student Satisfaction in UK Higher Education

Author: Georgios Rigopoulos
Journal: International Journal of Modern Education and Computer Science @ijmecs
Article in issue: 5 vol.14, 2022.
Free access
Assessment and feedback mechanisms are essential components towards effective teaching in higher education and are continuously monitored. The annual student satisfaction survey in UK higher education collects students’ perception on those dimensions and issues results to assist institutions identify their weaknesses and amend their strategies and improve their teaching effectiveness. This study explores assessment and feedback as predictors for overall student satisfaction. It focuses on business schools mainly and uses the officially published dataset. Following a regression analysis approach, it can be concluded that there is evidence to support the claim that assessment and marking can be used as predictors for overall student satisfaction in this subdomain. The significance of the study lies in the fact that universities consider assessment and feedback as of key importance for improving student experience. It is thus critical for the institutions to gain a better understanding on whether those factors can be safely used as predictors of overall student satisfaction, something that is related to university ranking tables. Results in the study, demonstrate some important aspects of this and indicate that improved quality in marking and feedback can have a positive effect in student satisfaction. A more comprehensive study can unfold additional dimensions of the survey and shed light on how students perceive marking, assessment and feedback in higher education in general.
Student satisfaction, student assessment, student feedback
Short address: https://sciup.org/15019084
IDR: 15019084 | DOI: 10.5815/ijmecs.2022.05.01
Text of the scientific article Assessment and Feedback as Predictors for Student Satisfaction in UK Higher Education
Assessment and feedback have gained a prominent importance and are considered as key factors for student satisfaction, which leads to increased motivation for academic achievements and subsequently academic progression [1]. The two most widely applied assessment approaches are formative and summative assessment [2]. In both, feedback is considered as a critical component that influences academic behaviour. Studies in various disciplines support the improvement on student engagement [3] and satisfaction [4] as a result of quality and individual feedback.
Following this research stream, universities and academics value feedback provision to students as a critical component of course design and delivery. Despite the effort spent from academics to fulfil the increased demands for high quality individual feedback provision in the past years, there is little evidence on how students perceive it, how they actually use it and whether it works towards their academic progression in a positive way [5, 6, 7]. Murphy and Cornell [8] performed a focus group study among three UK universities to examine student perceptions on feedback and identified mismatch between student expectations and provided feedback. It is not only quantity, but also quality, timing, clarity that also count for students. Or else it results into effort from academics to feedback that is wasted, as poor feedback is not either read or of any value to students. It is thus important for educators and institutions to gain better understanding on the perception of feedback among students in order to optimize their actions.
Higher education institutions, following pedagogical research and suggestions, pay a lot of attention to marking and feedback and spend substantial effort in educating academics to follow best practices, in a way to follow fair practices on the one hand, but valuable services for students on the other. All academics, invest time to adhere to the requirements and spent considerable amount of time during marking to provide valuable feedback to students, for both formative and summative assessments and not only. It is questionable, however, whether this approach results into students’ value and on top of this, whether students perceive it as valuable and if this is reflected at student satisfaction surveys in a positive way. Universities in UK, rely on the national student survey results for student satisfaction to adapt their policies and strategies. However, not many studies exist, which explore the various dimensions of student satisfaction and whether they can be utilized as safe predictors.
This topic study aims to set the ground and explore some aspects of assessment and feedback, mainly its perception by students and the way it is measured by the UK national student survey. It focuses on the question, whether they could be used as predictors for the overall student satisfaction, an important indication for institutions and their policies. On the other hand, it provides some general insights for higher education policy makers, which could be useful for further exploration and improvement of the higher education assessment and feedback practices.
2. Student Feedback Context
Academics in higher education pursue to find ways to enhance the effectiveness of their teaching, as it is one pillar of their contribution in academia, with research being the other one. Assessment and feedback mechanisms are considered as essential components towards effective teaching, but they have to be perceived by students as fair and valuable, as well, in order to influence academic performance in a positive way [9].
Widely known mainstream guidelines [10, 11] for academics suggest providing clear and timely marking criteria or a marking rubric, feed forward comments and focusing on merits and improvements, rather than on errors and issues. Although, during the past years they usually apply the best practices on feedback, it is not always evident at what extent students perceive that positively or of actual value, especially the feedback. For example, it is common practice to provide summative feedback at the final assignments, but it looks that in most of the times it is released too late to be of actual value for future student essays. Time elapsing between student submission and feedback availability can reach even two months, due to marking and moderation required plus validation, especially for large cohort modules, which made the feedback marginally useful for students. The worst of all is that some students might not read their feedback it at all. This is one of the issues that Murphy and Cornell [8] also acknowledge among others as a serious issue with regards to feedback. An assertion in this work then is that, under this delayed process, summative assessment feedback is not useful for the current term modules, but for next terms modules, as it was received by students late enough to be utilized. Moreover, when providing such feedback, educator has to consider student’s future, and relevant, works so as to propose valuable points for improvement. As such, it requires a holistic consideration of student’s obligations from educator with wider perspective than the current module. This holistic approach, of course, requires that educators share the same point of view and provide summative feedback for the benefit of other modules. Harrison et al [12] support such a view, as they claim a shift from summative assessment feedback per se towards a more integrated culture from assessment of learning to assessment for learning.
Formative assessment feedback, on the other hand, is informal and open to many interpretations and criticism on whether it actually contributes at student performance improvement. Perera et al [9] provide evidence of significant mismatch on what students expect and value in contrast to educators’ perceptions. Context is important, but also the ability to interpret students’ perceptions and adapt feedback content appropriately. Formative feedback is thus meant to be a dialogue within the module to advance students’ learning in the specific module, while summative feedback a dialogue in the context of a program to assist students in a wider perspective [13, 14, 15, 16].
Trying to address the gap in the way students perceive feedback, one can find a limited number of publications focusing on meta analysis of National Student Survey (NSS) data and offer useful insights for institutes [8]. Studies which focus on factors that can be used as predictor variables for overall student satisfaction are relatively rare. Such an analysis would assist institutes focus on and develop mainly the dimensions that could potentially lead to increase of student satisfaction.
This study and the subsequent analysis aim to address this gap and is meant to be a preliminary analysis of whether association exists between assessment and feedback and overall student satisfaction. Also, to examine if assessment and feedback can be considered as predictor variables for overall student satisfaction at some extent. Following the above stream of thought, this study aims to unfold some aspects of assessment and feedback, locate points for improvement and discuss some policy implications, by student responses recorded in National Student Survey (NSS). For this reason, quantitative analysis of the NSS data was performed for years 2017-2021 on the one hand, to identify key elements of student feedback perception.
3. Assessment, Feedback and Overall Satisfaction in National Student Survey
The UK National Student Survey (NSS) aims to measure student satisfaction as well as support ranking of Higher Education Institutes in UK. It is linked with the transformation of UK Higher Education sector into an open market where institutions compete on services offered to students [17]. Regardless of the point of view, it has been one of the most influential tools for institutes and prospective students [18]. UK Universities consider NSS findings, as a valuable source of student feedback [19]. They alter strategies or amend their services to students in order to improve their quality, gain a higher position at the rankings, and furthermore to attract the most motivated and capable students [20]. This is an ongoing process towards improving quality of Higher Education, although survey findings are not free of criticism. Vague questions, possible unreliability of quantitative data and limited qualitative data analysis are reported among others [21].
The importance of assessment and feedback for higher education, and how students perceive it as part of their experience, is reflected in NSS, which includes a section of four questions (Q8-Q11) related to assessment, marking and feedback (Table 1). Student overall satisfaction on course quality is one of the questions of NSS survey (Q27) as part of the ‘Student Voice’ section and is considered as an indicator of overall student satisfaction among Higher Education
Institutes (Table 1).
Table 1. NSS questions included in the study
-
• Assessment and feedback Questions
o Q8 The criteria used in marking have been clear in advance o Q9 Marking and assessment has been fair o Q10 Feedback on my work has been timely o Q11 I have received helpful comments on my work
• Overall satisfaction Question
4. Satisfaction and Student Academic Performance
o Q27 Overall, I am satisfied with the quality of the course
University ranking tables published annually include it as a key metric among others for listing and comparing institutes, and universities use it to assess their quality of services and improve their offer at prospective students. Institutes pursue to improve this index every year by adopting strategies or trying to amend dimensions as they are represented in the NSS results. Among other factors institutes invest in time and resources to improve their assessment and feedback strategies for both pedagogical reasons and at the same time to influence positively student performance and overall satisfaction.
In this study we explore the association between NSS assessment and feedback results and the overall student satisfaction metric, whether the four questions can be used as safe predictors for it, and how strong they influence satisfaction and performance. It is an attempt to explore the domain, as there are few relevant studies, and propose some lines of thought that could be of interest for both institutes and educators.
Academic performance contains formal and informal elements. The most widely known tools to measure it are summative and formative assessments [22]. Formative assessment can be defined as a collaborative process between academics and students, aiming to inform students on their progress level and at the same time provide feedback to tutors in order to align teaching to maximise student learning. Academics use it as an indicator of the achieved knowledge and skill level for students, and as a way to measure the effectiveness of their teaching. While summative assessment is formal and cumulative, is graded and signifies knowledge level, quality of learning and performance against standards [23].
Summative assessment is accounted mostly as indicator of academic performance, as it is designed to be valid and reliable, while formative is more subjective in nature. It seems that often summative feedback arrives too late for students, as they have already finished their works and might not even read it [24]. Or it might be too narrow on focus, that cannot be used in other modules in the future. So feedback is neglected and does not contribute to academic performance, even if there is a debate on whether there exist a link between feedback and academic performance, or academic performance is mostly related to cognitive factors mainly.
In terms of factors that influence or directly affect academic performance of HE students, there is plenty of research examining from alternative dimensions [25]. The key outcome is that trying to identify valid predictors of academic performance is a complex problem and limiting them to a small number presents only a partial view [13]. It would be rather considered as a composite phenomenon, where economic and social factors are combined with personal and psychological ones contribute at specific context [26]. Schneidr and Preckel [26] present an extensive review of meta analyses on higher education achievement in order to indicate factors that are associated with academic performance and they point that “institutional commitment”, which reflects students’ satisfaction with their institution shows a moderate association with academic achievements.
Other empirical studies, at specific institutional contexts, indicate a moderate also association between satisfaction and performance. They attribute performance to be related to cognitive factors more rather than to satisfaction. However, they find that satisfaction is positively related to student motivation and engagement, influencing indirectly the performance [27].
So, in overall, studies indicate that increased student satisfaction is positively associated with increased student motivation and engagement that can lead to a better performance [26]. Overall student satisfaction, as measured by NSS, is a key metric for HE institutes to prioritise those actions and strategies that can contribute the most towards increasing student satisfaction, influencing thus student performance and their ranking. One way to identify such actions is by analysing NSS data, which reflect students’ voice, considering of course all survey assumptions and limitations beforehand, to avoid oversimplifications.
5. Methodology and Data
The basis for the study was the NSS published data for the past five years, ranging between 2017 and 2021. The NSS questionnaire was revised at 2017, so the decision was to limit the study to years following 2017 to avoid data conversion and misinterpretation. The datasets used were the ones for teaching providers, and the ‘Common Aggregation Hierarchy level 1’ was used for the subjects. From the subject list, the ‘Business and Management’ subject was selected for the study. From the annual data files the ‘%Agree’ answers in questions 8,9,10,11,27 were used, which correspond to the ‘Definitely agree’ and ‘Mostly agree’ responses at the five point Response scale (Response scale: Definitely agree; Mostly agree; Neither agree nor disagree; Mostly disagree; Definitely disagree; Not applicable). So, the analysis focuses on respondents who agree with the statements as expressed in the questions. This approach is in line with relevant studies and the presentation of results from Office for Students [21]. All institutions were included in the analysis per year, even if there were small differences in the number of institutions per year and/or missing data. There was no clustering or selection of some representative sample, as this would require further analysis and the study was not focusing at a specific set. Some effort was performed to clean or organise data, but in general the datasets were considered as valid and accurate for the scope of this study.
The questions that were included in the study are the ones under the ‘Assessment and Feedback’ section (Q8, Q9, Q10, Q11), and the question for overall satisfaction (Q27), under the ‘Overall Satisfaction’ section (Table 1). Including all NSS questions in the analysis would provide a more reliable model, but it would also require the application of more advanced statistical techniques to eliminate non-contributing factors and identify possible relationships among factors. As the focus of the study was a preliminary investigation on assessment and feedback association to satisfaction, the decision was to consider only the subset of the four questions and not the total set of survey questions.
So, each of the four assessment and feedback questions was set as independent or predictor variable and the satisfaction question was set as the dependent variable. For the analysis, correlation matrices were populated and in order to identify the contribution of each of the four factors (Q8, Q9, Q10, Q11) to overall satisfaction (Q27), as dependent variable, a multiple linear regression model was built with all four factors included as predictors.
6. Results
For all years, we found a statistically significant strong positive correlation among the four factors (Q8, Q9, Q10, and Q11) to overall satisfaction (Q27). Q8 appeared to have the strongest correlation with Q27 in most of the years, followed by Q9 and Q10 (Tables 2, 3, 4, 5, 6).
Table 2. Correlation between overall student satisfaction (Q27) on assessment and feedback factors (Q8, Q9, Q10, Q11) for 2017
|
Q27 |
Q8 |
Q9 |
Q10 |
Q11 |
|
Q27 Overall, I am satisfied with the quality of the course |
,617** |
,513** |
,620** |
,566** |
|
Q8 The criteria used in marking have been clear in advance |
,629** |
,587** |
,688** |
|
|
Q9 Marking and assessment has been fair |
,605** |
,714** |
||
|
Q10 Feedback on my work has been timely |
,689** |
|||
|
Q11 I have received helpful comments on my work |
Table 3. Correlation between overall student satisfaction (Q27) on assessment and feedback factors (Q8, Q9, Q10, Q11) for 2018
|
Q27 |
Q8 |
Q9 |
Q10 |
Q11 |
|
Q27 Overall, I am satisfied with the quality of the course |
,691** |
,549** |
,576** |
,530** |
|
Q8 The criteria used in marking have been clear in advance |
,691** |
,624** |
,660** |
|
|
Q9 Marking and assessment has been fair |
,526** |
,704** |
||
|
Q10 Feedback on my work has been timely |
,664** |
|||
|
Q11 I have received helpful comments on my work |
Table 4. Correlation between overall student satisfaction (Q27) on assessment and feedback factors (Q8, Q9, Q10, Q11) for 2019
|
Q27 |
Q8 |
Q9 |
Q10 |
Q11 |
|
|
Q27 Overall, I am satisfied with the quality of the course |
,620** |
,582** |
,549** |
,576** |
|
|
Q8 The criteria used in marking have been clear in advance |
,782** |
,592** |
,678** |
||
|
Q9 Marking and assessment has been fair |
,600** |
,718** |
|||
|
Q10 Feedback on my work has been timely |
,699** |
||||
|
Q11 I have received helpful comments on my work |
|||||
Table 5. Correlation between overall student satisfaction (Q27) on assessment and feedback factors (Q8, Q9, Q10, Q11) for 2020
|
Q27 |
Q8 |
Q9 |
Q10 |
Q11 |
|
|
Q27 Overall, I am satisfied with the quality of the course |
,603** |
,603** |
,559** |
,464** |
|
|
Q8 The criteria used in marking have been clear in advance |
,757** |
,630** |
,671** |
||
|
Q9 Marking and assessment has been fair |
,647** |
,742** |
|||
|
Q10 Feedback on my work has been timely |
,707** |
||||
|
Q11 I have received helpful comments on my work |
|||||
Note: ** = Correlation is significant at the 0.01 level (2-tailed).
Table 6. Correlation between overall student satisfaction (Q27) on assessment and feedback factors (Q8, Q9, Q10, Q11) for 2021
|
Q27 |
Q8 |
Q9 |
Q10 |
Q11 |
|
|
Q27 Overall, I am satisfied with the quality of the course |
,636** |
,683** |
,560** |
,601** |
|
|
Q8 The criteria used in marking have been clear in advance |
,758** |
,680** |
,801** |
||
|
Q9 Marking and assessment has been fair |
,605** |
,761** |
|||
|
Q10 Feedback on my work has been timely |
,786** |
||||
|
Q11 I have received helpful comments on my work |
|||||
|
Note: ** = Correlation is significant at the 0.01 level (2-tailed). |
|||||
Results show also that moderate strong correlation among the four factors, indicating a possible shared variance in the prediction of overall satisfaction. The regression model was run for years 2017-2021 and was significant in total, so the independent variables as a group reliably predict the dependent variable (Table 7).
Table 7. Multiple linear regression model total significance per year
|
2017 |
2018 |
2019 |
2020 |
2021 |
|
F 58.78** |
78.72** |
57.62** |
55.28** |
61.44** |
|
Note: ** = significant at p < .001, * = significant at p < .05, ns |
= not significant |
The model also explained the variance of the overall satisfaction at a moderate to high degree (Table 8).
Table 8. Multiple linear regression model assumptions per year
2017 2018 2019 2020 2021
Adjusted R2 .467** .510** .445** .445** .506**
Note: ** = significant at p < .001, * = significant at p < .05, ns = not significant
The results for the significance of factors and their strength as predictors per year are summarized in Table 9.
Table 9. Standardised Beta coefficients for predictor variables from 2017 to 2021 for Business and Management subject.
|
2017 |
2018 |
2019 |
2020 |
2021 |
|
|
Q8 The criteria used in marking have been clear in advance |
0,325** |
0,489** |
0,322** |
0,295** |
0,212* |
|
Q9 Marking and assessment has been fair |
0,082ns |
0,102ns |
0,113ns |
0,327** |
0,458** |
|
Q10 Feedback on my work has been timely |
0,375** |
0,227** |
0,189** |
0,29** |
0,191* |
|
Q11 I have received helpful comments on my work |
0,008ns |
-0,015 ns |
0,144ns |
-0,181* |
-0,067 ns |
|
Note: ** = significant at p < .001, * = significant at |
p < .05, ns |
= not significant |
We can identify that the strongest predictor for overall satisfaction for 2017 is Q10 followed by Q8. For 2018 and 2019 Q8 is dominating, while in 2020 Q9 comes first. At 2021 Q9 is the strongest one. The plot below depicts the annual changes (Fig. 1).
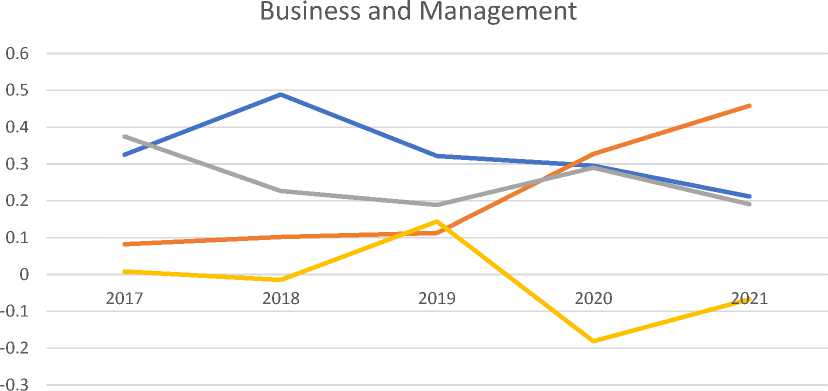
^^^^^^Q8 The criteria used in marking have been clear in advance
Q9 Marking and assessment has been fair
Q10 Feedback on my work has been timely
^^^мQ11 I have received helpful comments on my work
Fig.1. Annual changes in predictors for Business and Management
6. Discussion
Relevant studies, account for all NSS questions as factors and use the sections instead of the individual questions as predictors [28,29]. They find that the ‘Assessment and Feedback’ factor is among the lowest scored predictors for overall satisfaction. Burgess et al. [29] claim also that the weak score of ‘Assessment and Feedback’ factor is more complex to analyse compared to other factors, and any corrective actions by institutes might not necessarily lead to overall satisfaction improvement. However, they acknowledge that universities did a substantial effort for more than a decade to improve the generally weak ‘Assessment and Feedback’, but they challenge its effectiveness as it looks that there is variation among subjects.
This study delves deeper into the specific questions of ‘Assessment and Feedback’, focusing on a specific subject to minimize the complexity according to Burgess et al [29]. Looking at the results (Tables 10, 11, 12, 13, 14), we see that Q8 and Q10 are significant and strong predictors for all five years. While, Q9 and Q11 are not significant for three and four years respectively. This indicates that they cannot be considered as safe predictors, except for years 2020 and 2021, where we see a substantial increase of Q9 in both significance and strength. In terms of strength, we see that Q8 is the strongest predictor for years 2017-2019, while Q9 is the strongest for years 2020 and 2021.
Table 10. Regression of overall student satisfaction (Q27) on assessment and feedback factors (Q8, Q9, Q10, Q11) for 2017
|
Factor |
B (95% CI Upper, Lower) |
SE |
T |
Standardized B |
|
Q8 The criteria used in marking have been clear in advance |
,311 (,189 ,433) |
,062 |
5,019 ** |
,325 |
|
Q9 Marking and assessment has been fair |
,077 (-,050 ,203) |
,064 |
1,188 ns |
,082 |
|
Q10 Feedback on my work has been timely |
,292 (,193 ,391) |
,050 |
5,811 ** |
,375 |
|
Q11 I have received helpful comments on my work |
,007 (-,129 ,142) |
,069 |
,101 ns |
,008 |
|
Note: ** = significant at p < .001, * = significant at p < .05, ns |
= not significant |
Table 11. Regression of overall student satisfaction (Q27) on assessment and feedback factors (Q8, Q9, Q10, Q11) for 2018
|
Factor |
B (95% CI Upper, Lower) |
SE |
T |
Standardized B |
|
Q8 The criteria used in marking have been clear in advance |
,509 (,381 ,638) |
,065 |
7,793 ** |
,489 |
|
Q9 Marking and assessment has been fair |
,105 (-,022 ,231) |
,065 |
1,620 ns |
,102 |
|
Q10 Feedback on my work has been timely |
,196 (,098 ,293) |
,050 |
3,950 ** |
,227 |
|
Q11 I have received helpful comments on my work |
-,014 (-,137 ,108) |
,062 |
-,230 ns |
-,015 |
Note: ** = significant at p < .001, * = significant at p < .05, ns = not significant
Table 12. Regression of overall student satisfaction (Q27) on assessment and feedback factors (Q8, Q9, Q10, Q11) for 2019
|
Factor |
B (95% CI Upper, Lower) |
SE |
t |
Standardized B |
|
Q8 The criteria used in marking have been clear in advance |
,312 (,170 ,455) |
,072 |
4,314 ** |
,322 |
|
Q9 Marking and assessment has been fair |
,103 (-,037 ,243) |
,071 |
1,449 ns |
,113 |
|
Q10 Feedback on my work has been timely |
,159 (,054 ,265) |
,054 |
2,969 ** |
,189 |
|
Q11 I have received helpful comments on my work |
,121 (-,001 ,243) |
,062 |
1,951 ns |
,144 |
|
Note: ** = significant at p < .001, * = significant at p < .05, ns |
= not significant |
Table 13. Regression of overall student satisfaction (Q27) on assessment and feedback factors (Q8, Q9, Q10, Q11) for 2020
|
Factor |
B (95% CI Upper, Lower) |
SE |
t |
Standardized B |
|
Q8 The criteria used in marking have been clear in advance |
,267 (,137 ,398) |
,066 |
4,045 ** |
,295 |
|
Q9 Marking and assessment has been fair |
,293 (,152 ,443) |
,071 |
4,094 ** |
,327 |
|
Q10 Feedback on my work has been timely |
,230 (,124 ,335) |
,054 |
4,291 ** |
,290 |
|
Q11 I have received helpful comments on my work |
-,145 (-,265 -,025) |
,061 |
-2,383 * |
-,181 |
|
Note: ** = significant at p < .001, * = significant at p < .05, ns |
= not significant |
Table 14. Regression of overall student satisfaction (Q27) on assessment and feedback factors (Q8, Q9, Q10, Q11) for 2021
|
Factor |
B (95% CI Upper, Lower) |
SE |
t |
Standardized B |
|
Q8 The criteria used in marking have been clear in advance |
,228 (,051 ,405) |
,090 |
2,542 * |
,212 |
|
Q9 Marking and assessment has been fair |
,486 (,326 ,645) |
,081 |
6,001 ** |
,458 |
|
Q10 Feedback on my work has been timely |
,163 (,037 ,289) |
,064 |
2,556 * |
,191 |
|
Q11 I have received helpful comments on my work |
-,059 (-,227 ,109) |
,085 |
-,688 ns |
-,067 |
Note: ** = significant at p < .001, * = significant at p < .05, ns = not significant
Limitations have to do with the data selection from the NSS datasets, institution weighting, sampling, subject selection, method applied, and thematic analysis is limited and informal nature. We also agree with researchers [20] that additional factors can be also important as predictors of satisfaction but they are not included in the NSS questionnaire. Thematic analysis on the other hand is by nature limited at the specific sample and has to be replicated in a variety of contexts, i.e. modules, years, disciplines, in order to extract information useful for practice.
7. Conclusion and Some Implications for Practice
The study focuses on Business and Management subject from the NSS dataset. Although the analysis was limited, it reflects patterns widely met among diverse business programs. So, our findings can be safely proposed for consideration by Business Schools and their educators.
For 2021 the strongest predictor for overall student course satisfaction was Q9 (marking and assessment has been fair). While Q11 (helpful comments) was not a significant predictor at all. Q8 and Q10 were weak predictors compared to Q9. This suggests a direction for short term effort to maximize student satisfaction by resource utilization in an efficient way.
Suggestion 1: Empowering marking and assessment quality in terms of perceived fairness would lead to greater influence towards student satisfaction and performance.
Clear marking criteria (Q8) and timely feedback (Q10), although important, are relatively weak predictors. It does not mean that they should be overlooked, but less effort can be applied to achieve a high level of satisfaction. Marking rubrics that are known at the beginning of term is a decent way towards clarity and consistent marking. While, a shift towards decoupling feedback from assessment, especially for summative one, would also be in the right direction. There should be also a directive for formative feedback shift earlier enough to support students effectively. Both actions for Q8 and Q10, require less effort compared to Q9, as they can be part of assessment policy.
Suggestion 2: Provision of clear marking criteria and timely feedback are perceived as core elements and should be included in the module design to reduce effort spent.
Q11, on the other hand, although higher scored for 2021 compared to 2017 and relatively at the same level with previous years, is not significant predictor for overall satisfaction, and seems that requires a great level of investment from School in order to develop a culture among educators that will be homogeneous and with a common vision. However, the suggestion would be to invest more on developing marking and assessment fairness in the long term, which again is a matter of educator development effort.
Suggestion 3: Development of a homogeneous culture among educators in the long term for fair marking and inter module feedback.
Findings from the thematic analysis also point more towards the direction of integrated approach and feedback chain, compared to the dimensions of timeliness. It is easier to impose a common approach when it has to do with objective dimensions, such as timeliness and marking rubrics usage, compared to culture shift among educators, which requires academic personnel development.
Concluding, this study sets the grounds for further formal exploration of the fascinating domain of assessment and feedback, reflection on practices by academics and at the same improvement of module delivery styles. Results also point some general aspects, that could be considered at institutional level to increase student overall satisfaction. Feedback chain and assessment for learning are maybe among the two key findings that need to be sought after by institutions and academics. There is enough room for improvement towards a feed forward approach and shift feedback provision from a static templatized form to a more interactive and engaging experience in all Higher Education institutions.
References Assessment and Feedback as Predictors for Student Satisfaction in UK Higher Education
- Bloxham, S. and Boyd, P., “Developing Effective Assessment in Higher Education”. Maidenhead: Open University Press, 2007
- Harlen, W. & James, M., “Assessment and Learning: differences and relationships between formative and summative assessment”, Assessment in Education: Principles, Policy & Practice, 4:3, 365-379, 1997
- Xu, Y., “Examining the effects of digital feedback on student engagement and achievement”. Journal of educational computing research. Vol. 43(3) 275-291, 2010.
- Mandal, N. K., “Importance of student feedback in improving mechanical engineering courses”, International Journal of Mechanical Engineering Education, 47(3), 227–245, 2019
- Hine B., and Northeast, T., “Using feed-forward strategies in higher education”, New Vistas, Volume 2 Issue 1. repository.uwl.ac.uk, 2016
- Higgins, R., Hartley, P. and Skelton, A., “The conscientious consumer: reconsidering the role of assessment feedback in student learning”, Studies in Higher Education 27(1): 53—64, 2002
- Navarro J. A. A., Cantú, R. A., Barón, A., “Internal & external causes determining the academic performance of the university student”, RIDE. Rev. Iberoam. Investig. Desarro. Educ vol.11 no.21 Guadalajara jul./dic. 2020 Epub 09-Mar-2021,
- Murphy, C. and Cornell, J., “Student perceptions of feedback: seeking a coherent flow”, Practitioner Research in Higher Education. Vol 4 (1): page 41-51, 2019
- Perera, J., Lee, N., Win, K., Perera, J. & Wijesuriya, L., “Formative feedback to students: the mismatch between faculty perceptions and student expectations”, Medical Teacher, 30:4, 395-399, 2008
- Austen, L. and Malone, C. “What students’ want in written feedback: praise, clarity and precise individual commentary”, Practitioner Research in Higher Education, 11 (1), 47-58, 2018
- Nicol D.J. and Macfarlane‐Dick, D. “Formative assessment and self‐regulated learning: a model and seven principles of good feedback practice”, Studies in Higher Education, 31:2, 199-218, 2006
- Harrison, C.J., Könings, K.D., Schuwirth, L., Wass V, van der Vleuten C., “Barriers to the uptake and use of feedback in the context of summative assessment”, Adv Health Sci Educ Theory Pract. 2015 Mar;20(1):229-45.
- Díaz-Morales, J.F.; Escribano, C., “Social jetlag, academic achievement and cognitive performance: Understanding gender/sex differences”, Chronobiol. Int. 2015, 32, 822–831.
- Harrison, C.J., Könings, K.D., Schuwirth, L., Wass V, van der Vleuten C., “Barriers to the uptake and use of feedback in the context of summative assessment”, Adv Health Sci Educ Theory Pract. 2015 Mar;20(1):229-45.
- Watson, S., “Closing the Feedback Loop: Ensuring Effective Action from Student Feedback”, Tertiary Education and Management, 9(2), pp. 145–157, 2003
- Williams, J., ‘9 - Action and the feedback cycle’, in Nair, C. S. and Mertova, P. (eds) Student Feedback: The Cornerstone to an Effective Quality Assurance System in Higher Education. Oxford: Chandos Publishing, pp. 143–158, 2011
- Burgess, A., Senior, C., & Moores, E., “A 10-year case study on the changing determinants of university student satisfaction in the UK”, PloS one, 13(2), 2018
- Rodgers T, Freeman R, Williams J, Kane D., “Students and the Governance of Higher Education: A UK perspective”, Tertiary Education and Management. 2011;17(3):247–60, 2011
- Callendar C, Ramsden P, Griggs J., “Review of the National Student Survey: HEFCE”; 2014. http://www.hefce.ac.uk/pubs/rereports/year/2014/nssreview/.
- Richardson JTE, Slater JB, Wilson J., “The National Student Survey: development, findings and implications”, Studies in Higher Education. 2007;32(5):557–80, 2007
- Bennett, R., & Kane, S., “Students’ interpretations of the meanings of questionnaire items in the National Student Survey”, Quality in Higher Education, 20(2), 129–164, 2014
- Dixson, D. D. & Worrell, F. C., “Formative and Summative Assessment in the Classroom”, Theory Into Practice, 55:2. 153-159, 2016
- Black, P. and Wiliam, D., “Inside the black box: Raising standards through classroom assessment”, Phi Delta Kappan, 92(1), 81–90, 2010
- Murphy, C. and Cornell, J., “Student perceptions of feedback: seeking a coherent flow”, Practitioner Research in Higher Education. Vol 4 (1): page 41-51, 2019
- Gilar-Corbi R, Pozo-Rico T, Castejón J-L, Sánchez T, Sandoval-Palis I, Vidal J., “Academic Achievement and Failure in University Studies: Motivational and Emotional Factors”, Sustainability. 2020; 12(23):9798.
- Schneider, M. and Preckel, F., “Variables associated with achievement in higher education: A systematic review of meta-analyses”, Psychol. Bull. 2017, 143, 565–600, 2017
- Blanz, M., “How do study satisfaction and academic performance interrelate? An investigation with students of Social Work programs”, European Journal of Social Work, 17:2, 281-292, 2014
- Bell, A. R. and Brooks, C., “What makes students satisfied? A discussion and analysis of the UK’s national student survey”, Journal of Further and Higher Education, 42(8), 1118-1142, 2018
- Burgess, A., Senior, C., & Moores, E., “A 10-year case study on the changing determinants of university student satisfaction in the UK”, PloS one, 13(2), 2018.
