Аssessment of decorative nano-plaster for fire safety

Author: Mukhamedzhanova O.G., Alferova А.А.
Journal: Nanotechnologies in Construction: A Scientific Internet-Journal @nanobuild-en
Section: The study of the properties of nanomaterials
Article in issue: 3 Vol.17, 2025.
Free access
Introduction. In tests for fire and explosion hazard of materials, various factors influence the desired value and its variation. All these factors affect the correct classification of a material into a fire hazard group, which ultimately determines its potential use. For instance, on escape routes from a building, it is essential to use non-combustible materials (Group NС) for finishes. For example, on escape routes from the building, it is necessary to use non-combustible materials (group NС) for finishing. Therefore, to determine the actual group (class), it is necessary to determine not only the desired value, but also its data spread. Methods and materials. Baumit Nanopore decorative plaster was tested for flammability parameters to classify the material as either flammable or nonflammable. Results. Discussion. Tests of decorative plaster Nanopor “Baumit” showed the following results: loss of mass of the sample is P = 7.0±0.3%; temperature increase in the furnace is 4,6±1,7 ºC; duration of stable flame combustion is 1.0± 0.1 s. In accordance with p. 5.2 of GOST 30244-94 this building material is referred to non-combustible materials, because the values of flammability parameters are within the permissible norm. Loss of mass of decorative plaster samples after fire exposure decreased by only 7%, due to the loss of moisture during heating of plaster samples. And the uncertainty on the mass loss of decorative plaster is about 4%. The temperature increase in the oven during the tests of plaster is about 5 ºC, while the norm is not more than 50 ºC. Relative expanded uncertainty on the temperature rise in the furnace is 36%. Duration of stable flame combustion of plaster is 1 s, while the norm is not more than 10 s. The spread of data on this indicator is 10%. Conclusion. The analysis of the obtained data showed that the expanded uncertainty on flammability parameters ranges from 4 to 40%, which significantly affects the deviation of the measurement result from the true value, as well as the correctness of assigning the group (class) of fire danger to the material.
Flammability of Nanopore decorative plaster, uncertainty in mass loss of the decorative nanoplaster sample, uncertainty in duration of sustained flame burning, uncertainty in Type A, uncertainty in Type B, flammability group
Short address: https://sciup.org/142244829
IDR: 142244829 | DOI: 10.15828/2075-8545-2025-17-3-235-243
Text of the scientific article Аssessment of decorative nano-plaster for fire safety
Original article
Мухамеджанова О.Г., Алферова А.А. Оценка декоративной наноштукатурки на пожароопасность. Нанотехнологии в строительстве. 2025;17(3):235–243. – EDN: YVDALE.
In fire explosion testing, various factors can influence the final measurement and its accuracy. These include: sample characterization and preparation for testing (product variability, geometric size variations, conditioning errors, etc.), equipment preparation for testing (equipment calibration errors), test conditions, and the execution of tests (errors in measuring instruments, test equipment, and testers), among other factors. In addition, in most cases, such measurements are referred to indirect measurements, when the desired value of a quantity is calculated from the functional dependence of several physical quantities, which are obtained directly from measuring instruments. Indirect measurements are less accurate than direct measurements, as each physical quantity will have its own error, which add up and affect the deviation of the measurement result.
All this affects the correctness of assigning the material to a particular group (class) of fire hazard, which ultimately determines its possible use to ensure the safety of people in case of fire. For example, on the evacuation routes from the building it is necessary to use non-com-bustible materials (Group NС) for finishing. Therefore, in order to accurately classify substances and materials by fire-explosion hazard indicators and correctly assign them to any group (class), it is necessary to determine not only the result, but also to calculate the exact indicators. In accordance with RMG 29-2013 the accuracy indicators include the total standard and expanded uncertainty.
Calculation and estimation of measurement uncertainty is carried out by different methods: using in-lab- oratory studies on validation of analysis methodology, least squares method, etc. [1–5]. The method of least squares is used if the measurement result is established by the dependence graph, for example, when determining the toxicity of materials HCL , which is revealed by the dependence of HCL (g/m3) on the lethality of white mice, L (%) [6–20]. 50
The aim of this study was to calculate the uncertainty for indirect measurements under different measurement models as well as direct measurements to classify a building material as combustible/non-combustible.
According to the objective, the following objectives were set:
– to test samples of decorative plaster;
– analyze the obtained measurement models for the flammability of decorative plaster and process the test results with regard to their accuracy and reliability.
MATERIALS AND METHODS
In accordance with GOST 30244-94 Method 1 “Construction materials. Methods of testing for combustibility” (Method I) were tested decorative plaster Nanopor ‘Baumit’ to attribute this material to combustible (G) or non-combustible (NG) building materials. For this purpose, cylindrical samples of the decorative plaster were made from the decorative plaster and subjected to fire exposure on a non-combustibility test rig for building materials. As a result, the following flammability parameters are determined: mass loss for each sample, temperature increase in the furnace, duration of steady flame combustion. According to the results obtained, the decora-
THE STUDY OF THE PROPERTIES OF NANOMATERIALS tive plaster is attributed to the group of combustible or non-combustible. In order to ensure the accuracy and reliability of the definition of this group it is necessary to assess the scatter of values for these parameters.
The results of tests of samples of decorative plaster mixture on combustibility are presented in Table 1.
The model of measurement by mass loss for each sample of decorative plaster is an indirect measurement with nonlinear dependence and measurement error of input quantities, which do not depend on each other. The functional dependence f of the output quantity (mass loss ( Pi )) on the input quantities (sample mass before testing ( m 1 i ), sample mass after testing ( m 2 i ) is determined.
Pi =f(jnu,m2i) =
(mu - т2д
,
mu
where m 1 i – sample mass before testing, g;
m 2 i – sample mass after testing, g;
i – sample number;
Pi – sample mass loss, g.
Estimation of mass loss of decorative plaster samples (%) P = (Σ i n = 1 Pi ) / n = 36/5 = 7%.
The spread of values (measurement uncertainty) for sample mass loss is composed of the standard uncertainty for Type A and Type B. Type A uncertainty is determined on the basis of statistical data and is characterized by the scatter of values of random variables. Type B uncertainty takes into account all non-excluded systematic errors that arise as a result of a given measurement (test).
The standard uncertainty on Type A uA(хi) corresponds to the sample standard deviation of the mean value of all input quantities on the determination of the mass loss of the plaster sample ua(x0 = Sx = ^~^~^ , (1)
where xi – individual measurement result;
X – mean value of the measurement result;
n – number of measurements;
S- – sample standard deviation of the mean value.
The Type A standard uncertainty for the mass of the plaster sample before testing m 1 i , the mass of the sample after testing m 2 i of the plaster was determined using formula 1, calculated in the program ExceL and presented in Table 2 and Table 3.
Type A standard uncertainty for the mass of the decorative plaster samp le before testing ( m 1 i )
u A( m 1) = 2.6 g; m{ = 72.7 g. 1 i
Type A standard uncertainty for the mass of the decorative plaster sample after testing ( m 2 i )
uA ( m 2) = 2.2 g; m = 67.6 g.
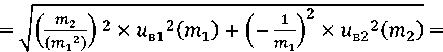
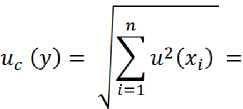
According to the sample mass loss model, which refers to indirect measurements with nonlinear dependence, the total standard uncertainty of uс(у) [5] is determined by the formula
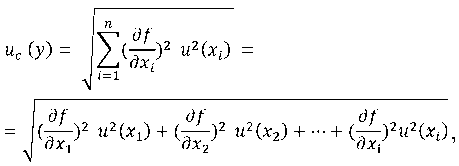
where u ( x 1), u ( x 2), u ( xi ) – the standard uncertainty of the input quantity estimated by Type A or Type B;
∂ f / ∂ xi – partial derivatives of input quantities.
Total Type A standard uncertainty for sample mass loss
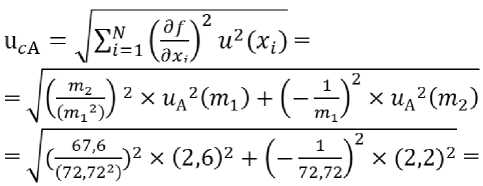
= 0,05 %
Table 1. Test results of Baumit Nanopor decorative plaster samples on combustibility parameters
|
№ of test sample |
Furnace temperature, ºС |
Temperature rise in the furnace T = p.p. T – T p.m. p.k. |
The temperature at the surface of the sample, ºС |
Temperature rise on the surface T = p.o. p.o.m. T p.o.c. |
Temperature at the center of the sample, ºС |
Temperature rise in the center of the sample |
Duration of stable of flame combustion of the sample, s |
Sample mass, g |
Sample mass loss,% |
|||||
|
initial, T p.p. |
maximum, T p.m. |
final, T p.k. |
maximum, T p.o.m. |
final, T p.o.c. |
maximum, T c.m. |
final, T c.k. |
before the test |
after the test |
||||||
|
1 |
750 |
756 |
752 |
4 |
786 |
782 |
4 |
738 |
733 |
5 |
1 |
71.2 |
66.5 |
7 |
|
2 |
751 |
756 |
750 |
6 |
800 |
796 |
4 |
742 |
738 |
4 |
1 |
71.2 |
66.2 |
7 |
|
3 |
750 |
756 |
752 |
4 |
798 |
793 |
5 |
740 |
735 |
5 |
1 |
73.2 |
68.0 |
7 |
|
4 |
744 |
755 |
751 |
4 |
795 |
792 |
3 |
740 |
734 |
6 |
1 |
73.9 |
68.2 |
8 |
|
5 |
750 |
755 |
750 |
5 |
792 |
788 |
4 |
741 |
737 |
4 |
1 |
74.1 |
69.2 |
7 |
|
Arithmetic mean of the results of five tests |
4.6 |
4 |
5 |
1 |
7 |
|||||||||
THE STUDY OF THE PROPERTIES OF NANOMATERIALS
Table 2. Type A uncertainty calculation for the mass of the Nanopore decorative plaster sample before testing
|
No. p/p |
Sample mass before the test, g |
( хi – X ) |
( хi – X )2 |
Type A uncertainty u A( m 1), g |
|
1 |
71.2 |
–1.52 |
2.31 |
|
|
2 |
71.2 |
–1.52 |
2.31 |
|
|
3 |
73.2 |
0.48 |
0.23 |
|
|
4 |
73.9 |
1.18 |
1.39 |
|
|
5 |
74.1 |
1.38 |
1.90 |
|
|
72.70 |
8.15 |
|||
|
Average value |
Sum (∑) |
2.59 |
Table 3. Type A uncertainty calculation for the mass of the Nanopor decorative plaster sample after testing
|
No. p/p |
Sample mass before the test, g |
( хi – X ) |
( хi – X )2 |
Type A uncertainty u A( m 2), g |
|
1 |
66.5 |
–1.12 |
1.254 |
|
|
2 |
66.2 |
–1.42 |
2.016 |
|
|
3 |
68.0 |
0.38 |
0.144 |
|
|
4 |
68.2 |
0.58 |
0.336 |
|
|
5 |
69.2 |
1.58 |
2.496 |
|
|
67.6 |
6.24 |
|||
|
Average value |
Sum (∑) |
2.24 |
The uncertainty of Type B is determined on the basis of non-excluded systematic errors, which are formed as a result of testing, they include, mainly, errors of measuring equipment, which are involved in these measurements. The errors of the measuring equipment, in our case, are subject to the law of uniform distribution, because they are described by a symmetric rectangular distribution in the interval with lower – Θ and the upper limit + Θ.
Standard uncertainty for Type B u B for uniform distribution
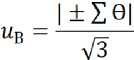
Θ – non-excluded systematic errors of measurement results.
The measuring equipment involved in the measurement of input quantities contribute their error to the final measurement result and its deviation, these errors are superimposed on each other and summarized among themselves.
For each measuring equipment, the non-excluded systematic error is established in absolute form and according to the formula 2 Type B uncertainty is calculated. Type B relative uncertainty is determined ( u B), the relative uncertainty is squared u B2 and summarize u B2 for all measuring equipment.
The Type B standard uncertainty for the mass of the sample before the test is equal to the error of the scales.
Whereas the mass of the sample after the test, was determined for all measuring instruments and test equipment that participated in this measurement and calculated in the program ExceL (Table 4).
Type B standard uncertainty for the mass of the sample before testing т{ = 72.7 g; uB1(m1) = 0.3 g.
Type B standard uncertainty for the mass of the samples after testing тг = 67.6 g; uB2(m2) = 3.3 g.
The total standard uncertainty in Type B mass loss of the sample was calculated according to formula 2, by summing the type B uncertainties of the input quantities
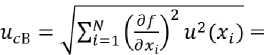
= = 0,15%.
Expanded uncertainty in sample mass loss at confidence level 95%, k = 2 ( U )
THE STUDY OF THE PROPERTIES OF NANOMATERIALS
Table 4. Type B standard uncertainty for the mass of the sample after testing
|
No. p/p |
Name of measuring instruments, deviations |
Measurement error (accuracy class) |
Measuring range |
Measured value |
Absolute error |
u B |
Relative uncertainty u B in shares |
u B 2 |
|
1 |
Laboratory electronic scales Pioneer, modification PА4102С |
Uncertainty: 0.1–0.3 g |
(0.01–120) g |
72 |
0.3 |
0.3 |
0.002 |
0.00001 |
|
2 |
Laboratory electronic scales Pioneer, modification PА4102С |
Uncertainty: 0.1–0.3 g |
(0.01–120) g |
67.62 |
0.3 |
0.2 |
0.003 |
0.00001 |
|
3 |
Deviation from average furnace temperature |
(745–755) ºС |
755 |
2 |
1.2 |
0.002 |
0.00000 |
|
|
4 |
Thermoelectric converters type ТP, modification ТP-0198 XA(K) |
Tolerance class 1; ±0.0075 t |
40 to +850 ºС |
756 |
5.67 |
3.3 |
0.004 |
0.00002 |
|
5 |
Thermoelectric converters type ТP, modification ТP-0198 XA(K) |
Tolerance class 1; ±0.0075 t |
40 to +850 ºС |
800 |
6 |
3.5 |
0.004 |
0.00002 |
|
6 |
Thermoelectric converters type ТP, modification ТP-0198 XA(K) |
Tolerance class 1; ±0.0075 t |
40 to +850 ºС |
742 |
5.565 |
3.2 |
0.004 |
0.00002 |
|
7 |
Eight-channel temperature control device УКТ 38-Щ4, modification УКТ38-Ш4-ТП |
±0.5% |
–50 to +1300 ºС |
756 |
3.78 |
2.2 |
0.003 |
0.00001 |
|
8 |
Eight-channel temperature control device УКТ 38-Щ4, modification УКТ38-Ш4-ТП |
±0.5% |
–50 to +1300 ºС |
742 |
3.71 |
2.1 |
0.003 |
0.00001 |
|
9 |
Eight-channel temperature control device УКТ 38-Щ4, modification УКТ38-Ш4-ТП |
±0.5% |
–50 to +1300 ºС |
800 |
4 |
2.3 |
0.003 |
0.00001 |
|
10 |
Metal measuring ruler trademark “Calibron” |
±0.30 mm |
0–300 mm |
45 |
0.3 |
0.2 |
0.004 |
0.00001 |
|
11 |
Deviation of linear dimensions of samples by sample diameter |
±2 mm |
43–45 mm |
45 |
2 |
1.2 |
0.026 |
0.00066 |
|
12 |
Deviation of linear dimensions of samples by sample height |
±3 mm |
47–53 mm |
50 |
3 |
1.7 |
0.035 |
0.00120 |
|
13 |
Metal measuring ruler trademark “Calibron” |
±0.30 mm |
0–300 mm |
50 |
0.3 |
0.2 |
0.003 |
0.00001 |
|
u B 2 |
0.002 |
|||||||
|
u B |
0.058 |
Thus, the mass loss of the sample is Р = 7.0±0.3% at confidence level Р д = 0.95.
The results show that the mass loss of decorative plaster samples after fire exposure decreased by only 7%, due to moisture loss during heating of plaster samples. And the uncertainty in the mass loss of plaster is about 5%, this scatter of data is mainly due to the error of measuring instruments, calibration of testing equipment, as well as geometric dimensions of samples.
The combustibility parameter by the temperature increase in the furnace is determined by the indirect method with a linear dependence of the result (output) value (Т р.р. )
of the inputs (Т р.m. , Т p.k. ) and the absence of correlation between the measurement errors of the input quantities.
Тp.p. = f(Тp.m.,Тp.k.) = Тp.m.–Тp.k., where Тp.p. – furnace temperature rise, °С
Т p.m. – maximum furnace temperature, °С
Т p.k. – final furnace temperature, °С.
Type A uncertainty calculation for maximum furnace temperature (Т p.m. ) and the final temperature in the furnace (Т p.k. ) is performed according to formula 1 and the results are presented in Tables 5 and 6.
THE STUDY OF THE PROPERTIES OF NANOMATERIALS
Table 5. Type A uncertainty calculation for maximum furnace temperature
|
No. p/p |
Maximum oven temperature, ºС |
( хi – X) |
( хi – X)2 |
Type A uncertainty u A(Т p.m. ), ºС |
|
1 |
756.0 |
0.4 |
0.16 |
|
|
2 |
756.0 |
0.4 |
0.16 |
|
|
3 |
756.0 |
0.4 |
0.16 |
|
|
4 |
755.0 |
–0.6 |
0.36 |
|
|
5 |
755.0 |
–0.6 |
0.36 |
|
|
755.6 |
1.20 |
|||
|
Average value |
Sum (∑) |
0.2 |
Table 6. Type A uncertainty calculation for the final furnace temperature
|
No. p/p |
Final temperature in the furnace, ºС |
( хi –X) |
( хi –X)2 |
Type A uncertainty u A(Т p.k. ), ºС |
|
1 |
752.0 |
1 |
1 |
|
|
2 |
750.0 |
–1 |
1 |
|
|
3 |
752.0 |
1 |
1 |
|
|
4 |
751.0 |
0 |
0 |
|
|
5 |
750.0 |
–1 |
1 |
|
|
751.0 |
4 |
|||
|
Average value |
Sum (∑) |
0.4 |
According to the furnace temperature rise measurement model, which refers to indirect measurements with linear dependence [5] the total standard uncertainty uс ( у ) is determined by summing the uncertainties of the input quantities and is calculated by the formula
7u27xZr+”!^^^ , (4)
where u ( x 1), u ( x 2), u ( xi ) – the standard uncertainty of the input quantity estimated by Type A or Type B.
Total standard uncertainty in Type A for the furnace temperature rise
^cA(Tp.p) I^A(Tp.m) 2 + ^A(Tp.k)2
= = 0,83 °С.
Type B uncertainty is determined on the basis of the results of the error of measuring equipment: thermoelectric converters, temperature control device, equipment calibration.
Type B uncertainty for maximum and final furnace temperature uВ(Тp.m.) = uВ(Тp.k.) = 4.6×0.012 = 0.06 °C.
Total standard uncertainty in Type B for the furnace temperature increment
=
= = 0,009 °С.
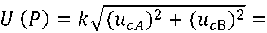
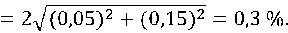
Expanded uncertainty in furnace temperature rise at confidence level 95%, coverage rate k = 2 at Р д = 0.95
U (P) = Py^^^^c^ =
= 2 * TWW+Too^2) = 1,7 °С.
The calculation of the temperature increase in the furnace is 4.6±1.7 °С at confidence level Р д = 0.95. The relative expanded uncertainty on the temperature increase in the furnace is U ( P ) = 36%, the scatter of data is mainly influenced by random error (standard uncertainty in Type A uс А(Т p.p. ) = 0.83 °С), at that systematic errors (standard uncertainty on type B uс B(Т p.p. ) = 0.009 °С) are small and may not be accounted for in these results.
THE STUDY OF THE PROPERTIES OF NANOMATERIALS
The flammability parameter, to which the duration of steady flame combustion refers, is estimated by a direct method, in which the measurement result is established directly from the experimental data, in this case the time of steady flame combustion was determined using a stopwatch.
Average value of the duration of stable flame combustion i =1 s. The standard uncertainty for Type A for the duration of sustained flame combustion of a sample is u = 0.
A( t g)
The Type B uncertainty for the duration of steady flame combustion of a sample is composed of uncertainties associated with non-excluded systematic errors from measuring equipment: stopwatch, thermoelectric transducers, temperature control device, and equipment calibration.
The Type B uncertainty for the duration of steady flame combustion of the sample is u = 1×0.015 = 0.015 s.
В( t g)
Expanded uncertainty for the duration of steady flame combustion of the sample at the confidence level 95%, coverage rate k = 2 at Р д = 0,95
U (P) ~ к ^(u^ft^^^^ —
= 2*7(0^0152)= 0,06 s.
The calculation of the duration of steady flame combustion is as follows 1.0±0.1 s at confidence level Р = д
0.95. The relative expanded uncertainty on the duration of steady flame combustion is 10%, this spread of data is influenced by systematic errors (mainly stopwatch error).
RESULTS AND DISCUSSION
Tests of decorative plaster Nanopor according to GOST 30244-94 with the processing of measurement results for attribution to combustible or non-combustible showed the following results:
– mass loss of the sample is Р = 7.0±0.3%;
– temperature increase in the furnace is 4.6±1.7 °С;
– the duration of steady flame combustion is 1.0 ±0.1 s.
In accordance with paragraph 5.2. of GOST 3024494, this building material is classified as non-combustible materials, because the values of flammability parameters are within the permissible norm. Loss of mass of samples of decorative plaster Nanopor after fire exposure decreased by only 7%, due to loss of moisture during heating of samples of decorative plaster. And the uncertainty of the mass loss of decorative plaster Nanopor is about 4%, this scatter of data is mainly due to the error of the equipment and deviations of geometric parameters of samples (deviations of linear dimensions of samples in height and diameter of the sample).
The temperature rise in the furnace when testing Nanopor decorative plaster is about 5 °С, at the norm not more 50 °С. The relative expanded uncertainty on the temperature increase in the furnace is 36%, this shows that the furnace temperature has a scatter of data over time, which depends on various random factors.
The duration of sustained flame combustion of Nanopor decorative plaster is as follows 1 s, at the norm not more 10 s. The variation of data on this indicator is 10% and arises due to the error of the measuring instrument (stopwatch).
CONCLUSION
Analysis of the obtained data showed that when measuring the fire hazard parameters of building materials it is necessary to calculate the accuracy indicators (measurement uncertainty), which ranges from 4 to 40% and is composed of various random and non-excluded systematic errors. These deviations should be taken into account when assigning a material or substance a certain group (class) of fire danger.
