Assessment of innovation and investment projects of municipality's development in the northern region

Author: Ivanov Valentin Aleksandrovich, Ponomareva Anna Sergeyevna
Journal: Economic and Social Changes: Facts, Trends, Forecast @volnc-esc-en
Section: Agricultural economy
Article in issue: 3 (21) т.5, 2012.
Free access
The article reveals the dependence of the development of rural economy’s basis branch - the agricultural sector - on innovation. It shows the role of cattle breeding in providing the people with low-transportable dairy and meat products, peasant employment and rational use of natural forage grasslands. The authors examine the evaluation technique of innovation and investment project efficiency and reveal the effective implementation of such projects in cattle breeding in the peripheral northern rural region in the case of the Republic of Komi. There is a calculation of commercial efficiency indices of constructing 100 and 200 head dairies with the use of innovative technologies in different variants of state support. The article proves that it is necessary to strengthen the state support to farmers’ income and prolong the terms of concessional lending for the modernization of innovative cattle breeding.
Cattle breeding, innovation, technique of effectiveness, innovation and investment projects, peripheral region, republic of komi
Short address: https://sciup.org/147223351
IDR: 147223351 | UDC: 338.43
Text of the scientific article Assessment of innovation and investment projects of municipality's development in the northern region
The urgency of cattle breeding development on the base of modernization and innovation technology
The urgency and significance of cattle breeding modernization for the Northern Zone based on the use of innovation technology is caused by the need of preserving and developing this important industry. The development of cattle breeding is constrained by the lack of investment and low level of their efficiency.
The research is aimed at assessing economic efficiency of innovation and investment projects in dairy and beef breeding in the Republic of Komi for making management decisions on attracting investment to the industry. Proceeding from the research objectives, the following tasks were solved:
-
1. To assess the recoupment of 100 and 200 head dairies construction in different variants of state support, using the indicators of commercial efficiency of innovative and investment projects.
-
2. To identify the eligibility of current terms of concessional lending and the level of state support for the construction and modernization of livestock houses in the North.
-
3. To develop practice guidelines for applying a differentiated approach to the terms of concessional lending and pricing support for the industry based on the analysis of innovation and investment projects effectiveness.
Cattle breeding is very important for rural areas of the North. It provides the population with low-transportable dairy and meat products, ensures the whole-year employment and allows peasants to use natural grasslands more efficiently. Northern hayfields and pastures are the sources of the cheapest and complete feed. Huge meadow tracts, laying in high-water beds, are especially valuable from the economic point of view. For example, it is possible to gather more than 410 tons of fodder units from the flood meadows of the Northern Dvina, Pechora, Mezen, Pinega, Vychegda and their tributaries [1, p. 73].
The development of cattle breeding is highly dependent on investment growth and transition to innovative technologies. Investments have been substantially reduced over the years of market reforms. Over the period from 1990 to 2010 the investment share in the fixed capital of Komi agriculture declined from 5.7 to 0.8% when the share of agriculture in the gross regional product amounted to 2.6%. The investment decline rate in the agricultural sector was more than four times higher than in the whole republic [2, p. 26]. Naturally, this affected launching of production capacity, primarily for cattle breeding, and ageing of livestock house and equipment. If 2.8 thousand places for cattle were launched in 1990 due to new construction, expansion and renovation, in 2010 only 0.4 thousand places for cattle were built [4, p. 24].
Figure 1. Launching cattle production capacity in the Republic of Komi in 1995 – 2010, thsd. places for cattle
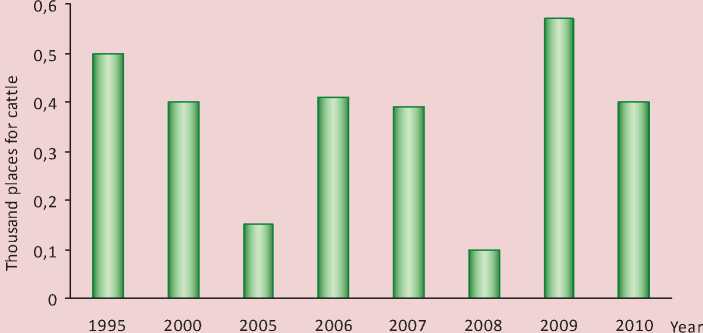
Figure 2. Dynamics of milk production on the farms of all categories in the Republic of Komi in 1990 – 2010, thsd. t
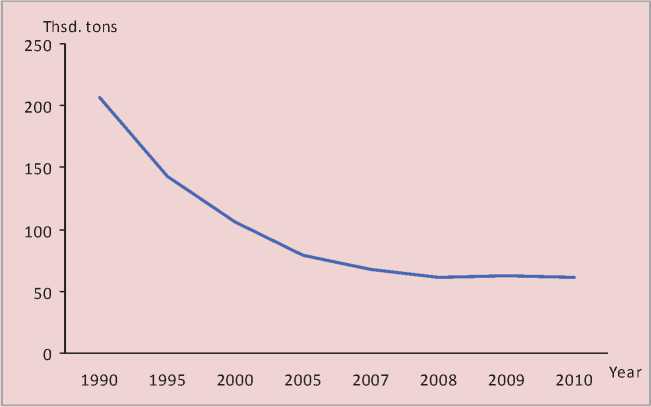
Figure 3. Dynamics of beef and poultry production on the farms of all categories in the Republic of Komi in 1990 – 2010, thsd. t
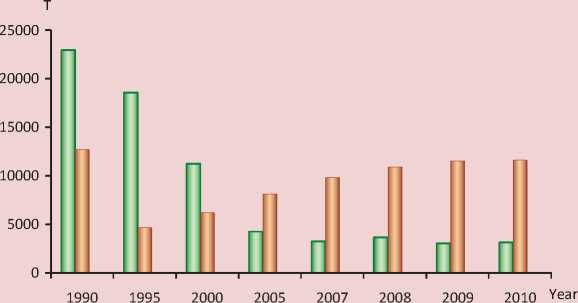
о Beef □ Poultry
The implementation of the State Program for the Development of Agriculture and Markets Regulation of Agricultural Production, Raw Materials and Food for 2008 – 2012 slightly revived the innovation activity in the industry (fig. 1) . Currently, however, investments are attracted by suburban areas. Peripheral agricultural organizations and farm enterprises are in special need of investments. Fixed assets of agricultural cattle-breeding enterprises in the remote areas are worn out by more than 70%.
The negative situation in the industry is characterized by statistical data (fig. 2, fig. 3) . There has been 3.4-fold decrease in milk production and a 5.9-fold decrease in beef production for the period of twenty years [5, p. 45].
Efficiency assessment method for innovation and investment projects
Economic assessment of innovation and investment projects is especially important in connection with the modernization of industry and development of innovation technologies.
The foreign experience in investment calculations, which is based on the analysis of financial flows – dynamics of income and outgoings associated with the project, is significantly interesting. This approach is the basis of the Methodical Recommendations on Assessing Innovation Projects [3].
The Recommendations propose to divide innovation project’s efficiency indices into the following types:
-
• commercial (financial) efficiency indices, taking into account the financial implications of the project for its direct participants;
-
• budget efficiency indices, reflecting the financial implications of the project for the federal, regional and local budgets;
-
• economic efficiency indices, taking into account the costs of project’s implementation, but which go beyond the direct financial interests of innovation project’s participants and allow cost measurement.
The effectiveness of an innovative project is characterized by a system of indices that includes net present value, profitability index, internal rate of return and payback period.
Net present value (NPV) is defined as the sum of present effects, reduced to the initial step, or the difference between discounted profits and costs at a fixed discount rate:
NPV=-1 + P1 + P2 + P3 +... + Pt , (1) (1 + d)2 (1 + d)2 (1 + d)3 (1 + d)t where I – investment costs that are required to implement the project;
-
P – net cash flow at time t;
d – discount rate.
If NPV > 0, return on investment exceeds the minimum discount coefficient. If NPV < 0, project profitability is lower than the minimum coefficient and the project should be rejected.
Profitability index (PI) is the ratio of discounted profit amount to the amount of discounted cost.
The project is considered to be effective if its profitability index is greater than or equal to unity. Profitability index allows us to compare the projects of various scales and choose the most effective project.
P 1 P 2 P 3 P t
+++ ... +
PI — (1 + d) 1 (1 + d) 2 (1 + d) 3 (1 + d) t (2)
I ,
The project is considered to be attractive, if PI > 1; the project should be rejected, if PI < 1.
Internal rate of return (IRR) is a discounted rate that makes the net present value equal to zero. An innovative project is considered to be efficient if its internal rate is greater than or equal to the fixed discount rate, corresponding to opportunity cost of capital.
Internal rate of return (IRR) is calculated as follows:
NPV 1
IRR —d ] +--x (d 2 — d i ),
1 NPV 1 — NPV 2 2 1 (3)
where d 1 – discount rate, corresponding to opportunity cost;
d 2 – discount rate for negative net present value (NPV2);
NPV 1 – net present value for discount rate d 1 .
Payback period on investment defines the time from project’s investment starting till the moment when net project income covers the initial investment. The payback period is determined by discounting. Simple payback period (without discounting) is calculated for approximate calculations. The project is considered to be effective when its payback period is less than the term of project’s implementation.
The effectiveness of innovation and investment projects implementation in cattle breeding in a peripheral region of the Republic of Komi
Using this technique, we’ll calculate economical construction efficiency of livestock buildings for the agricultural organizations that are situated in peripheral Udorsky District in the Republic of Komi – agricultural production cooperative (APC) Collective Farm Chernu- tyevskiy and APC Vashka. Nowadays, APC Collective Farm Chernutyevskiy has 55 cows, and it is going to increase the total number of cattle up to 100 head. In order to fulfill this task, the farm should lease 45 Ayrshire heifers in the period from 2013 to 2015. They will cost 2.48 million rubles. The Ministry of Agriculture and Food of the Republic of Komi will refund their purchase in the amount of 1.44 million rubles. The construction of a cowshed, purchasing equipment and heifers will cost 18.28 million rubles. The Ministry of Agriculture and Food will refund 70% of construction and equipment costs.
The system of cattle housing in new buildings will be stall and pasturable in summer and stall and outdoor in winter. There will be untethered method of cattle housing on the farm. Cattle will be kept on deep litter. Cattle’s food ration will consist of natural forage, mainly of grass from the meadows and pastures. Cattle breeding in these agricultural organizations meets the principals of organic production. It is planned to breed highly productive Ayrshire cows; fat content of their milk is 4.2 – 4.5%. All processes will be mechanized and automated.
In the scope of this project we calculated the current costs based on the following fact. Five people, two of them are milkmaids, will service cows. It is planned to increase average monthly wage up to 30 thousand rubles, which corresponds to the average level of the republic economy. Depreciation cost is calculated taking into account that cowshed will be exploited for 50 years, equipment – for 10 years and lifespan of cows will be 5 years. Depreciation cost will amount to 740 thousand rubles in 2013. It is planned to increase cow productivity up to 5500 kg per year.
It is assumed in the calculation that the current state support from the budget of the Republic of Komi will be saved. The forecast of cash flows of this innovation and investment project to APC Collective Farm Chernutyevs-kiy is based on these conditions (tab. 1) .
The analysis of financial indicators shows that the net profit of project implementation is 16.9 million rubles, and net income (the difference between net profit and the amount of loan repayment) is estimated at 12.3 million rubles.
The simple rate of return on total investment costs (R) is calculated by the following formula:
t
R = NP + P/ x l00 %, (4)
where NP – net profit;
P – interests on loan capital;
I – overall investment costs;
t – investment period.
R = ( 1694 2 + 1 281 )/ 8 x 100 % = 12 . 5 %.
Simple payback period (without discounting) is calculated by the following formula:
I = ^ T = 1 (NP t + D t + P t ), (5)
where T – payback period;
NP t – net income per year t;
D t – depreciation per year t,
P t – interests on loan capital per year t.
Simple payback period will be:
18280 = (425+740+184) 1 + (602+850+177) 2 +
+ (748+960+170) 3 + (885+990+162) 4 + (971+990+156) 5 + (1075+990+150) 6 + + (1173+990+144) 7 + (1368+990+138) 8 + 2252 .
The components of the right-hand side of the equation allow us to determine the payback period that is equal to 8.93 years.
Return on investment (simple rate of return) is equal to 12.5%, and payback period on investment is 8.93 years, so it is longer than project investment period (8 years). Net profit of the project will be gained in more than 14 years.
Table 1. Cash flow forecast for the implementation of innovation and investment project “100 Head Dairy Farm” with the current state support to APC Collective Farm Chernutyevskiy, thsd. rub.
|
1 |
ОО го от см см |
ОО от ОО |
а от а го см |
а а го |
от oo |
О ОО см ОО |
а ОО |
а а го |
го го |
СТ |
см см см го со |
ОО см |
со ОО со |
со |
” ОМ g ' ° |
СМ го |
см го |
о о го |
СМ го ОО |
|
g |
со см |
го СП см |
го го |
ro СП СП го |
го |
ОТ |
ст |
аз |
го от |
го ю ” го |
го |
от |
от го |
||||||
|
CM |
ОТ ГО |
го ОО |
от |
ст |
от го |
g |
g |
со |
го от |
о S 0Q со 1 0О LO ^ |
О |
от от от |
от го |
||||||
|
ОТ CM |
со |
g |
g |
го |
го го |
от |
го СП |
g |
от от |
о S S ^ го го £j ^ |
от от |
го |
со СП со от |
||||||
|
О |
ст |
со |
го |
го го |
от СП го |
от СП ОО |
СТ |
от см |
s§§” ^ 5 ОТ ^— |
от от |
со |
го ОО от |
|||||||
|
g |
го сп го |
ст |
g |
го от го |
го го см |
го СП го |
ст |
го |
ст |
° § 2 =° g Q г^ от |
от от |
от от |
от СП от |
||||||
|
см |
сп го |
го СП го |
го СП СП |
от |
ОО |
го го го |
го СП |
ОО от |
го от см |
о ^2 от ОО от ^г 00 " от от |
от от |
со от |
от от |
см СП см |
|||||
|
СП |
LO |
СО |
от СП |
от |
го |
го го |
g |
g |
О |
оттого от ▻- т— от от |
от от |
от |
от |
Ст |
|||||
|
со |
СМ |
го го го |
го |
от |
от ОО |
го го го |
го |
го |
от от |
ст |
от от ^2 ^ |
Ст |
го |
от от |
Ст |
||||
|
g |
см ОТ ОТ |
от |
ст |
от |
го го |
от |
ст |
со |
от от |
со |
со от LZ СП СП от g о ОТ 7- “ т- |
со |
а> |
g |
О |
||||
|
СО |
СП ГО см |
СП ОО |
го |
го |
го СП |
ОО СП см |
со |
ст |
от см |
g |
с—> ьЕ СМ со СП СО Е2 СО ОТ СО ^ Т— |
от |
го |
го |
го СП |
||||
|
g |
ОТ го |
го го |
g |
го |
го |
го |
го |
со |
от го го |
g |
го |
Го |
СО Ь? ОО -^ ст $ от ° |
от от |
Ст |
со |
ОО от от |
||
|
см |
со |
го СП |
g |
СП |
от |
от |
см СП см |
S |
го |
СТ |
Го |
S Го g ОО ОО g ОО СП |
от |
го |
го |
О |
|||
|
ОТ |
ОТ СП ОО ОО |
го СП го |
g |
ОО го СП |
го |
го |
ст |
g |
оо от |
ст |
ст |
g |
g Го g МО ^ СО °С> |
го |
Го |
со |
го СП |
||
|
g |
от го |
g |
s |
го |
ст |
от го |
g |
1 1 1 1 |
го |
||||||||||
|
5 |
5 |
g 03 g от |
_□) m CM |
co от |
Е |
Е Е I |
Е |
S |
о ОО О О g CD аз ОТ X см |
1 S |
5 |
о от от |
о |
Е Е g от см |
"о | , 2 с О- о Е ^ аз аз о <-> о ,Д> _ о <п о о ^ Е § Е |
X 5 см |
'о о |
Е |
о S от |
In order to assess the economic efficiency of the project it is important to take into account the various values of funds for project’s participants that are gained or spent by them at the different points of time. The flows taking place at different times are compared by discounting, i.e. by the reduction of flows (incomings and outgoings) taking place at different times to a single point of time.
Discount rate in our calculation is estimated at the rate of 8%. Net present value of the project is defined as follows:
The internal rate of return is calculated by the formula 3:
IRR = 8 +
859.8
859.8 - ( - 188.6)
x (12 - 8) = 11.3%.
955 NPV 1 =- 18280 +—9----+
( 1 + 0 . 08 ) 1
( 1 + 0 . 08 ) 2
+------Т+
( 1 + 0 . 08 ) 3
The internal rate of return is higher than the discount rate (8%), this fact indicates the economic attractiveness of the project.
It is necessary to calculate a cumulative cash flow in order to determine the discounted payback period of the project (tab. 2) .
Discounted payback period (DP P ) is calculated by the following formula:
1965 2101 2481
+ + + +
( 1 + 0 . 08 ) 4 ( 1 + 0 . 08 ) 5 ( 1 + 0 . 08 ) 6
------7+ ( 1+0 . 08 ) 7
DPP
= n -
K nt
p(t + 1)
,
+ 2920 ( 1 + 0 . 08 ) 8
+ 3493 + 3815 + 3696 + ( 1 + 0.08 ) 9 ( 1 + 0.08 ) 10 ( 1 + 0.08 ) 11
4053 4573
+-------— +-------—= 859.8 thsd. rub.
( 1 + 0 . 08 ) 12 ( 1 + 0.08 ) 13
A positive value of this indicator proves the economic attractiveness of the project.
Profitability index is calculated as follows:
where n – the number of years when a cumulative cash flow is less than zero;
K nt – the last year when the value of cumulative cash flow is negative;
P (t+1) – the discounted cash flow that follows the last negative cumulative cash flow.
— 853.5
DP„ = 12-- -= 12.49 years,
P 1713.4
(884.3 + 919.4 + 1082.52 + 1471.9 +
+ 1457.0 + 1593.5 + 1575.5 + 1607.0 +
_ + 1780.3 + 1799.5 + 1615.4 + 1640.2 + 1713.4)
PI =------------------------------------------L = 1.04.
Profitability index is greater than unity, so the project is considered to be economically advantageous.
It is necessary to calculate negative net present value (NPV 2 ) to determine the internal rate of return. A discount rate is 12%.
NPV 2 =- 18280 +
( 1 + 0 . 12 ) 1
+------T+T
( 1 + 0 . 12 ) 2 ( 1 + 0 . 12 ) 3
1965 2101 24812650
+++
( 1 + 0 . 12 ) 4 ( 1 + 0 . 12 ) 5 ( 1 + 0 . 12 ) 6 ( 1 + 0 . 12 ) 7
+ 2920 + 3493 + 3815 + 3696 + ( 1 + 0 . 12 ) 8 ( 1 + 0 . 12 ) 9 ( 1 + 0 . 12 ) 10 ( 1 + 0 . 12 ) 11
+ 4053 + 4573 ( 1 + 0.12 ) 12 ( 1 + 0 . 12 ) 13
:-188.6 thsd. rub.
The discounted payback period of the project is equal to 12.49 years; it is longer than the loan taken (8 years). Therefore, this innovation project is considered to be ineffective.
Under the current support the profitability level of agricultural production at APC Collective Farm Chernutyevskiy will amount from 8.6% in 2013 to 18.4% in 2025; these figures are below the optimal rate of return (40 – 50%). In this situation this agriculture organization can start building a farm, if the period of long-term loan will be at least 13 years.
The efficiency of the innovation and investment project for APC Collective Farm Chernu-tyevskiy is defined in achieving the optimal level of livestock production profitability. It is planned to increase a profitability level from 7.2% in 2013 up to 38.5% in 2015 and up to 48% in 2020. This task will require a significant rise in the guaranteed prices for dairy products and beef.
Table 2. The calculation of a cumulative cash flow of the innovation and investment project for APC Collective Farm Chernutyevskiy in 2012 – 2025, thsd. rub.
|
Indicator |
Cash outflow in 2012 |
2013 |
2014 |
2015 |
2016 |
2017 |
2018 |
2019 |
|
Cash flow |
-15800 |
955 |
1072 |
1338 |
1965 |
2101 |
2481 |
2650 |
|
Discounted cash flow |
-15800 |
884.3 |
919.4 |
1082.5 |
1471.9 |
1457.0 |
1593.5 |
1575.5 |
|
Cumulative cash flow |
-15800 |
§ co + LO + CO |
OO co Ю CD CD + |
oo CD OO CD LO CO + CD 1 OO co |
oo c\i CD OO CD + oq oo CD oo LO |
CD co LO + CD c\i CD OO |
LO OO CD LO + CD |
CD LO CD CM CD LO LO + |
|
Indicator |
Cash outflow in 2012 |
2020 |
2021 |
2022 |
2023 |
2024 |
2025 |
|
Cash flow |
-15800 |
2920 |
3493 |
3815 |
3696 |
4053 |
4573 |
|
Discounted cash flow |
-15800 |
1607.0 |
1780.3 |
1799.5 |
1615.4 |
1640.2 |
1713.4 |
|
Cumulative cash flow |
-15800 |
CD OO S + CD LO CD LO CD |
OO CD LO oq + CD OO |
CD LO CD CD + CO oo CD LO |
OO CD C\J CO + |
LO OO го + oo CD OJ |
oq CD LO oo oo + LO oo |
The calculation shows that the return on investment (simple rate of return) is equal to 22.4% and payback period is 4.52 years, which is less than the investment period of this project. The discounted payback period (7.1 years) is less than the period of project’s implementation. Therefore, this investment and innovation project will be effective while maintaining the existing state support and ensuring the optimal level of livestock production profitability.
The economic evaluation of building 200 head dairy farm for APC Vashka was carried out similarly. The investment costs of building a cowshed, purchasing equipment and Ayrshire heifers will amount to 30 million rubles.
It is planned to have cattle housing conditions, production rates of cows and the form of state support that are similar to the Project for APC Collective Farm Chernutyevskiy.
With the current state support the net profit of project implementation is 28.8 million rubles and net income (the difference between net profit and the amount of loan repayment) is estimated at 19.8 million rubles.
The simple rate of return on total investment costs:
r = (28778 + 2510)78 xWo% = .
Calculations show that the simple payback period for this project will be 9.16 years.
Payback period on investment (without discounting) is longer than the investment period of this project. Net profit of the project will be gained in more than 15 years.
Profitability index:
1949.1 + 2354.2 + 2540.5 + 2985.1 +
+ 3034.7 + 3355.8 + 3290.7 + 3243.8 +
+ 3732.9 + 3706.1 + 3701.5 + 3719.6 + 3856.1
. .
Discounted payback period is 11.25 years; it is longer than the implementation period of this project. Therefore, this innovation project is considered to be ineffective.
The calculation of investment and innovation project efficiency indicators for APC Vashka at the optimal level of livestock produce profitability shows that the net profit of project implementation is equal to 48.7 million rubles and net income (the difference between net profit and the amount of loan repayment) is estimated at 39.7 million rubles (tab. 3).
Simple rate of return on total investment costs will amount to:
r = (48721 ± 2510)/8 xW0 % = 184%.
Simple payback period (without discounting) is calculated as follows:
34810 = (2009+1950+360) +
+ (2780+2170+346) + (3607+2320+332) +
+ (4995+2320+319) + (6100+2320+306) +
+ (7417+2320+294) + 2576 = 5.26 years.
Return on investment (simple rate of return) is equal to18.4%, and payback period on investment is 5.26 years, and so it is less than project investment period.
Table 3. Cash flow forecast for the implementation of innovation and investment project “200 Head Dairy Farm” at the optimal level of produce profitability to APC Vashka, thsd. rub.
|
Indicator |
2012 |
2013 |
2014 |
2015 |
2016 |
2017 |
2018 |
2019 |
2020 |
Total |
|
1. Cash inflow - total |
30000 |
21621 |
24399 |
26942 |
28536 |
31761 |
35188 |
40432 |
46307 |
285186 |
|
Including: 1.1. Sales revenues |
- |
20321 |
22949 |
25372 |
28536 |
31761 |
35188 |
40432 |
46307 |
250866 |
|
1.2. Budgetary funds |
21000 |
1300 |
1430 |
1570 |
- |
- |
- |
- |
- |
25300 |
|
1.3. Bank loans |
9000 |
- |
- |
- |
- |
- |
- |
- |
- |
9000 |
|
2. Cash payment, total |
31500 |
18667 |
20404 |
21960 |
22526 |
24646 |
26276 |
29364 |
32572 |
227915 |
|
Including 2.1. Investment cost |
31500 |
1000 |
1100 |
1210 |
- |
- |
- |
- |
- |
34810 |
|
2.1.1. Investment in fixed assets |
30000 |
1000 |
1100 |
1210 |
- |
- |
- |
- |
- |
33310 |
|
2.1.2. Working capital financing |
1500 |
- |
- |
- |
- |
- |
- |
- |
- |
1500 |
|
2.2. Current costs (except for depreciation) |
- |
15640 |
17161 |
18496 |
20118 |
22086 |
24036 |
26873 |
29790 |
174200 |
|
2.2.1. Wages with taxes |
- |
5850 |
6435 |
6950 |
7576 |
8334 |
9085 |
10175 |
11294 |
65699 |
|
2.2.2. Material cost |
- |
8680 |
9550 |
10314 |
11242 |
12366 |
13480 |
15098 |
16760 |
97490 |
|
2.2.3. Interest for loans |
- |
360 |
346 |
332 |
319 |
306 |
294 |
282 |
271 |
2510 |
|
2.2.4. Other costs |
- |
750 |
830 |
900 |
981 |
1080 |
1177 |
1318 |
1465 |
8501 |
|
2.3. Commercial expenses |
- |
220 |
250 |
275 |
300 |
362 |
406 |
455 |
500 |
2768 |
|
For reference only: Capital depreciation |
- |
1950 |
2170 |
2320 |
2320 |
2320 |
2320 |
2320 |
2320 |
18040 |
|
Product cost |
- |
17810 |
19581 |
21091 |
22738 |
24736 |
26718 |
29599 |
32565 |
194838 |
|
Taxable profit |
- |
2511 |
3368 |
4281 |
5798 |
7025 |
8470 |
10833 |
13742 |
56028 |
|
Production profitability, % |
- |
14.1 |
17.2 |
20.3 |
25.5 |
28.4 |
31.7 |
36.6 |
42.2 |
- |
|
2.4. Unified agricultural tax |
- |
502 |
588 |
674 |
803 |
925 |
1053 |
1260 |
1502 |
7307 |
|
For reference only: Net profit |
- |
2009 |
2780 |
3607 |
4995 |
6100 |
7417 |
9573 |
12240 |
48721 |
|
2.5. Loan repayment |
- |
1305 |
1305 |
1305 |
1305 |
1305 |
825 |
825 |
825 |
9000 |
|
3. Net cash flow (NCF) |
-1500 |
2954 |
3995 |
4982 |
6010 |
7115 |
8912 |
11068 |
13735 |
57271 |
Net present value of the project is defined as follows:
The internal rate of return is calculated by the formula 3:
NPV 1 =- 34810 +
2954 3995
(1 + 0.08)+ (1 + 0.08) 2
+-------7
(1 + 0.08) 3
IRR = 8 +
4688.5
4688.5 - ( - 111664.9)
x (20 - 8) = 11.4%.
6010 7115 891211068
--1---++
(1 + 0.08) 4 (1 + 0.08) 5 (1 + 0.08) 6 (1 + 0.08) 7
13735 . ..
+----'----=- 34810 + 39498.5 = 4688.5 thsd. rub.
(1 + 0.08) 8
A positive value of this indicator proves the economic attractiveness of the project.
Profitability index is calculated as follows:
2735.2 + 34269.3 + 4030.7 + 4508.9 + + 4934 + 5723.8 + 6580.3 + 7559.2
Profitability index is greater than unity, so the project is considered to be economically advantageous.
It is necessary to calculate negative net present value (NPV 2 ) to determine the internal rate of return. A discount rate is 20%.
+--T+
( 1 + 0 .2) 3
NPV 2 =- 34810 +
( 1 + 0.2) + ( 1 + 0 .2) 2
6010 7115 8912 1106813735
+--г+--г+--7+--7"+г
( 1 + 0 .2) 4 ( 1 + 0 .2) 5 ( 1 + 0 .2) 6 ( 1 + 0 .2) 7 ( 1 + 0.2) 8
=- 34810 + 23145 . 1 =- 11664 . 9
The internal rate of return is higher than the discount rate (8%), this fact indicates the economic attractiveness of the project.
Cumulative cash flow, determining the discounted payback period of the project, is presented in table 4 .
Discounted payback period will be:
- 2873.7
DP = 8-- —= 7 + 0.38 = 7.38 years.
P 7559.2
The discounted payback period of the project is less than its implementation period. Therefore, this innovation project is considered to be effective.
Table 5 presents the performance of projects’ efficiency with the different variants of state support.
In summary, we have drawn the following conclusions:
-
1. The sustainable development of cattle breeding in the peripheral regions requires a considerable increase in investing construction, reconstruction and launching innovation technologies. Therefore, economic assessment
Table 4. The calculation of a cumulative cash flow of the project for APC Vashka in 2012 – 2020, thsd. rub.
2. With the support to revenue, ensuring the optimum level of profitability.
-
2. Calculating the economic efficiency of 100 and 200 head dairies with the use of high technologies and highly productive animals shows that having the current state support to innovation and investment activity and farmers’ incomes, the expenses on these projects will be covered in 12.49 and 11.25 years if the length of credit is 8 years. The payback period of these projects will be lower than the term of credit when agricultural organizations
-
3. It is necessary to significantly increase the guaranteed price for milk and beef and strengthen the role of long-term credit in order to enhance innovation in the dairy industry. Soft loan for the construction and modernization of livestock houses in the North should be provided for 20 – 25 years, and the length of loans for purchasing machinery and equipment should be six or eight years.
|
Indicator |
Cash inflow in 2012 |
22013 |
22014 |
22015 |
22016 |
22017 |
22018 |
22019 |
22020 |
|
Cash flow |
-31500 |
2954 |
3995 |
4982 |
6010 |
7115 |
8912 |
11068 |
13735 |
|
Discounted cash flow |
-31500 |
2735.2 |
3426.,3 |
4030.7 |
4508.9 |
4934.1 |
5723.8 |
6580.3 |
7559.2 |
|
Cumulative cash flow |
-31500 |
CD CXI LO CO Cd + 1 LO co |
od co Cd II co co cd CO + 1 CD cd |
II co + Cd 1 od co Cd |
CD Cd CD od LO + oq |
ID co CD + CD |
LO CD II OD cd Cd ID + CO |
cd oo cd co oo co + CD |
cd CD Ю LO + + cd co |
Table 5. Assessment of innovation and investment projects’ efficiency
|
Project |
Net present value (NPV), thsd. rub. |
Simple rate of return (R),% |
Simple payback period, years |
Profitability index (PI) |
Internal rate of return (IRR), % |
Discounted payback period (DP p ), years |
|
|
Constructing 100 head dairy in APC Collective Farm Chernutyevskiy |
1 |
859.8 |
12.5 |
8.93 |
1.04 |
11.3 |
12.49 |
|
2 |
6642.2 |
22.4 |
4.52 |
1.36 |
16.3 |
7.1 |
|
|
Constructing 200 head dairy in APC Vashka |
1 |
6660.1 |
11.2 |
9.16 |
1.19 |
11.6 |
11.25 |
|
2 |
4688.5 |
18.4 |
5.26 |
1.13 |
11.4 |
7.38 |
|
1. With the current state support.
of innovation and investment projects is especially important.
reach the optimal level of profitability and the current state support to innovation projects is saved.
References Assessment of innovation and investment projects of municipality's development in the northern region
- Ivanov V.А. Intensification of agricultural production: the problems of development and efficiency problems. Moscow: Nauka, 1990.
- Ivanov V.A., Terentyev V.V. Status and prospects of the agricultural sector in the Republic of Komi. Syktyvkar, 2010.
- Kosov V.V., Livshits V.N., Shakhnazarov A.G. Methodological recommendations for assessing the efficiency of investment projects. Moscow: Economics, 2000.
- Agriculture in the Republic of Komi. 2011: Stat. Sat. Komistat. Syktyvkar, 2011.
- Factors and conditions for the sustainable development of agricultural and food sector and rural areas of the North. Syktyvkar: Komi Science Centre, 2011.
