Assessment of Knowledge and Utilization of Computers Among Healthcare Workers in Benue South, Nigeria

Author: Temidayo Oluwatosin Omotehinwa, Augustine Ovie Edegbene, Oga Ode
Journal: International Journal of Information Technology and Computer Science @ijitcs
Article in issue: 1 Vol. 17, 2025.
Free access
Literature confirms that the low success rate of eHealth systems is closely linked to inadequate computer knowledge. Therefore, this study aimed to assess knowledge and utilization of computers among healthcare workers in Benue South. An institution-based quantitative cross-sectional study design was conducted in 120 health facilities, including primary healthcare centres, and private clinics. This study involved 430 healthcare workers. Using Python programming, descriptive and multivariable logistic regression analyses were conducted to assess the level of computer knowledge and utilization among participants, as well as to identify factors influencing their computer knowledge and utilization. Of the 430 participants, 233 (54.19%) of healthcare workers passed the computer knowledge test, 216 (50.23%) of health workers have access to computers, and 221 (51.40%) of them had undergone formal computer training. The findings revealed that 263 (61.16%) of healthcare workers exhibit good computer utilization, while 167 (38.84%) demonstrated poor utilization. Access to a computer (adjusted odds ratio [AOR]=2.83, 95% CI 0.48-1.60), and prior computer training (AOR=3.34, 95% CI 0.65-1.76) were found to be significantly associated with computer knowledge, while Access to a computer (AOR=2.98, 95% CI 0.48-1.70), Sex (AOR=2.23, 95% CI 0.28-1.32), Department (AOR=1.06, 95% CI 0.00-0.11), and prior computer training (AOR=5.53, 95% CI 1.10-2.32) were found to be significantly associated with computer utilization. These findings imply that improved access to computers and comprehensive computer training for healthcare professionals is vital for improved service delivery.
Benue South, Computer Literacy, eHealth Success, Logistic Regression, Healthcare Professionals, Nigeria
Short address: https://sciup.org/15019668
IDR: 15019668 | DOI: 10.5815/ijitcs.2025.01.03
Text of the scientific article Assessment of Knowledge and Utilization of Computers Among Healthcare Workers in Benue South, Nigeria
The computer is an integral part of Information and Communication Technology (ICT). The application of ICT in healthcare service delivery is evident in the adoption of various eHealth, mHealth (mobile health), and health information management systems being deployed in various healthcare facilities across the country [1-3]. These studies [4-8] have established that the quality of healthcare service delivery can be enhanced through the use of ICT. ICT in health also guarantees the integrity and security of health records, ensures efficient storage and retrieval of health records, and facilitates secure ubiquitous access to patients’ health records [9, 10]. There will not be much difference in healthcare service delivery in rural and urban areas where ICT is fully deployed for patient-centric care.
eHealth (electronic Health) literacy is the ability of healthcare professionals to acquire, understand, and use health information using electronic devices (e.g., computers) to store and source health-related information as well as address health-related problems [11]. The eHealth literacy encompasses several basic health skills including; health literacy, information literacy, and computer literacy [12, 13]. Computer literacy is the ability of an individual to use the computer effectively to achieve certain tasks such as surfing the internet and inputting basic data into the computer among others [14].
Although, paper-based health records management is used in most health facilities in Nigeria [15-17]. There are eHealth initiatives that are already deployed and in use in some healthcare facilities in Nigeria. Examples of such eHealth initiatives are the District Health Information System (DHIS), All Purpose Medical Information System (APMIS), VSee telemedicine kit, Clinical Patient Administrative Kit (CLINIPAK), and Video Training Application (VTR) [18]. CLINPAK and VTR were deployed in 126 primary healthcare centres across Ondo, Kano, and Abuja in 2017 [19]. DHIS is a federal government initiative that is deployed in major health facilities in the country. For mobile health, mHealth Rapid SMS action powered by UNICEF has since been deployed for tracking the spread of malaria. Recently in May 2023, the federal government of Nigeria launched a telehealth service platform called NigComHealth [20, 21]. NigComHealth is an application borne out of the partnership between the Nigerian Communications Satellite and Ethnomet [20]. With the increasing wave of AI in health as exemplified in many recent studies such as [22-24], these technologies will continue to redefine the healthcare landscape. Therefore, the frontline personnel in the health sector are expected to possess the requisite computer knowledge and skills to effectively navigate and utilize the eHealth tools and resources.
It has been established in the literature [25-28] that the low success rate of eHealth systems is strongly associated with poor knowledge of computers. Ado, Apa, Agatu, Obi, Ogbadibo, Ohimini, Oju, Okpokwu, and Otukpo are the nine local governments in Benue South. Their diversity provides a unique framework for analyzing the dynamics of computer knowledge and utilization among healthcare workers in a primarily urban and semi-urban setting. There is a lack of clear literature regarding the computer competency of healthcare workers in Benue South. Of the large number of both public and private healthcare facilities scattered across Benue South, it is worrisome that there is no operational eHealth system anywhere in this region; this casts a serious dent in the advancement of medical science, treatment therapies, and medical record-keeping. Sufficient computer knowledge and its utilization among the healthcare workers in Benue South is essential for any meaningful progress to be achieved in eHealth establishment, which would engender enhanced healthcare service delivery. Thus, it became a matter of critical necessity to embark on this research study to obtain firsthand information on the extent of computer knowledge and utilization among healthcare workers (based on a randomly-collected sample of professionals) across the nine Local Government Areas (LGAs) of Benue South. Insights from this assessment will lead to more informed conclusions and recommendations on appropriate steps to be taken by health workers and healthcare service providers to boost ICT knowledge and skills among their workforce, and thus lead to the implementation of eHealth systems, and improved quality of health services in the study area. Therefore, this study aimed to assess computer knowledge and determine the factors that are associated with computer knowledge in Benue South. The specific objectives of this study were to: (1) assess the computer knowledge of healthcare workers in Benue South; (2) identify the factors associated with computer knowledge among healthcare workers in Benue South; (3) assess the computer utilization level of the healthcare workers in Benue South; (4) identify the factors associated with computer utilization among healthcare workers in Benue South.
2. Literature Review
Assessment of computer knowledge and utilization is a very important activity for proper planning and efficient and effective healthcare service delivery. This has been carried out at different times in some health facilities in Nigeria and across the globe. However, the assessment of knowledge and utilization of computers and determination of factors associated with the utilization in Benue South is not well established in the literature.
Ref. [28], conducted a study on the perception of health workers on the integration of Electronic Health Records (EHR) in ten Primary Health Centres (PHCs). The findings revealed that the health workers do not want EHR implemented. Poor knowledge of computers and lack of training on the use of EMR are some of the challenges identified to mitigate the integration of EMR in the PHC. The knowledge and utilization of information technology were examined among nurses and midwives in a secondary health center in Kaduna [29]. Of the 399 nurses and midwives that participated 70.6% demonstrated good knowledge of computer. However, the average utilization score of the respondents was 53.6%. The factors affecting the sustainable adoption of eHealth in Nigeria were identified in the study by [30]. The findings revealed low literacy and experience in using computerized clinical applications. A similar study examined the knowledge and use of mHealth applications among doctors and nurses in a healthcare facility in Lagos. The findings revealed that 84.6% of the doctors and 91.1% of the nurses had not heard of the term ‘mHealth’. Doctors' willingness to use Electronic Medical Records at the Lagos University Teaching Hospital was analyzed [31]. The study reported that IT skill is a significant factor in determining the willingness to use EHR.
The level of knowledge of computers, ICT, EMR, and their utilization has also been assessed in other countries. The utilization of Electronic Health-Information Resource (EHIR) in a specialized teaching hospital in Amhara, Ethiopia was assessed by [32]. The study found that computer literacy and eHealth literacy are significant factors determining the utilization of the EHIR. [33] conducted an assessment of the ICT literacy, knowledge, and readiness to use EMR among health workers in a tertiary hospital in Nay Pyi Taw, Myanmar. The study reported a 20.3% prevalence of ICT literacy and 24.6% knowledge of EMRs among health workers. The study submitted that ICT training is important to improve ICT literacy. The study by [34], conducted an assessment of the computer knowledge of healthcare workers in Malawi before taking two groups of participants through a traditional and blended learning course on ICT and eHealth. The findings show that there was a significant improvement in ICT knowledge after the training.
Ref. [35] explored the knowledge and utilization of computers among health workers in selected healthcare facilities in Ethiopia using a cross-sectional approach. Of the 270 healthcare workers who partook in the survey, only 38 (14.1%) knew and could adequately utilize the computer. They found out that the knowledge and utilization of computers of healthcare workers was very low, and they recommended that increased accessibility and proper training of the healthcare workers will increase their knowledge and utilization of the computers.
Despite the immense benefits that computer knowledge and utilization offer, certain factors have been identified in previous studies to have constituted significant drawbacks to the extent to which healthcare professionals know and use computers. In their study result, [36] stated that the following variables had a great impact on how much health professionals incorporate computer knowledge and utilization skills into the services they render: age, field of study, level of education, and previous computer training, and concluded their study by disclosing that primary health centers especially had performed more poorly in computer knowledge and utilization practices among health professionals than other tiers of healthcare. In their study also, [37] listed Profession, ownership of a laptop computer, age, and sex as factors that positively influence the knowledge and utilization of ICTs among health workers. [38] did not however agree that sex, as stated by [37], had any significant impact on computer literacy as they believe that age and years of work experience of health professionals constitute the major encumbrances. In their study, significant predictor variables identified by [35] as setbacks to knowledge of ICTs and their utilization were average monthly income, job satisfaction index, and own computer possession. Similarly, [39] found out that health workers were confounded by abject ICT knowledge and skills, deplorable internet network and power supply for effective communication, and poor motivation for health workers to acquire the necessary technical knowhow to be able to know and operate ICT services, inadequate funding of ICTs at health centers, inadequate computer devices and non-availability of internet modems.
The utilization of digital technology among health science students at Mettu University, aiming to identify factors associated with its use in a setting with limited resources was investigated in [40]. Using a cross-sectional study design, data were collected through a pretested self-administered questionnaire. Forward stepwise logistic regression analysis was employed to explore the relationship between independent variables and digital technology utilization. The results indicated that 68% of students demonstrated proficient use of digital technology. The major factors influencing utilization included solid knowledge of digital technology, positive attitudes toward digital technology, and previous computer experience. The study concluded that while students generally exhibited strong digital technology utilization, efforts to foster positive attitudes towards digital technology and enhance students' digital competencies are essential for promoting greater adoption and utilization in similar educational settings.
This study [41] carried out a comprehensive overview of the factors influencing the adoption of digital health tools for medication appropriateness among healthcare professionals. It synthesizes findings from a systematic review of articles, highlighting barriers and facilitators categorized into technical, organizational, economical, user-related, and patient-related components. One of the key barriers identified in the study is the need for additional training. The study emphasized the importance of training for developers aiming to design effective digital health tools, particularly in enhancing medication appropriateness.
Ref. [42] investigated the digital competencies of nursing students using a discipline-specific self-assessment survey tool, focusing on dimensions such as ICT proficiency, information literacy, digital creation, research, and so on. A crosssectional empirical study was conducted, and quantitative data were collected via a questionnaire from nursing students in late 2021 and analyzed using descriptive statistics and non-parametric tests to discern age and course-related differences. Findings reveal deficiencies in critical areas like information literacy, digital research, and innovation, exacerbated by varied competency levels across demographic subgroups. Qualitative insights underscore challenges in skill development, primarily through informal learning methods. The study concludes by advocating for tailored digital skills training within nursing curricula to better prepare future practitioners for evolving digital healthcare demands, thereby emphasizing the integration of digital literacy into nursing education for improved patient care and professional readiness.
In this study [43], how healthcare professionals in Ondo State specialist hospitals, in Nigeria, utilize Information Communication Technology (ICT) and its impact on their performance outcomes was investigated. It aimed to evaluate the potential of ICT to enhance the quality of interactions between health workers and patients. The research utilized a survey design and both descriptive and inferential statistical methods. Participants included a diverse group of healthcare workers, such as doctors, nurses/midwives, community health extension workers, health information managers, medical laboratory professionals, and pharmacy professionals. The findings revealed that ICT usage was high among these professionals, and regression analysis confirmed a significant positive effect of ICT on their performance. The study suggests implementing regular training sessions with detailed competency roadmaps to further develop ICT skills among hospital staff.
Ref. [44], examined the perceptions of healthcare professionals regarding health information applications and the factors influencing these perceptions in the Cape Coast Metropolis of Ghana. In July 2022, data were gathered from 632 healthcare professionals at three purposefully selected health facilities using a descriptive cross-sectional study design.
The normality of dependent variables was checked with the Shapiro-Wilk test, and both descriptive statistics and bivariate regression analysis were employed to identify factors impacting the benefits, barriers, and motivations for IT use in healthcare delivery. Findings revealed that healthcare professionals perceived moderate benefits from IT, but encountered barriers such as insufficient computers, frequent system downtime, low system performance, and inadequate training. Motivations for IT use included training, technical support, and changes in work procedures. Key factors such as education, work experience, profession, and IT training significantly influenced attitudes towards IT adoption. The study concluded that while healthcare professionals acknowledge the benefits of IT, addressing barriers related to resources and training through targeted interventions and policies is crucial for improving IT utilization in the Cape Coast Metropolis.
A systematic review to examine educational interventions designed to enhance the digital competencies of healthcare professionals, important for delivering high-quality healthcare was conducted in [45]. The review included 20 studies that implemented various educational interventions, primarily targeting nurses across different healthcare settings. Techniques such as lectures, slide presentations, group work, case studies, discussions, and practical exercises or simulations were employed to boost digital competencies. The interventions led to significant improvements in participants' knowledge, skills, attitudes, perception of resources, self-efficacy, and output quality. The review suggested that a multi-method approach, integrating knowledge acquisition and practical training with robust organizational support and individualized guidance, is most effective in enhancing the digital competencies of healthcare professionals.
This study [46], investigated the use of Information and Communication Technology (ICT) by educators in higher education, particularly within health professions, examining usage patterns and factors driving active technology implementation. A cross-sectional survey of 202 educators from six Moroccan institutions revealed that educators had high confidence in their Technological Pedagogical Content Knowledge (TPACK), especially in the Pedagogical and Content domains. Findings showed a greater prevalence of passive digital learning activities compared to active ones. However, educators who actively used technology demonstrated significantly higher TPACK levels. Notably, 102 out of 119 educators with high active technology use had high TPACK, while 54 out of 83 educators with low technology use had low TPACK. These results highlighted the critical role of TPACK development for effective technology integration in teaching. The study provided valuable theoretical and practical insights, emphasizing the need to align technology use with effective instructional practices in health professions education.
This study [47], examined the digital literacy levels and awareness among health-based science students at Acibadem University, to improve their access to reliable information, enhance communication and collaboration, navigate ethical considerations, and effectively use digital tools in healthcare management. The research involved 476 undergraduate students from diverse departments. A questionnaire assessed digital literacy across seven domains. Findings revealed gender disparities in computer proficiency, with females exhibiting lower skills and less exposure to coding education. The study recommended integrating digital literacy courses into the curriculum, addressing gender gaps, and offering elective courses across disciplines to enhance students' digital competencies relevant to modern healthcare environments.
Ref. [48], assessed the digital health competence among 817 healthcare professionals from nine organizations using electronic questionnaires administered between March 1st and July 31st, 2022. Employing K-means clustering, researchers identified three distinct digital health competence profiles: high competence, intermediate competence, and low competence, demonstrating significant variations among these groups. Factors contributing to higher digital health competence included recent graduation, roles in outpatient care, and leadership or specialist positions. The study highlighted organizational practices and peer influence as critical in enhancing skills related to digital solutions integration and human-centered remote counselling. Recommendations emphasize tailored digital health education initiatives tailored to the specific needs of nursing and allied health professionals in non-outpatient settings, alongside enhanced managerial support across diverse digital health competency domains. These findings are pivotal for shaping future strategies in digital health education within healthcare environments.
The impact of increased adoption of eHealth and information systems on healthcare professionals' roles, examining broader implications for healthcare work, including cultural and social dimensions was investigated in [49]. Utilizing a qualitative descriptive approach, the study used an inductive approach to content analysis and semi-structured thematic interviews to gather data. The findings underscored that healthcare professionals perceived significant, albeit often subconscious, changes in their roles attributed to eHealth and information systems. They underscored the critical role of digital competence within their professional communities, highlighting how advanced digital skills have redefined and expanded their job responsibilities. The study emphasized the influence of individual work environments and access to information systems on these role transformations. While eHealth was noted for enhancing inter-professional collaboration, it also presented challenges such as disparities in workload distribution, skills deficiencies, and increased task complexities. The study recommended organizational initiatives to promote equitable opportunities for enhancing digital competency, ensuring fair distribution of workloads among professionals, and providing universal access to eHealth technologies and information systems.
The studies highlighted the widespread ICT use among healthcare professionals, the digital literacy level, and the vital role of digital skills in improving the effectiveness of healthcare professionals. Assessing computer knowledge and usage among healthcare workers in regions like Benue South, Nigeria, could reveal current digital literacy levels and barriers to ICT use. This assessment would guide targeted interventions to boost digital skills, integrate ICT more effectively into healthcare, and shape local policies and education initiatives. Ultimately, these efforts aim to enhance healthcare outcomes by improving digital readiness and efficiency in Benue South.
3. Methodology 3.1. Study Area
Benue State is one of the 36 states of Nigeria, located in the North Central geopolitical region of Nigeria. Its geographic coordinates are longitude 7° 47' and 10° 0' East. Latitude 6° 25' and 8° 8' North. Benue South is one of the senatorial districts of Benue State and comprises nine Local Government Areas (LGAs) including Ado, Agatu, Apa, Obi, Ogbadibo, Okpokwu, Ohimini, Oju, and Otukpo [50]. This study was carried out in the nine local government areas of Benue South (See Fig. 1). The population of the Benue South senatorial zone is estimated to be about 5,741,815 in 2016 based on the projection from the 2006 National Census conducted by the National Population Commission [51].
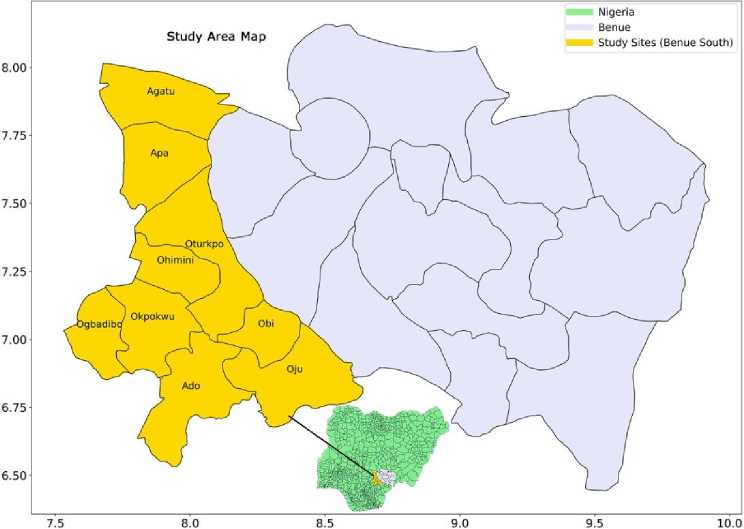
Fig.1. Map of benue state with the nine local governments in benue south shaded in yellow. Inset: Map of nigeria showing benue state and the study area
According to a report on coded health facilities in Benue State, [52], there are a total of 1,206 health facilities scattered across 23 LGAs in Benue State. Of this number, 401 are distributed across the nine LGAs in Benue South. For a representative result, 30% of the total number of health facilities in each local government were visited. Therefore, for Ado, Apa, Agatu, Obi, Ogbadibo, Ohimini, Oju, Okpokwu, and Otukpo the number of health facilities visited were 10, 8, 15, 12, 17, 8, 14, 16, and 20 respectively. The numbers were rounded to the nearest whole number. A total of 120 healthcare centres were covered across the nine local governments. Stratified random sampling was used in selecting the healthcare facilities visited.
-
3.2. Study Design
An institution-based quantitative cross-sectional study design was conducted in healthcare facilities: general hospitals, primary healthcare centres, and private clinics. This study was conducted between March and August 2023.
-
3.3. Study Population and Sample Size
-
3.4. Sample Size
In this study, a healthcare worker is defined as an individual who has been trained in the medical field and possesses a minimum qualification of a Senior Secondary School Certificate. The study population is made up of all healthcare workers in Benue South. However, the researchers do not have the records of the total healthcare workers in Benue South. Hence, the sample size was determined based on the technique proposed in [53].
The sample size was determined using (1) as proposed in [53], which is a standard approach for calculating sample sizes in health research.
n =
z 2 P (1 - P )
£ 2
Where:
-
n = sample size for infinite population
Z = Z-score corresponding to 95% confidence level p = estimated proportion based on assumptions £ = error margin
For this study:
-
• The Z-score corresponding to a 95% confidence level is 1.96. This value is chosen because a 95% confidence level will ensure a high degree of confidence in the results.
-
• The error margin (e) is set at 5% (0.05). This margin of error is typically used to balance precision and feasibility in sample size determination.
-
• The estimated proportion (p) is assumed to be 50% (0.5). This conservative estimate is chosen to ensure that the sample size is robust, as it maximizes the required sample size and thus provides a safe upper bound for the number of participants needed.
0.9604
0.0025
By plugging these values into the formula, the required sample size is calculated as follows:
n =
(1.96) 2 .(0.5)(1-0.5) _ 3.8416-0.25
(0.05) 2 0.0025
384.16
Rounding up to the nearest whole number, the required sample size is 385 participants.
-
3.5. Non-response and Attrition Rate
In any study involving human participants, it is important to account for potential dropouts or non-response, which can affect the validity of the study results. To ensure that the final sample size is sufficient despite these challenges, an adjustment for attrition rate is necessary.
The attrition rate for this study is estimated to be 13% (0.13) based on contextual factors such as workload and schedules. Healthcare workers often have busy and unpredictable schedules, which could be a significant factor in participant dropout. An attrition rate of 13% is also considered to be fair [54]. The adjusted sample size is therefore calculated as in (2).
n adjusted
n
1 - attrition rate
Original sample size: n = 385
Attrition rate: 13% (0.13)
Therefore, to account for a 13% attrition rate, the adjusted sample size is:
nadjusted = T-nr 442.53
Rounding up to the nearest whole number, the adjusted sample size is 443 participants. This sample size as determined is appropriate and sufficient for the study objectives.
-
3.6. Data Collection
-
3.7. Data Analysis
A semi-structured, and pre-tested questionnaire developed for this study [36] was adapted and administered to the healthcare workers to collect data on sociodemographic characteristics, computer knowledge, and utilization. The sociodemographic variables are described in detail in Table 1. A cross-sectional study was carried out, and respondents were determined by the method of simple random sampling across the health facilities in the study area.
Logistic regression is used to model the probability of a binary outcome based on one or more predictor variables. In the case of knowledge, the outcome is the variable Remark, which indicates whether a healthcare worker passes or fails the computer knowledge assessment (1 for pass, 0 for fail) while in the case of utilization, the outcome is the computer utilization rate (1 for Good, 0 for Poor). Logistic regression is an appropriate analytic tool since both computer knowledge and utilization were categorized into two groups (pass/fail, good/poor). The adjusted odds ratios (AORs) derived from logistic regression provide a measure of the strength and direction of the association between the explanatory variables and the outcome (knowledge and utilization rate).
The probability of the binary outcome can be modeled using the logistic function as shown in (3).
P (Y = 1) =
1 + e-(e 0 + вX 1 + e 2 X 2 +••• + + e kXk )
Where:
P(Y = 1) is the probability that the outcome is 1.
P0 is the intercept.
P(Y = 1) is the probability that the outcome is 1.
Р 1 ,Р2, — >P k are the coefficient of predictor variables X 1 ,X2, ...,Xk .
The log-odds (logit) of the outcome is a linear combination of the predictor variables, as depicted in (4).
The logistic regression model was applied to determine which factors (predictor variables) are associated with the knowledge of computers among healthcare workers. The binary outcome Remark (pass/fail) is modeled using the predictor variables in Table 1.
Each coefficient pt represents the change in the log-odds of passing the computer knowledge assessment for a one-unit increase in the corresponding predictor variable, holding all other variables constant.
For binary predictor variables like Sex and Train, the coefficient indicates the difference in the log-odds of passing between the two categories.
Table 1. Description of explanatory variables
|
Variable name |
Description |
|
WLGA |
Workplace Local Government Area. |
|
Pri_Gov |
The type of health facility: Government or private health facility. |
|
Age_Range |
This represents different age groups. |
|
Age |
The age of the participants. |
|
Sex |
The gender of the participants: Male = 1, Female = 0 |
|
Marital_status |
This takes the marital status of the participants. For example, Married, Single, Widowed, Divorced, and so on. |
|
Qualification |
The academic qualification of the participants. |
|
Profession |
This variable takes the specialty of the participants (health workers). For example, Medical Doctor, Nurse, Pharmacist, Laboratory Technologist, and so on. |
|
Department |
This refers to the department in which the participant works. |
|
Position |
This variable takes the position of the participants. For example, Head of Institution, Head of Department, and so on. |
|
Monthly_income |
This represents the salary range of the participants. |
|
Train |
This takes input relating to whether the health worker (participant) had had computer training. |
|
Access |
Whether the participant has consistent access to a computer system. |
The steps followed for logistic regression analysis include:
• The logistic regression models were specified with computer knowledge and utilization as the dependent variables, and the explanatory variables in Table 1 as independent variables.
• The parameters of the logistic regression models were estimated using the maximum likelihood estimation (MLE) method, which finds the values of the coefficients that maximize the likelihood of observing the given sample data.
• The goodness-of-fit of the models was assessed using the Likelihood Ratio Test (LLR p-value) and Akaike Information Criterion (AIC). These metrics helped determine how well the models explained the variability in the dependent variables.
• The results of the logistic regression analyses were presented in terms of adjusted odds ratios (AORs) with 95% confidence intervals (CIs). The AORs indicate the likelihood of exhibiting good computer knowledge or utilization relative to the reference category for each independent variable, adjusting for other variables in the model.
3.8. Informed Consent and Data Confidentiality
3.9. Ethics Statement
The Health Research Ethics Committee (HREC) of the Federal University of Health Sciences, Otukpo, Benue State, Nigeria approved this study. Data was collected after obtaining the ethical clearance and written consent was obtained from each respondent. The approval number is FUHSO-HREC/02/05/2023-28/13/2023.
4. Results and Discussion
4.1. Sociodemographic Characteristics
Descriptive statistics were used to summarize the basic features of the data collected from the healthcare workers. Measures such as frequencies, percentages, and means were calculated to provide an overview of the demographic characteristics of the participants, as well as their levels of computer knowledge and utilization.
The study ensured informed consent and participant confidentiality by providing detailed information about the study's purpose, voluntary nature, and the use of collected data solely for research purposes. Participants were assured that their responses would remain anonymous, with data stored securely and reported in aggregate form to prevent individual identification. The informed consent process included clear explanations of participants' rights to withdraw at any time without consequences and the measures taken to protect their confidentiality. Also, the contact information for the principal investigator was provided for any questions or concerns, further reinforcing the ethical handling of participant information. The participants were given a copy of the signed informed consent.
Out of the total of 430 respondents, 272 (63.26%) were female and 158 (36.74%) were male. The average age of the respondents was 31.14 years, with the majority (36.98%) falling within the 18–25 age bracket. The violin plot in Fig. 2 illustrates the age distribution across different workplace LGAs. The figure reveals that in most LGAs, the majority of health workers are below 35 years of age. However, in Ogbadigbo LGA, the widest section of the Kernel Density Estimation is above 40 years, indicating a higher concentration of older health workers. Notably, the age distribution across all WLGA is not significantly skewed, as indicated by the median age marker falling within the interquartile range marked by a thick black line. However, outliers are present across all local government areas, albeit less pronounced in Ohimini LGA. This suggests that while age distribution is generally balanced, certain areas exhibit more variability in respondent ages.
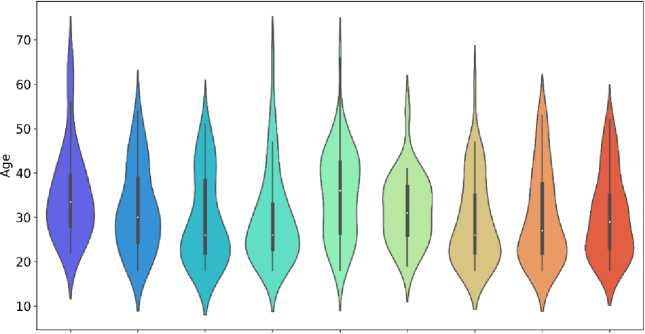

Fig.2. The violin plot of the distribution of respondents' ages across different Work place LGA (WLGA) categories. Each violin represents a WLGA and displays the following features: the white dot indicates the median age, while the thick black line spans the interquartile range (IQR) from the 25th to the 75th percentile of ages within each WLGA in Benue South. The width of the violin corresponds to the density of age values, with broader sections indicating higher density. Whiskers extending from the violin show the full range of ages, excluding outliers. This visualization enables a comparison of age distributions and variability across the WLGA in Benue South
The majority of participants, 228 (53.02%) (Table 2.), held an Ordinary National Diploma (OND)/Diploma, as illustrated by the tallest bar in Fig. 3. Two hundred and three participants (203) work in government-owned health facilities, while 227 (52.79%) work in private health facilities, as depicted in Fig. 4.
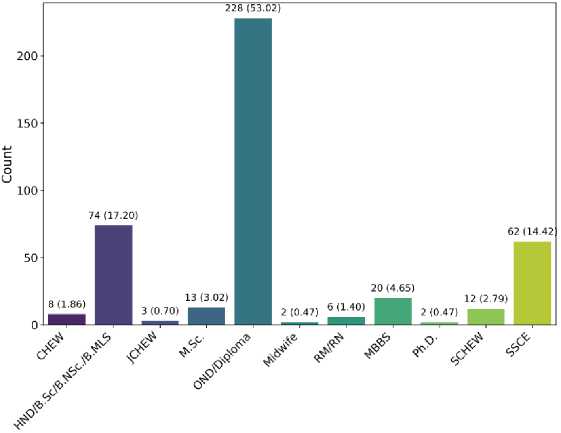
Fig.3. The violin plot of the distribution of respondents' ages across different Work place LGA (WLGA) categories. Each violin represents a WLGA and displays the following features
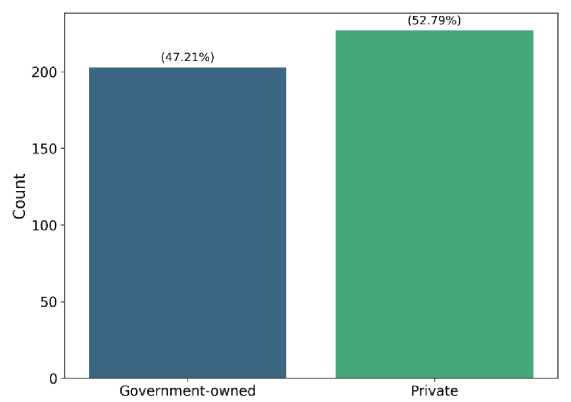
Fig.4. Distribution of participants by workplace: Government-owned vs. Private health facilities
-
4.2. Level of Computer Knowledge
-
4.3. Multicollinearity Analysis
-
4.4. Factors Associated with Knowledge of Computer
The computer knowledge test was graded over 100% and the score was classified into pass or fail. Those who scored >50% were classified as pass otherwise, fail. Of the 430 health workers that took the computer knowledge test 233 (54.19%) passed the test, whereas 197 (45.81%) failed. Only 216 (50.23%) of the respondents have access or opportunity to use the computer system and only 221 (51.40%) have had computer training (see Table 2.).
To establish the distinct contribution of each of the predictors (independent variables) a multicollinearity analysis was carried out. Multicollinearity exists when two or more independent variables in a multiple regression are highly correlated making it difficult to distinctively establish their relationship with the response variable, in this case, the remarks (pass or fail) [55]. Multicollinearity creates instability within the model as the confidence is wider and the coefficients of the logistic regression become difficult to interpret [56]. It can be observed in Fig. 5 that the Age and Age_Range predictors are strongly correlated with a correlation coefficient of 0.96. Hence, the Age_Range was excluded while fitting the model.
Table 2. Respondent’s sociodemographic characteristics
|
Explanatory variables of respondents |
n (%) |
|
WLGA |
|
|
Ado |
34 (7.91) |
|
Agatu |
40 (9.30) |
|
Apa |
32 (7.44) |
|
Obi |
52 (12.09) |
|
Ogbadigbo |
55 (12.79) |
|
Ohimini |
27 (6.28) |
|
Oju |
55 (12.79) |
|
Okpokwu |
58 (13.49) |
|
Otukpo |
77 (17.91) |
|
Pri_Gov |
|
|
Government |
203 (47.21) |
|
Private |
227 (52.79) |
|
Age_Range |
|
|
18-25 |
159 (36.98) |
|
26-35 |
142 (33.02) |
|
36-45 |
92 (21.40) |
|
46-55 |
31 (7.20) |
|
56-70 |
6 (1.40) |
|
Sex |
|
|
Female |
272 (63.26) |
|
Male |
158 (36.74) |
|
Marital_status |
|
|
Divorced |
3 (0.70) |
|
Married |
191 (44.42) |
|
Single |
226 (52.56) |
|
Widowed |
10 (2.32) |
|
Qualification |
|
|
CHEW |
8 (1.86) |
|
HND/B.Sc/B.NSc./B.MLS |
74 (17.20) |
|
JCHEW |
3 (0.70) |
|
M.Sc. |
13 (3.02) |
|
OND/Diploma |
228 (53.02) |
|
Midwife |
2 (0.47) |
|
RM/RN |
6 (1.40) |
|
MBBS |
20 (4.65) |
|
Ph.D. |
2 (0.47) |
|
SCHEW |
12 (2.79) |
|
SSCE |
62 (14.42) |
|
Monthly_income |
|
|
< N20,000 |
178 (41.39) |
|
N20,000 - N50,000 |
132 (30.70) |
|
N60,000 - N100,000 |
101 (23.49) |
|
> N100,000 |
19 (4.42) |
|
Train |
|
|
No |
209 (48.60) |
|
Yes |
221 (51.40) |
|
Access |
|
|
No |
214 (49.77) |
|
Yes |
216 (50.23) |
|
Remark |
|
|
Fail |
197 (45.81) |
|
Pass |
233 (54.19) |
To identify the factors associated with knowledge of computer, we measure the relationship between the response variable remark (pass or fail) and the explanatory variables (WLGA, Pri_Gov, Age, Sex, Marital_status, Qualification, Profession, Department, Position, Monthly_income, Train, Access), using logistic regression. Observing P>|z| or p-values in Table 3, the independent variables WLGA, Pri_Gov, Age, Sex, Marital_status, Qualification, Profession, Department, and Position do not have a significant relationship to the response variable remark as their p-values are greater than 0.05. Therefore, a second model is fitted with the significant variables such as Monthly_income, Train, and Access. The degree of freedom for residuals for Model 1 is 417.0, the Akaike Information Criterion (AIC) which measures how well a model fits is 500.18. Lower AIC suggests a better fit.
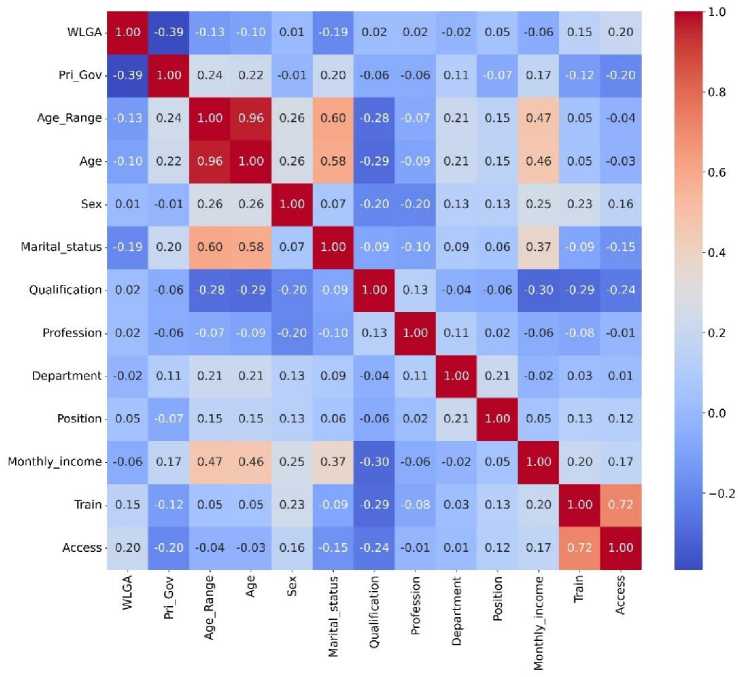
Fig.5. Heatmap visualization of the correlation coefficients of the independent variables
Table 3. Model 1: Logistic regression results showing coefficients, standard errors, z-values, p-values, confidence intervals, and adjusted odds ratios (aor) for predictors of computer knowledge
|
coef |
std err |
z |
P>|z| |
[0.025 |
0.975] |
AOR |
|
|
const |
-1.0680 |
0.784 |
-1.362 |
0.173 |
-2.605 |
0.469 |
0.3437 |
|
WLGA |
0.0178 |
0.048 |
0.372 |
0.710 |
-0.076 |
0.112 |
1.0180 |
|
Age |
-0.0151 |
0.016 |
-0.944 |
0.345 |
-0.046 |
0.016 |
0.9851 |
|
Pri_Gov |
-0.1717 |
0.258 |
-0.667 |
0.505 |
-0.677 |
0.333 |
0.8422 |
|
Access |
0.9692 |
0.302 |
3.213 |
0.001 |
0.378 |
1.560 |
2.6358 |
|
Sex |
0.3861 |
0.256 |
1.509 |
0.131 |
-0.115 |
0.887 |
1.4712 |
|
Marital_status |
-0.3193 |
0.236 |
-1.354 |
0.176 |
-0.782 |
0.143 |
0.7266 |
|
Qualification |
0.0448 |
0.027 |
1.645 |
0.100 |
-0.009 |
0.098 |
1.0459 |
|
Profession |
-0.0514 |
0.032 |
-1.622 |
0.105 |
-0.114 |
0.011 |
0.9499 |
|
Department |
0.0432 |
0.026 |
1.685 |
0.092 |
-0.007 |
0.094 |
1.0442 |
|
Position |
-0.0065 |
0.059 |
-0.110 |
0.913 |
-0.122 |
0.109 |
0.9935 |
|
Monthly_income |
0.4575 |
0.158 |
2.896 |
0.004 |
0.148 |
0.767 |
1.5802 |
|
Train |
1.1428 |
0.301 |
3.802 |
0.000 |
0.554 |
1.732 |
3.1355 |
The coefficient (coef) represents the Conditional odds ratio (COR). The log-odds of 1.1428 for the Train predictor which represents whether a health worker had gone through computer training means that there is a 1.1428 increase in the log-odds of passing the computer knowledge test if a health worker undertakes computer training. In other words, based on the Adjusted Odd Ratio (AOR) the log odds of passing the computer knowledge test increased 3.14 times when a health worker has had computer training compared to a health worker who has not and the result is statistically significant. The AOR (Adjusted Odd Ratio) which is the exponentiated coefficient provides a more precise estimation of the relationship between the predictors and the response variable.
►■ Calibration Curve (Model 1) Perfectly Calibrated
г
0.0 0.2 0.4 0.6 0.8
Mean Predicted Probability
Fig.6. Calibration curve of Model 1 showing the actual instances of positive outcomes vs mean predicted probabilities of positive outcomes generated by Model 1. The closer the plot of the mean predicted probabilities to the actual the more reliable the estimation of the predictors in predicting computer knowledge
The calibration curve in Fig. 6 reveals the degree of confidence of the model. It can be observed that the curve largely aligns with the diagonal which implies a good calibration.
Table 4. Model 2: Logistic regression results showing coefficients, standard errors, Z-values, p-values, confidence intervals, and adjusted odds ratios (AOR) for predictors of computer knowledge
|
coef |
std err |
z |
P>|z| |
[0.025 |
0.975] |
AOR |
|
|
const |
-1.3382 |
0.274 |
-4.875 |
0.000 |
-1.876 |
-0.800 |
0.2623 |
|
Access |
1.0296 |
0.286 |
3.594 |
0.000 |
0.468 |
1.591 |
2.7998 |
|
Monthly_income |
0.2347 |
0.126 |
1.858 |
0.063 |
-0.013 |
0.482 |
1.2645 |
|
Train |
1.1471 |
0.287 |
3.996 |
0.000 |
0.584 |
1.710 |
3.1490 |
In Table 4, the logit regression results for the second model (Model 2) are presented and its calibration curve is depicted in Fig. 7. It can be observed in this model that Monthly_income does not have a significant relationship with the response variable remark. It is important to note that in Model 1 this predictor had a significant relationship with the response variable with a p-value of 0.004. The AIC of this model is lower (498.05) when compared to the AIC of Model 1 (500.18) which suggests that Model 2 is better. However, a likelihood ratio test was conducted to determine whether the model with more predictors (Model 1) explains the response variable better than the model with fewer predictors (Model 2).
—•-- Calibration Curve (Model 2) ---- Perfectly Calibrated

0.0 0.2 0.4 0.6 0.8
Mean Predicted Probability
Fig.7. Calibration curve of Model 2 showing the actual instances of positive outcomes vs mean predicted probabilities of positive outcomes generated by Model 2. The blue line is not closely aligned with the grey line this indicates that Model 2 is not the best fit for the data
The calibration curve of Model 2 revealed a good calibration with most of the predictions near the diagonal.
-
4.5. Model 1 VS Model 2 Likelihood-Ratio Test (LRT) Statistic
To access the goodness-of-fit of Models 1 and 2, the models were fitted independently and the LRT also known as the G statistics [57] of both models was computed. The G statistics are computed as defined in (5) [58].
G = - 2 x ( Log - likelihood of Model 2 - Log - likelihood of Model 1) (5)
The associated p-value of G is calculated based on the degree of freedom obtained by subtracting the number of predictors in Model 2 from Model 1.
The LRT Statistic (G) obtained for Models 1 and 2 is 15.87 with 9.0 degrees of freedom and a p-value of 0.07. A p-value greater than 0.05 suggests that the additional predictors in Model 1 did not explain the response variable better than in Model 2. In other words, Model 2 significantly improves model fit better than Model 1.
It can be observed in Model 2 that Monthly_income does not have a significant relationship with the response variable. Therefore, a third model was fitted with only the significant predictors; Access and Train.
Table 5. Model 3: Logistic regression results showing coefficients, standard errors, Z-values, p-values, confidence intervals, and adjusted odds ratios (AOR) for predictors of computer knowledge
|
coef |
std err |
z |
P>|z| |
[0.025 |
0.975] |
AOR |
|
|
const |
-0.9294 |
0.158 |
-5.884 |
0.000 |
-1.239 |
-0.620 |
0.3948 |
|
Access |
1.0391 |
0.285 |
3.644 |
0.000 |
0.480 |
1.598 |
2.8268 |
|
Train |
1.2060 |
0.285 |
4.237 |
0.000 |
0.648 |
1.764 |
3.3400 |
Table 5 revealed that the predictors, Access and Train have a significant relationship with the response variable remark. An AOR of 2.83 suggests that a health worker who has frequent access to a computer system has 2.83 times higher odds of passing the computer knowledge test compared to one who does not.
-♦- Calibration Curve ---- Perfectly Calibrated

0.0 0.2 0.4 0.6 0.8 1.0
Mean Predicted Probability
Fig.8. Calibration curve of Model 3 showing the actual instances of positive outcomes vs mean predicted probabilities of positive outcomes generated by Model 3. The predicted probabilities (blue line) showed very close alignment with the actual proportions of positive outcomes observed (grey line). This indicates a better fit and reliable estimate of the predictor’s relationship with computer knowledge
The calibration curve for Model 3 presented in Fig. 8 revealed a curve that is almost absolutely aligned with the diagonal which is an almost perfect calibration. In comparison with the calibration curve for Models 1 and 2, Model 3 fits better. However, the AIC (499.55) of this model is slightly higher than the AIC for model 2 (498.05).
-
4.6. Model 2 VS Model 3 Likelihood-ratio Test (LRT) Statistic
Considering that Model 3 has a higher AIC, it is important to determine which of the two models significantly improves model fit. The LRT statistics for Models 2 and 3 were computed based on (5). The LRT Statistic (G) obtained was 3.49386863136624 with 1.0 degree of freedom equals 1.0, and an associated p-value was calculated to be 0.06. This p-value being higher than 0.05 suggests that Model 3 is a better fit for the data and the additional predictor in Model 2 is not statistically significant in explaining the response variable.
-
4.7. Utilization of Computers
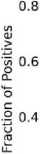
The respondents’ responses to the questions on utilization were graded and scores below 50% are rated as poor utilization otherwise, good utilization. A total of 263 respondents, accounting for 61.16%, demonstrated good utilization of computers, while 167 respondents, representing 38.84%, exhibited a poor utilization rate. Among the 272 female health workers surveyed, 52.01% (142) displayed good computer utilization, while 47.99% (131) had a poor utilization rate. Male respondents, on the other hand, showed a higher good utilization rate at 77.07% (121), with 22.93% (36) demonstrating poor utilization this is illustrated in Fig. 9.
Fig.9. Computer utilization rate based on sex
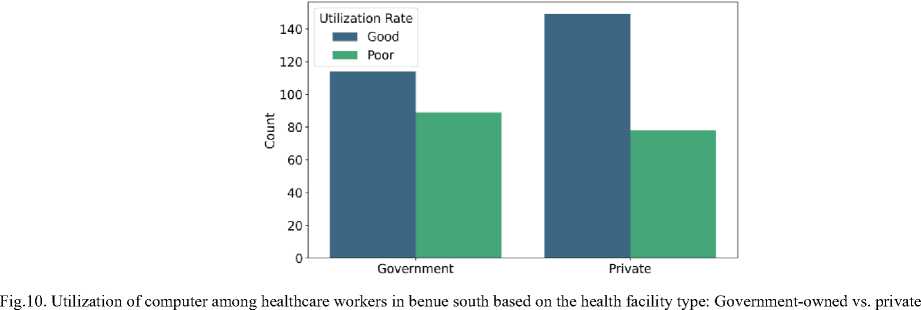
In terms of workplace type, respondents from government-owned health facilities reported a good utilization rate of 56.16% (114) and a poor utilization rate of 43.84% (89). Conversely, those from privately owned health facilities had a higher good utilization rate of 65.64% (149) and a lower poor utilization rate of 34.36% (78) as depicted in Fig. 10.
The pie chart in Fig. 11 illustrates the computer utilization rate of healthcare workers in Benue South with access to a computer vs. those without access to a computer. Among the 216 respondents with computer access, a significant majority demonstrated good utilization at 84.26% (182), while 15.74% (34) exhibited poor utilization. In contrast, among those without computer access, only 37.85% (81) showed good utilization, while 62.15% (133) displayed poor utilization.
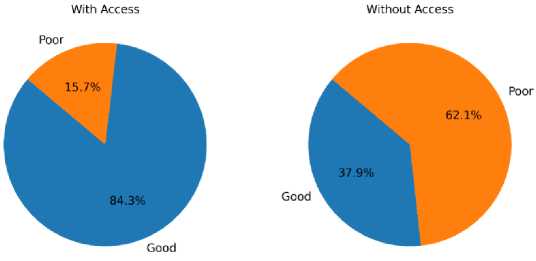
Fig.11. Pie chart visualization of the computer utilization rate of healthcare workers with access to a computer vs. those without access to a computer
Regarding prior computer training, 86.43% (191) of respondents with training showed good utilization, while 13.57% (30) demonstrated poor utilization. Conversely, respondents without prior computer training had a substantially lower good utilization rate of 34.45% (72) and a higher poor utilization rate of 65.55% (137) as depicted in Fig. 12.
With regards to the department where the respondents worked in the health facilities, 79.73% (59) of respondents working in the Laboratory showed a good computer utilization rate while 20.27% (15) demonstrated a poor utilization rate. It is important to also note that the Laboratory has the highest good utilization rate with 79.73%.
-
4.8. Factors Associated with Computer Utilization
To identify the factors associated with computer utilization among health workers in Benue South a logistic regression model was fitted on the data. The result of the first model named Model A is shown in Table 6. From Table 6
it can be observed that Access to computers, Sex, Qualification, Department, and computer training are statistically significant in predicting the response variable utilization rate (Good or Poor). The model returned an AIC of 435.42.
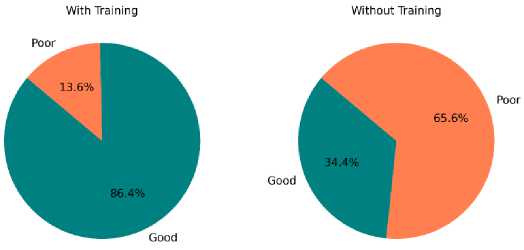
Fig.12. Pie chart visualization of the computer utilization rate of healthcare workers with prior computer training vs. those without computer training.
Table 6. Model A: Logistic regression results showing coefficients, standard errors, Z-values, p-values, confidence intervals, and adjusted odds ratios (AOR) for predictors of computer utilization
|
coef |
std err |
z |
P>|z| |
[0.025 |
0.975] |
AOR |
|
|
const |
0.1549 |
0.871 |
0.178 |
0.859 |
-1.553 |
1.863 |
1.1675 |
|
WLGA |
0.0261 |
0.052 |
0.502 |
0.616 |
-0.076 |
0.128 |
1.0265 |
|
Age |
-0.0076 |
0.017 |
-0.438 |
0.661 |
-0.041 |
0.026 |
0.9924 |
|
Pri_Gov |
-0.1271 |
0.284 |
-0.448 |
0.654 |
-0.683 |
0.429 |
0.8807 |
|
Access |
1.0236 |
0.325 |
3.150 |
0.002 |
0.387 |
1.661 |
2.7833 |
|
Sex |
0.7619 |
0.282 |
2.698 |
0.007 |
0.208 |
1.315 |
2.1424 |
|
Marital_status |
-0.1177 |
0.246 |
-0.478 |
0.632 |
-0.600 |
0.365 |
0.8889 |
|
Qualification |
-0.0614 |
0.030 |
-2.044 |
0.041 |
-0.120 |
-0.003 |
0.9405 |
|
Profession |
-0.0494 |
0.036 |
-1.380 |
0.168 |
-0.120 |
0.021 |
0.9518 |
|
Department |
0.0663 |
0.028 |
2.392 |
0.017 |
0.012 |
0.121 |
1.0685 |
|
Monthly_income |
-0.0620 |
0.171 |
-0.363 |
0.716 |
-0.397 |
0.273 |
0.9399 |
|
Train |
1.6336 |
0.319 |
5.124 |
0.000 |
1.009 |
2.258 |
5.1222 |
The calibration curve of Model A is shown in Fig. 13. It can be observed that some of the predictions are off the perfectly calibrated line in grey. This suggests that this model may not have captured the true relationship between the explanatory and the response variables very well.
"•— Calibration Curve (Model A) — - Perfectly Calibrated
0.8

<л Cj >
о
о
I 0.4
0.2
0.0
0.0 0.2 0.4 0.6 0.8
Mean Predicted Probability
-
Fig.13. Calibration curve of Model A showing the actual instances of positive outcomes vs mean predicted probabilities of positive outcomes generated by Model A. The closer the plot of the mean predicted probabilities to the actual the more reliable the estimation of the predictors in predicting computer utilization. The predictions did not align with the observed which indicates that Model A is not a reliable fit
0.0
0.0 0.2 0.4 0.6 0.8 1.0
A second model named Model B was fitted to include only the significant explanatory variables. Model B revealed that Access to computers, Sex, Department, and computer training are statistically significant (Table 7). However, it is important to note that Qualification which was returned to be statistically significant in Model A (Table 6) now has a p-value of 0.066 as shown in Table 7, and a Confidence interval [-0.105, 0.003] which suggests that qualification does not affect the response variable utilization rate. Hence, it is not statistically significant.
Table 7. Model B: Logistic regression results showing coefficients, standard errors, Z-values, p-values, confidence intervals, and adjusted odds ratios (AOR) for predictors of computer utilization
|
coef |
std err |
z |
P>|z| |
[0.025 |
0.975] |
AOR |
|
|
const |
-1.0215 |
0.453 |
-2.257 |
0.024 |
-1.909 |
-0.134 |
0.3601 |
|
Access |
1.0717 |
0.313 |
3.420 |
0.001 |
0.457 |
1.686 |
2.9203 |
|
Sex |
0.7535 |
0.269 |
2.802 |
0.005 |
0.226 |
1.281 |
2.1245 |
|
Qualification |
-0.0508 |
0.028 |
-1.838 |
0.066 |
-0.105 |
0.003 |
0.9504 |
|
Department |
0.0547 |
0.026 |
2.081 |
0.037 |
0.003 |
0.106 |
1.0562 |
|
Train |
1.6356 |
0.316 |
5.184 |
0.000 |
1.017 |
2.254 |
5.1324 |
Model B returned an AIC of 427.76 which in comparison with the AIC of model A suggests a better model. However, models A and B have similar calibration curves though the predictions appeared to be closer to the perfectly calibrated line in model B (Fig. 14) when compared to model A (Fig. 13).
1.0- -♦- Calibration Curve (Model B) ---- Perfectly Calibrated

Mean Predicted Probability
-
Fig.14. Calibration curve of Model B showing the actual instances of positive outcomes vs mean predicted probabilities of positive outcomes generated by Model B. The predictions did not align well with the observed which indicates that Model B is not a reliable fit
A third model was fitted with only the statistically significant variables in model B. The third model named Model C also revealed that Access to computers, Sex, Department, and computer training are statistically significant as shown in Table 8.
Table 8. Model C: Logistic regression results showing coefficients, standard errors, Z-values, p-values, confidence intervals, and adjusted odds ratios (AOR) for predictors of computer utilization
|
coef |
std err |
z |
P>|z| |
[0.025 |
0.975] |
AOR |
|
|
const |
-1.6033 |
0.330 |
-4.857 |
0.000 |
-2.250 |
-0.956 |
0.2012 |
|
Access |
1.0929 |
0.312 |
3.499 |
0.000 |
0.481 |
1.705 |
2.9829 |
|
Sex |
0.8028 |
0.266 |
3.020 |
0.003 |
0.282 |
1.324 |
2.2318 |
|
Department |
0.0554 |
0.026 |
2.118 |
0.034 |
0.004 |
0.107 |
1.0570 |
|
Train |
1.7107 |
0.313 |
5.465 |
0.000 |
1.097 |
2.324 |
5.5326 |
The calibration curve of model C as shown in Fig. 15 suggests that in comparison to models A and B, C fits the data better. However, model C returned an AIC of 429.16 which is higher than the AIC of model B (427.76). Hence, it is important to establish which of the models (models B and C) explains the response variable better. Therefore, the goodness-of-fit of Models B and C was assessed using (5).
The LRT Statistic (G) obtained for Models B and C is 3.40 with 1.0 degrees of freedom and a p-value of 0.07. A p-value greater than 0.05 suggests that the additional predictors in Model B did not explain the response variable better than in Model C. In other words, Model C significantly improves model fit better than Model B.
Table 8 revealed that those who had access to a computer were 2.98 times more likely to have a good computer utilization rate compared to a poor utilization rate. On variable sex, Male individuals (compared to female individuals) have approximately 2.23 times higher odds of having a good utilization rate compared to a poor utilization rate. However, the wide confidence interval [0.282, 1.324] covering below and above 1 may imply uncertainty in the degree of association. On the Department, based on the result of the computer utilization analysis those working in the Laboratory have 1.06 times higher odds of having a good utilization rate compared to a poor utilization rate. The narrow confidence interval suggests that there is a statistically significant association, and the true odds ratio is likely between 0.004 and 0.107 with 95% confidence. Also, individuals with prior computer training are approximately 5.53 times more likely to have a good utilization rate compared to a poor utilization rate, on average. The confidence interval suggests that the true odds ratio is likely between 1.097 and 2.324 with 95% confidence.
1.0
-♦ Calibration Curve (Model C) ---- Perfectly Calibrated

0.0 0.2 0.4 0.6 0.8 1.0
Mean Predicted Probability
Fig.15. Calibration curve of Model C showing the actual instances of positive outcomes against the mean predicted probabilities of positive outcomes generated by Model C. The mean predicted probabilities of positive outcomes showed a close alignment with the actual instances of positive outcomes indicating a reliable estimate of the predictor’s relationship with computer utilization
The findings of this study align closely with existing literature on ICT adoption and utilization among healthcare professionals, particularly emphasizing the pivotal role of access to computers and formal training in enhancing digital competencies. Similar studies, such as [43, 44] have consistently highlighted that access to ICT resources and comprehensive training significantly influence computer knowledge and utilization among healthcare workers. In this study, 54.19% of healthcare workers passed the computer knowledge test, underscoring a moderate level of computer literacy, which resonates with findings from other regions where varying levels of digital competence have been reported [36, 59]. The implication here is the necessity for targeted educational programs to improve computer literacy, as moderate levels suggest room for significant improvement which could enhance healthcare delivery.
The average computer knowledge among healthcare workers in Benue South mirrors the findings of [36] in Ethiopia and [59], which similarly reported low computer knowledge and utilization among healthcare professionals. The predictors of computer knowledge in this study; access to computers and prior computer training, align with the findings of [36, 60, 61]. In Benue South, access to computers (50.23%) and prior formal computer training (51.40%) were relatively low, reflecting insufficient provision of computer facilities and economic constraints. Ref. [62] found that computer ownership significantly improves the development of computer skills, yet in this study, monthly income had no significant effect on computer knowledge, contrasting with [35]. This finding implies that increasing access to computers and providing regular, structured training could substantially improve computer knowledge among healthcare workers.
The association between access to computers and higher odds of good computer knowledge and utilization (AOR=2.83 and AOR=2.98, respectively) corroborates findings by [45], who emphasize the critical role of resource availability in fostering ICT adoption in healthcare settings. Moreover, the substantial impact of prior computer training (AOR=3.34 for knowledge and AOR=5.53 for utilization) echoes recommendations from [49], highlighting that targeted educational interventions are essential for enhancing digital literacy and optimizing ICT integration in healthcare practices. These findings suggest that healthcare facilities should prioritize investment in computer resources and training programs to enhance staff competencies and improve overall service delivery. However, it is important to note that [63] which assessed knowledge of health information technologies found that previous training alone did not significantly improve practice levels, underscoring the need for continuous and effective training programs to ensure sustained improvements in digital literacy and utilization.
Gender disparities in computer utilization observed in this study also resonate with the broader literature on digital literacy among healthcare professionals. Male respondents exhibited higher levels of computer utilization (77.07%) compared to females (52.01%), consistent with [47]. Additionally, [35] identified gender as a significant factor in computer utilization, supporting our findings. The department where respondents worked also influenced computer utilization significantly, with those in the Laboratory department showing the highest utilization rate (79.72%). This can be attributed to specialized job requirements, such as data collection, analysis, and documentation, which necessitate higher computer use. The implications of these findings include the need for gender-specific training initiatives to address disparities and department-specific training to cater to the unique needs of different healthcare departments.
The organizational context, as reflected in the higher utilization rates in privately owned facilities compared to government-owned ones, aligns with discussions by [49] on the impact of organizational support and infrastructure on ICT utilization. In this study, respondents from privately owned health facilities reported a higher good utilization rate (65.64%) compared to those from government-owned facilities (56.16%). This suggests that private facilities may have better infrastructure and support systems for ICT, implying that government facilities need to improve their ICT infrastructure and support to enhance utilization rates.
This study's finding that monthly income had no significant effect on computer knowledge contrasts with [35], suggesting that other factors may play a more critical role in this context.
In addition, the study by [64] on healthcare professionals' knowledge and attitude towards electronic Personal Health Record (e-PHR) systems in Ethiopia found that computer training and access to digital resources significantly impacted their knowledge and attitude towards e-PHRs. This is consistent with our findings that access to computers and prior training significantly influence computer utilization. However, [64] also highlighted that mere training was not enough, and continuous efforts are needed to enhance practice levels, which aligns with the need for ongoing training highlighted by [63].
Moreover, the study by [65] identified infrastructure and technical barriers, psychological and personal issues, and workload-related concerns as significant barriers to the adoption of digital health technologies. These findings contrast with our study in that while access to computers and training were significant factors in computer knowledge and utilization, broader infrastructure, and workload-related concerns were not explicitly highlighted. Nonetheless, [65] also emphasized that training programs and the perception of technology effectiveness facilitate the adoption of digital technologies, which aligns with our findings on the importance of training and access.
5. Conclusions
In this study, the assessment of computer knowledge and utilization among healthcare professionals in Benue South was conducted and the factors that influence the knowledge and utilization of computers among the health workers were identified using multivariable logistic regression.
The findings of this study revealed that knowledge and utilization of computers among healthcare workers are average. Access to computers and prior formal computer training, along with factors like sex and department, influence both computer knowledge and utilization. This underscores the importance of improved access to computers and comprehensive computer training for healthcare professionals in Benue South. This study, therefore, recommends that:
-
• The management of private and government-owned healthcare facilities should incentivize healthcare workers to acquire computer skills, especially if these skills are verified through passing assessment tests. The incentives could include: paid time off or compensated hours for healthcare workers attending computer training sessions, regular sponsorship of staff to attend targeted computer training programmes, and public recognition through awards and certificates.
-
• The policy makers should integrate other digital literacy initiatives into broader healthcare policies, particularly funding for computer infrastructure upgrades in health facilities.
-
• Partnerships should be established with educational institutions in the senatorial district to develop computer skill acquisition programs targeted at enhancing digital literacy and improving the quality-of-service delivery by healthcare professionals.
While the self-reported data provided insights into perceived computer utilization, observational assessments can be conducted in future studies to offer a more objective measure of actual computer skills and integration into daily healthcare practices. This will further validate these findings and guide future interventions aimed at improving computer knowledge and utilization among healthcare workers.
In conclusion, this study provides valuable insights into computer knowledge and utilization among healthcare workers in Benue South, Nigeria. By aligning with existing research on the influence of access, and training, this study underscores the need for targeted interventions to enhance digital competencies and optimize computer utilization. These efforts are important for improving healthcare delivery and outcomes in the region, as demonstrated by the findings of this study and the broader literature on healthcare informatics and digital health literacy. Specifically, enhancing access to computers, providing comprehensive and continuous training programs, and improving organizational support systems are key areas that could significantly impact the effectiveness of computer utilization in healthcare.
Acknowledgment
The authors are grateful to the data collectors, participants, and the management of the Federal University of Health Sciences, Otukpo, Benue State, Nigeria. This research was funded by “Tertiary Education Trust Fund (TETFUND) 2022 intervention” under the grant number “2022/FX302-IBR”.
References Assessment of Knowledge and Utilization of Computers Among Healthcare Workers in Benue South, Nigeria
- K. Balla et al., “Introducing field digital data collection systems into seasonal malaria chemoprevention campaigns: opportunities for robust evidence development and national e-health strategies,” BMJ Glob. Heal., vol. 7, no. 3, p. e007899, Mar. 2022, doi: 10.1136/BMJGH-2021-007899.
- O. I. Obasola, I. Mabawonku, and I. Lagunju, “A Review of e-Health Interventions for Maternal and Child Health in Sub-Sahara Africa,” Matern. Child Health J., vol. 19, no. 8, pp. 1813–1824, Aug. 2015, doi: 10.1007/S10995-015-1695-0.
- A. Otu et al., “Training health workers at scale in Nigeria to fight COVID-19 using the InStrat COVID-19 tutorial app: an e-health interventional study,” Ther. Adv. Infect. Dis., vol. 8, Aug. 2021, doi: 10.1177/20499361211040704.
- A. T. Aduma, C. C. Onah, and A. C. Njoku, “Application of Information Communication Technology (ICT) in improving service delivery and revenue capacity in university of Nigeria teaching hospital, Ituku Ozalla, Enugu State, Nigeria,” Int. J. Dev. Manag. Rev., vol. 17, no. 1, pp. 235–248, Jun. 2022, doi: 10.4314/ijdmr.v17i1.14.
- S. M. Lee and D. H. Lee, “Opportunities and challenges for contactless healthcare services in the post-COVID-19 Era,” Technol. Forecast. Soc. Change, vol. 167, p. 120712, Jun. 2021, doi: 10.1016/J.TECHFORE.2021.120712.
- M. R. Rinty, U. K. Prodhan, and M. M. Rahman, “A prospective interoperable distributed e-Health system with loose coupling in improving healthcare services for developing countries,” Array, vol. 13, p. 100114, Mar. 2022, doi: 10.1016/J.ARRAY.2021.100114.
- A. S. Rwashana and D. W. Williams, “Enhancing healthcare delivery through ICTs: A case study of the Ugandan immunisation system,” Int. J. Educ. Dev. using Inf. Commun. Technol., vol. 4, no. 2, pp. 144–158, 2008, Accessed: Jul. 21, 2022. [Online]. Available: http://ijedict.dec.uwi.edu/include/getdoc.php?id=4613&article=465&mode=pdf
- M. Sony, J. Antony, and O. McDermott, “The Impact of Healthcare 4.0 on the Healthcare Service Quality: A Systematic Literature Review,” Hosp. Top., vol. 101, no. 4, pp. 288–304, Mar. 2023, doi: 10.1080/00185868.2022.2048220.
- J. Indumathi et al., “Block Chain Based Internet of Medical Things for Uninterrupted, Ubiquitous, User-Friendly, Unflappable, Unblemished, Unlimited Health Care Services (BC IoMT U6HCS),” IEEE Access, vol. 8, pp. 216856–216872, 2020, doi: 10.1109/ACCESS.2020.3040240.
- P. Pawar, N. Parolia, S. Shinde, T. O. Edoh, and M. Singh, “eHealthChain—a blockchain-based personal health information management system,” Ann. des Telecommun. Telecommun., vol. 77, no. 1–2, pp. 33–45, Feb. 2022, doi: 10.1007/S12243-021-00868-6.
- C. D. Norman and H. A. Skinner, “eHealth literacy: Essential skills for consumer health in a networked world,” J. Med. Internet Res., vol. 8, no. 2, 2006, doi: 10.2196/jmir.8.2.e9.
- S. Xesfingi and A. Vozikis, “eHealth Literacy: In the Quest of the Contributing Factors,” Interact. J. Med. Res., vol. 5, no. 2, p. e16, 2016, doi: 10.2196/ijmr.4749.
- B. O. Asibey, S. Agyemang, and A. B. Dankwah, “The Internet Use for Health Information Seeking among Ghanaian University Students: A Cross-Sectional Study,” Int. J. Telemed. Appl., vol. 2017, 2017, doi: 10.1155/2017/1756473.
- T. M. Burrus et al., “Patient Perceptions and Current Trends in Internet Use by Orthopedic Outpatients,” HSS J., vol. 13, no. 3, pp. 271–275, 2017, doi: 10.1007/s11420-017-9568-2.
- I. T. Adeleke, A. H. Lawal, R. A. Adio, and A. A. Adebisi, “Information Technology Skills and Training Needs of Health Information Management Professionals in Nigeria: A Nationwide Study,” Heal. Inf. Manag. J., vol. 44, no. 1, pp. 30–38, Mar. 2015, doi: 10.1177/183335831504400104.
- S. A. Ajayi, P. Wamae, and D. W. Muthee, “Implementation of Electronic Medical Records for Service Delivery in Selected State Hospitals in Southwest Nigeria,” Int. J. Curr. Asp., vol. 5, no. 2, pp. 75–94, Jun. 2021, doi: 10.35942/IJCAB.V5I2.174.
- S. A. Ajayi, P. Wamae, and D. W. Muthee, “Assessing Electronic Medical Records Readiness for Service Delivery in State Hospitals in Southwest Nigeria,” Int. J. Curr. Asp., vol. 5, no. 3, pp. 1–17, Jul. 2021, doi: 10.35942/IJCAB.V5I3.175.
- A. Omotosho, P. Ayegba, J. Emuoyibofarhe, and C. Meinel, “Current State of ICT in Healthcare Delivery in Developing Countries,” Int. J. Online Biomed. Eng., vol. 15, no. 08, pp. 91–107, May 2019, doi: 10.3991/IJOE.V15I08.10294.
- B. Ebenso et al., “Impact of using eHealth tools to extend health services to rural areas of Nigeria: Protocol for a mixed-method, non-randomised cluster trial,” BMJ Open, vol. 8, no. 10, Oct. 2018, doi: 10.1136/BMJOPEN-2018-022174.
- B. Afolabi, “Pantami launches NigComSat’s telehealth platform,” PUNCH. Accessed: Dec. 04, 2023. [Online]. Available: https://punchng.com/pantami-launches-nigcomsats-telehealth-platform/
- NigComHealth, “NigComHealth - Healthcare at your fingertips,” NigComHealth. Accessed: Dec. 04, 2023. [Online]. Available: https://www.nigcomhealth.com/
- O. Oyebode, J. Fowles, D. Steeves, and R. Orji, “Machine Learning Techniques in Adaptive and Personalized Systems for Health and Wellness,” Int. J. Hum. Comput. Interact., vol. 39, no. 9, pp. 1938–1962, 2023, doi: 10.1080/10447318.2022.2089085.
- H. Lu and S. Uddin, “Disease Prediction Using Graph Machine Learning Based on Electronic Health Data: A Review of Approaches and Trends,” Healthc., vol. 11, no. 7, 2023, doi: 10.3390/healthcare11071031.
- T. O. Omotehinwa, D. O. Oyewola, and G. E. Moung, “Optimizing the light gradient-boosting machine algorithm for an efficient early detection of coronary heart disease,” Informatics Heal., vol. 1, no. 2, pp. 70–81, 2024, doi: https://doi.org/10.1016/j.infoh.2024.06.001.
- A. Adebayo, A. Bankole, and J. Adebayo, “The impact and challenges of information and communication technology on health care delivery in Nigeria,” Madonna Univ. Niger. Fac. Law J., vol. 6, no. 2, pp. 19–30, 2021.
- S. Aririguzoh, L. Amodu, I. Sobowale, T. Ekanem, and O. Omidiora, “Achieving sustainable e-health with information and communication technologies in Nigerian rural communities,” Cogent Soc. Sci., vol. 7, no. 1, 2021, doi: 10.1080/23311886.2021.1887433.
- E. O. Emmanuel, “Assessing the Level of E-Health in Africa Using Nigeria as a Model; Barriers and Innovations,” Heal. Syst. Policy Res., vol. 8, no. S3:10, pp. 1–6, 2021, doi: 10.36648/2254-9137.21.S3.104.
- I. O. Ojo, O. R. Oluwatumininu, O. B. Ani, and P. O. Adedeji, “Factors influencing adoption and use of information and communication technologies among nurses in selected hospitals in Nigeria,” J. Health Inform. Dev. Ctries., vol. 15, no. 1, pp. 1–15, 2021.
- J. J. Gimba, J. Mercy, L. Y. Abolore, O. Ileola, and A. O. Rolake, “Knowledge and Utilization of Information Technology Among Nurses and Midwives in Secondary Health Care Facilities, Kaduna State,” Acad. J. Nurs. Heal. Educ., vol. 10, no. 3, pp. 10–20, 2021, Accessed: Jul. 22, 2022. [Online]. Available: https://www.cirdjournal.com/index.php/ajnhe/article/view/29/28
- M. A. Zayyad and M. Toycan, “Factors affecting sustainable adoption of e-health technology in developing countries: An exploratory survey of Nigerian hospitals from the perspective of healthcare professionals,” PeerJ, vol. 2018, no. 3, p. e4436, Mar. 2018, doi: 10.7717/PEERJ.4436/SUPP-2.
- O. O. Onigbogi, A. O. Poluyi, C. O. Poluyi, and M. O. Onigbogi, “Doctors’ Attitude and Willingness to Use Electronic MedicalRecords at the Lagos University Teaching Hospital, Lagos,Nigeria.,” Online J. Public Health Inform., vol. 10, no. 2, Sep. 2018, doi: 10.5210/OJPHI.V10I2.8416.
- G. A. Tesfa, M. H. Kalayou, and W. Zemene, “Electronic Health-Information Resource Utilization and Its Associated Factors among Health Professionals in Amhara Regional State Teaching Hospitals, Ethiopia,” Adv. Med. Educ. Pract., vol. 12, p. 195, 2021, doi: 10.2147/AMEP.S289212.
- H. M. Oo, Y. M. Htun, T. T. Win, Z. M. Han, T. Zaw, and K. M. Tun, “Information and communication technology literacy, knowledge and readiness for electronic medical record system adoption among health professionals in a tertiary hospital, Myanmar: A cross-sectional study,” PLoS One, vol. 16, no. 7, p. e0253691, 2021, doi: 10.1371/journal.pone.0253691.
- N. Mastellos et al., “Training community healthcare workers on the use of information and communication technologies: A randomised controlled trial of traditional versus blended learning in Malawi, Africa,” BMC Med. Educ., vol. 18, no. 1, Apr. 2018, doi: 10.1186/S12909-018-1175-5.
- E. Mohammed, G. Andargie, S. Meseret, and E. Girma, “Knowledge and utilization of computer among health workers in Addis Ababa hospitals, Ethiopia: Computer literacy in the health sector,” BMC Res. Notes, vol. 6, no. 1, 2013, doi: 10.1186/1756-0500-6-106.
- K. Alwan, T. Awoke, and B. Tilahun, “Knowledge and utilization of computers among health professionals in a developing country: A cross-sectional study,” JMIR Hum. Factors, vol. 2, no. 1, 2015, doi: 10.2196/humanfactors.4184.
- I. T. Adeleke, A. A. Salami, M. Achinbee, T. C. Anamah, I. B. Zakari, and M. H. Wasagi, “ICT knowledge, Utilization and Perception among Healthcare Providers at National Hospital Abuja, Nigeria,” Am. J. Heal. Res., vol. 3, no. 1, p. 47, 2015, doi: 10.11648/j.ajhr.s.2015030101.17.
- B. Veljkovic, J. Aleksandric, M. Despotovic, I. Milojevic, M. M. Mladenovic, and C. Alexopoulos, “Computer Literacy of Health Professionals,” in RAP, 2022, pp. 82–85. doi: 10.37392/rapproc.2022.19.
- W. O. Yagos, G. Tabo Olok, and E. Ovuga, “Use of information and communication technology and retention of health workers in rural post-war conflict Northern Uganda: Findings from a qualitative study,” BMC Med. Inform. Decis. Mak., vol. 17, no. 1, 2017, doi: 10.1186/s12911-016-0403-3.
- A. W. Demsash, M. D. Emanu, and A. D. Walle, “Digital technology utilization and its associated factors among health science students at Mettu University, Southwest Ethiopia: A cross-sectional study,” Informatics Med. Unlocked, vol. 38, 2023, doi: 10.1016/j.imu.2023.101218.
- D. A. Rodrigues, M. Roque, R. Mateos-Campos, A. Figueiras, M. T. Herdeiro, and F. Roque, “Barriers and facilitators of health professionals in adopting digital health-related tools for medication appropriateness: A systematic review,” Digit. Heal., vol. 10, 2024, doi: 10.1177/20552076231225133.
- K. Martzoukou et al., “A cross-sectional study of discipline-based self-perceived digital literacy competencies of nursing students,” J. Adv. Nurs., vol. 80, no. 2, pp. 656–672, 2024, doi: 10.1111/jan.15801.
- A. N. Abasilim, D. D. Adejumo, and M. O. Ajayi, “Utilisation of Ict By Healthcare Professionals and its Outcome in Specialist Hospitals in Ondo State, Nigeria,” Int. J. Bus. Res. Manag., vol. 1, no. 1, pp. 1–11, 2024.
- R. O. Boadu et al., “Healthcare providers’ perception towards utilization of health information applications and its associated factors in healthcare delivery in health facilities in Cape Coast Metropolis, Ghana,” PLoS One, vol. 19, no. 2 February, 2024, doi: 10.1371/journal.pone.0297388.
- E. Kulju, E. Jarva, A. Oikarinen, M. Hammarén, O. Kanste, and K. Mikkonen, “Educational interventions and their effects on healthcare professionals’ digital competence development: A systematic review,” Int. J. Med. Inform., vol. 185, 2024, doi: 10.1016/j.ijmedinf.2024.105396.
- D. Ait Ali et al., “A multi-centric investigation of technology integration in health professions education: The importance of educators’ Technological Pedagogical and Content Knowledge,” E-Learning Digit. Media, 2024, doi: 10.1177/20427530241239405.
- A. Aydınlar et al., “Awareness and level of digital literacy among students receiving health-based education,” BMC Med. Educ., vol. 24, no. 1, 2024, doi: 10.1186/s12909-024-05025-w.
- E. Jarva, A. Oikarinen, J. Andersson, S. Pramila-Savukoski, M. Hammarén, and K. Mikkonen, “Healthcare professionals’ digital health competence profiles and associated factors: A cross-sectional study,” J. Adv. Nurs., 2024, doi: 10.1111/jan.16096.
- T. Lottonen, A. M. Kaihlanen, J. Nadav, P. Hilama, and T. Heponiemi, “Nurses’ and physicians’ perceptions of the impact of eHealth and information systems on the roles of health care professionals: A qualitative descriptive study,” Health Informatics J., vol. 30, no. 1, 2024, doi: 10.1177/14604582241234261.
- E. T. Iortyom, I. J. Abawua, and J. T. Shabu, “Assessment of the Implementation of World Bank Assisted Fadama III Project in Capacity Building: Experience of Makurdi Local Government Area of Benue State,” Eur. J. Res., vol. 5, no. 11, pp. 3–20, 2020.
- National Bureau of Statistics, “National Population Estimates.” [Online]. Available: https://nigerianstat.gov.ng/download/474
- Public and Private Development Centre, “List of Coded Health Facilities in Benue State,” THE PPDC E-LIBRARY. Accessed: Jul. 21, 2022. [Online]. Available: http://library.procurementmonitor.org/backend/files/List of Coded Health Facilities in BENUE STATE.pdf
- W. W. Daniel and C. L. Cross, Biostatistics: A Foundation for Analysis in the Health Sciences, vol. 51, no. 1. New York: John Wiley & Sons, 1995.
- R. Giner-Sorolla et al., “Power to Detect What? Considerations for Planning and Evaluating Sample Size,” Personal. Soc. Psychol. Rev., 2024, doi: 10.1177/10888683241228328.
- N. Shrestha, “Detecting Multicollinearity in Regression Analysis,” Am. J. Appl. Math. Stat., vol. 8, no. 2, pp. 39–42, 2020, doi: 10.12691/ajams-8-2-1.
- W. Yoo, R. Mayberry, S. Bae, K. Singh, Q. Peter He, and J. W. Lillard, “A Study of Effects of MultiCollinearity in the Multivariable Analysis.,” Int. J. Appl. Sci. Technol., vol. 4, no. 5, pp. 9–19, 2014.
- P. K. Dunn and G. K. Smyth, Generalized Linear Models With Examples in R, vol. 11762898. 2018. [Online]. Available: http://www.springer.com/series/417
- X. Su, T. Zhou, X. Yan, J. Fan, and S. Yang, “Interaction trees with censored survival data,” Int. J. Biostat., vol. 4, no. 1, 2008, doi: 10.2202/1557-4679.1071.
- N. Ameh, T. S. Kene, and E. A. Ameh, “Computer knowledge amongst clinical year medical students in a resource poor setting,” Afr. Health Sci., vol. 8, no. 1, pp. 40–43, 2008.
- I. S. Bello, F. A. Arogundade, A. A. Sanusi, I. T. Ezeoma, E. A. Abioye-Kuteyi, and A. Akinsola, “Knowledge and utilization of information technology among health care professionals and students in Ile-Ife, Nigeria: A case study of a University Teaching Hospital,” J. Med. Internet Res., vol. 6, no. 4, 2004, doi: 10.2196/jmir.6.4.e45.
- P. Ranasinghe, S. A. Wickramasinghe, W. A. R. Pieris, I. Karunathilake, and G. R. Constantine, “Computer literacy among first year medical students in a developing country: A cross sectional study,” BMC Res. Notes, vol. 5, no. 504, pp. 1–8, 2012, doi: 10.1186/1756-0500-5-504.
- W. R. Lee, “Computer-Based Learning in Medical Education: A Critical View,” J. Am. Coll. Radiol., vol. 3, no. 10, pp. 793–798, 2006, doi: 10.1016/j.jacr.2006.02.010.
- N. D. Mengestie et al., “Health Information Technologies in a Resource-Limited Setting: Knowledge, Attitude, and Practice of Health Professionals,” Biomed Res. Int., vol. 2023, 2023, doi: 10.1155/2023/4980391.
- S. M. Wubante et al., “Healthcare professionals’ knowledge, attitude and its associated factors toward electronic personal health record system in a resource-limited setting: A cross-sectional study,” Front. Public Heal., vol. 11, 2023, doi: 10.3389/fpubh.2023.1114456.
- I. J. Borges do Nascimento et al., “Barriers and facilitators to utilizing digital health technologies by healthcare professionals,” npj Digit. Med., vol. 6, no. 1, 2023, doi: 10.1038/s41746-023-00899-4.
