Assessment of labor potential of rural areas

Author: Chekmareva Elena Andreevna, Panov Mikhail Mikhailovich
Journal: Economic and Social Changes: Facts, Trends, Forecast @volnc-esc-en
Section: Young researchers
Article in issue: 2 (38) т.8, 2015.
Free access
The article presents the authors’ method to evaluate and analyze labor potential in rural areas. It is focused on the role of human factor in solving the problem of sustainable development of rural territories. It considers the need to apply special tools in the study of labor potential of rural areas in order to justify the management decisions on the allocation of budgetary funds for sustainable development. The work discloses the algorithm to calculate the integral index of labor potential of rural areas, the formulas and the sources of required data. Health, education and activity of the population are the main estimated characteristics of labor potential. The authors estimate them by calculating the partial indices for four statistical indicators: mortality in the working age, number of persons with higher education, number of individual entrepreneurs and in-migration. The developed method is tested on the basis of the Vologda Oblast statistical data. The article reveals the results of the partial and integral indices calculation; the specially compiled map clearly shows the main problems and features of the labor potential distribution in the region, in particular: increased values of the labor potential index in the areas near large cities and in the direction of the Vologda - Veliky Ustyug highway, reduced labor potential in the areas located far from the regional center and major highways...
Labor potential, rural areas, assessment of labor potential, assessment method
Short address: https://sciup.org/147223714
IDR: 147223714 | UDC: 331.5(470.12) | DOI: 10.15838/esc/2015.2.38.14
Text of the scientific article Assessment of labor potential of rural areas
Many recent legal and normative acts, adopted at the federal and regional level, set the Russian countryside a task to develop rural territories and ensure food security of the country.
Thus, according to the Federal law “On agriculture development”, signed almost a decade ago, the sustainable development of rural areas is one of the main objectives of the state agrarian policy [8, Paragraph 2, Article 5]. The same long term is specified in the Concept of socio-economic development of the Russian Federation for the period up to 2020, approved in 2008 [4].
Moreover, the Concept stipulates the creation of preconditions for sustainable rural development as the second priority direction of the state policy in agriculture and fisheries industry of the country (see Section V, Paragraph 8). Paragraph 14 of the Food security doctrine, approved two years later, considers directions of sustainable development of rural areas [3]. And in July 2013 the Government adopted a broad target program “Sustainable development of rural areas in 2014–2017 and for the period up to 2020”. And this is not a complete list of the documents that reveal the need to ensure sustainable development of rural territories of Russia and its regions.
Moreover, according to the federal law “On agriculture development”, sustainable development of rural territories is defined as their stable socio-economic development, increase in the agricultural production, improvement of the agriculture efficiency, achievement of the full employment of rural population and rise in the standard of living and rational use of land [8].
The question arises: who should ensure this sustainable development? Naturally, it is people, the working population of rural territories. In particular, the given target program emphasizes that the effective development of productive potential of the agrarian sector requires “activation of human factor in economic growth” [12, p. 5], and “enhancing the role and competitiveness of the domestic agricultural sector is largely dependent on the improvement of qualitative characteristics of labor resources in rural areas... more full use of the available labor forces and attraction of highly qualified personnel” [12, p. 6].
In practice, this means that to implement such programs in the country’s regions and municipalities, the managers are forced to seek the answer to the question: what rural areas have the highest labor potential and where it is reasonable to effectively public money and attract qualified personnel? To answer this question is not easy without the use of special tools for the study of labor potential. Such tools can help make reasonable and competent management decisions. The authors offer a special method to analyze and assess labor potential of rural areas, elaborated by request of the Department of agriculture and food resources of the Vologda Oblast and tested on the statistic data of municipal districts.
So, in accordance with the stated above, the study is aimed at elaborating and justifying the methods to analyze and assess labor potential of rural areas.
To achieve this goal, we have solved the following tasks: 1) the methodological approaches to the analysis and assessment of labor potential of rural areas are theoretically substantiated; 2) the factors influencing the formation of labor potential of rural territories are structured; 3) the method of analysis and assessment of labor potential of rural areas is developed and tested. The solution of the first two tasks was earlier described [10], so this article is devoted to the method.
The information base for the study is the following: domestic and foreign literature (monographs, scientific periodicals), normative-legal acts, method of official reports, statistical data of the Federal State Statistics Service (Rosstat) and the Territorial Body of the Federal State Statistics Service in the Vologda Oblast (Vologdastat), as well Medical Information-Analytical Center at the Vologda Oblast Health Care Department.
First, we will clarify the terminology and briefly determine the concepts of “rural area” and “employment potential”. “The Concept of Sustainable Development of Rural Territories of the Russian Federation for the Period up to 2020” contains the following interpretation: rural areas are territories outside the cities. In essence, this approach identifies rural areas within the region [5, pp. 59-61] and undermines their differentiated evaluation. The organization for economic cooperation and development uses the following definition: “areas with the percentage of rural population being over 50%” [15]. Thus, in our view, it is reasonable to equate the municipal districts corresponding to the named indicator to rural areas. This approach suggests that the territory by definition has strict boundaries. In addition, the municipal district is a unit of the state statistical accounting, which is most consistent with the objectives of the study.
In our research we follow the integrated approach to understanding of the essence and the structure of labor potential and use the definition of I.S. Maslova. According to it, labor potential is a “general characteristic of the measure and quality of the aggregate ability to carry out socially useful activity, which defines the capabilities of an individual, groups of people and all ablebodied citizens to participate in the work” [6, p. 32].
The choice of this definition is determined by the goals of the current research and our stance. However, despite the diversity of existing approaches to the
Table 1. Ranking of the countries according to the degree of ethical economy development
|
Rating |
Country |
Rating level |
|
Very high |
Austria, Denmark, Finland, Germany, Netherlands, Norway, Switzerland, UK, Sweden |
9–11 |
|
High |
France, Spain, Portugal, Brazil, Canada, Italy, Japan, Luxembourg, South Korea |
6–8 |
|
Average |
Australia, Belgium, Czech Republic, Hungary, China, India, Chile, Greece, Indonesia, New Zealand, Slovakia, Slovenia, Taiwan, USA |
3–5 |
|
Low |
Iceland, Ireland, Mexico, Philippines, Romania, Russia, Singapore, Colombia, Malaysia, Peru, Thailand, Turkey, UAE, Argentina, Bulgaria, Costa Rica, Hong Kong, Israel, Pakistan, Poland, Saudi Arabia. |
0–2 |
study of labor potential, its consideration as a complex characteristic consisting of heterogeneous components is a key one. As stated in [10], many scientists emphasize the importance of quantitative and qualitative components of labor potential and recognize health, education and activity of the population as the main quality characteristics. These characteristics are chosen as estimated components of labor potential of rural areas.
According the critical analysis of methods to estimate labor potential, the calculation of the integral index is widely used. It is calculated by the formula:
The so-called “inverse formula” is used if the recorded phenomenon is of negative nature.
I
xi
Xm ах — Xj max i
X max
- X min
I xi
х.-х i min
, max min
where I xi is a value of the partial index, x – an estimated indicator, i – an analysis object (in this case, a name or reference number of the district), X i – an estimated value of the index in region i , X min – a minimum possible value of the estimated indicator, X max – a maximal possible value of the estimated indicator.
It is most reasonable to join partial indices by calculating their arithmetic mean. Thus, the characteristics of labor potential and the values of the integral index dynamics in various years are compared. There is another important issue, such as the principle to determine the minimum and maximum values used in the index calculation.
It is necessary to solve two problems simultaneously: to ensure the comparability of index values and focus on the real conditions of the region. To do this, we use the values observed in the Vologda Oblast values as limit values to calculate the index. Since these can vary from year to year, it is logical to choose them in the statistics providing data for a few years. In this case we focus on the 2000–2012 period.
As already noted, the choice of indicators remains one of the controversial issues in the methodology of estimating labor potential due to the characteristics of the research object. Considering rural areas of the Vologda Oblast, it is rational to rely on the previously identified major problems and the real effect of indicators on the district’s economy. Besides, the indicators are selected on the basis of the analysis of factors, i.e. the assessment of their impact on a certain economic output indicator revealing the impact of labor potential implementation. The Pearson correlation coefficient is used as the main tool. It ranges from -1 (total negative correlation) to 1 (total positive correlation), 0 is a neutral value (no correlation). The comparative index is the following: the total profit of enterprises per the average number of employees in absolute terms, which partly reflects labor productivity. Thus, to identify the correlation, the values of expected indicators of labor potential are compared with the values of organizations’ profit by means of the correlation–regression analysis.
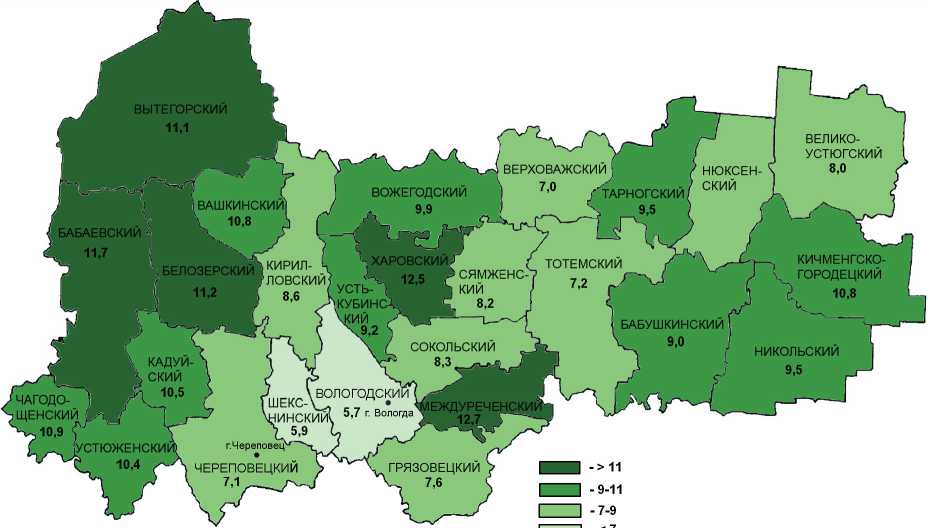
Mortality in working age is the indicator to reflect the population’s health indirectly (fig. 1) .
Figure 1. Mortality in working age in the Vologda Oblast districts in 2012, per 1,000 people of working age
ВЫТЕГОРСКИЙ
ВЕРХОВАЖСКИЙ
ВОЖЕГОДСКИЙ
ТАРНОГСКИЙ
БАБАЕВСКИЙ
ХАРОВСКИЙ.
ТОТЕМСКИЙ
БЕЛОЗЕРСКИЙ
11,2
БАБУШКИНСКИЙ
СОКОЛЬСКИЙ
НИКОЛЬСКИЙ г. Череповец1*
ГРЯЗОВЕЦКИЙ
ЧЕРЕПОВЕЦКИМ
КИРИЛЛОВСКИЙ
УСТЬ- | 1КУБИНС-\кий ,
НЮКСЕН-ский
ВЕЛИКОУСТЮГСКИЙ
КАДУЙ-ский
10,5
СЯМЖЕНС-КИЙ
ЧАГОДО-ЩЕНСКИЙ
Ъ^10,9
1ЕЖДУРЕЧЕНСКИ1
КИЧМЕНГСКО-ГОРОДЕЦКИЙ
10,8
(УСТЮЖЕНСКИ! t 10,4 z~- qJEKC\ВОЛОГОДСКИЙ ) финский 5,7 г ВологДа
ВАШКИНСКИЙ] к 10,8 '
Source: Osnovnye pokazateli deyatel’nosti uchrezhdenii zdravookhraneniya za 2012 god: stat. sb. [Main Indicators of Activity of Health Care Institutions in 2012: Statistics Digest]. MIATs pri Departamente zdravookhraneniya Vologodskoi oblasti [Medical Information-Analytical Center at the Vologda Oblast Health Care Department]. Vologda, 2013. 133 p.
First, the phenomenon of high mortality has a negative impact on labor potential of the territory, reflects the actual loss of labor resources and indirectly indicates the population’s morbidity. Second, in terms of the districts the values of this indicator are calculated by the Federal State Statistics Service, in contrast to the index of life expectancy at birth, which is widely used to assess the population’s health in certain countries and regions, but is not calculated for municipalities. However, the indicator of life expectancy seems too broad, as it covers a range of phenomena beyond the category of “labor potential”: the specificity of fertility and mortality, the features of the state health care policy, the specificity of ethnicity and traditions, climate, ecology, etc. [14]. Third, according to the correlation analysis results, mortality in working age and enterprises’ profit per employee (to be more precise, its natural logarithm, as we follow the log-normal distribution hypothesis) have a significant statistical correlation of mean power (the Pearson correlation coefficient is over 0.5 in modulus).
Let us consider another important characteristic of labor potential – education. The indicator of the education level of the population is most widely used in this case. It is calculated as the number who completed some level of general or vocational education per 1,000 people aged over 15. As a rule, the enrolment rate in primary education is applied to assess human potential. However, according to [10], the territorial differentiation by basic literacy (the number who completed 3 years of elementary school) is negligible; in all districts almost 100% of the population left primary school. The level of higher education, widely used in the methods that solve similar tasks, is more relevant for the evaluation of labor potential (fig. 2). This indicator reflects the number of highly qualified personnel – the key resource of Innovation economics. The indicator has a number of limitations. First, we can not determine the quality of received education on the basis of statistics. Second, we do not know, whether the graduate is employed or not, and if so, whether he/she works in the specialty or not. Nevertheless, we believe that, even with a certain degree of error, this indicator reflects the educational characteristics of labor potential in terms of districts to a greater extent than others. This is partially confirmed in the correlation analysis: the Pearson correlation coefficient amounts to 0.786 if we compare the data on higher education and profit in absolute terms. At the same time, we should note a significant limitation of the indicator: the data on the level of education are only published by the census results. The number of persons with higher education in the period between the censuses should be considered unchanged due to lack of the suitable alternative indicator of educational performance, devoid of such shortcomings.
The third characteristic, we have chosen to assess labor potential of rural areas in the Vologda region, is activity of the population. This quality can manifest itself in different ways.
Figure 2. Number of persons with higher education in the Vologda Oblast districts in 2010 per 1,000 people aged over 15
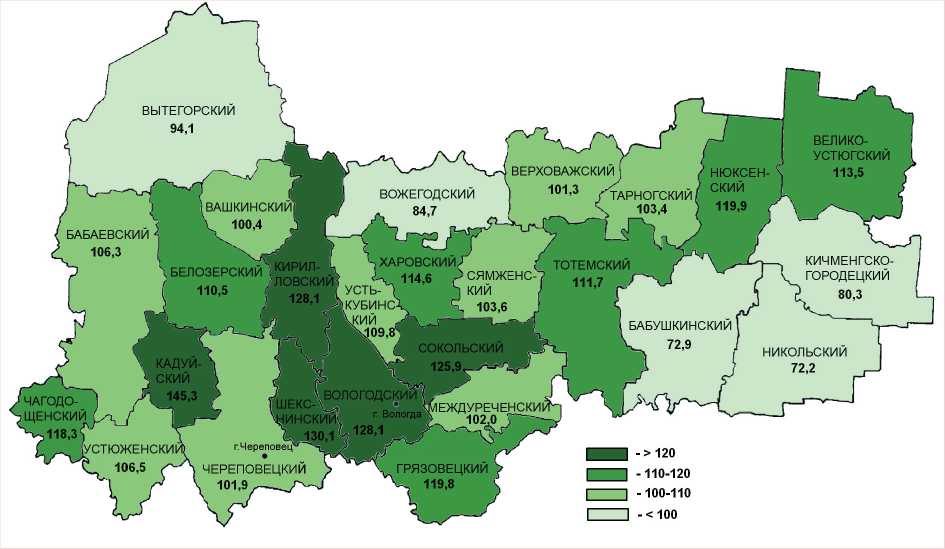
Source: Uroven’ obrazovaniya naseleniya Vologodskoi oblasti: itogi Vserossiiskoi perepisi naseleniya 2010 goda: stat. sbornik [The Education Level of the Vologda Oblast Population: Results of the 2010 All-Russia Population Census: Statistics Digest]. Vologdastat [Territorial Body of the Federal State Statistics Service in the Vologda Oblast], Vologda, 2012. 238 p.
In the context of the labor market analysis the economic and entrepreneurial activities are of great interest. The latter is particularly important for this study because it shows not only the involvement in economic processes, but also the population’s initiative and ability to self employment. The growth and development of private entrepreneurship has a beneficial effect on the territorial economy, contributing to the diversification of employment, the growth of the population’s income, the development of services and private trade [13]. In addition, according to the statistics analysis, the number of individual entrepreneurs (fig. 3) has a significant statistical correlation (r = 0.765) with the gross profit of organizations in the 2000–2012 period.
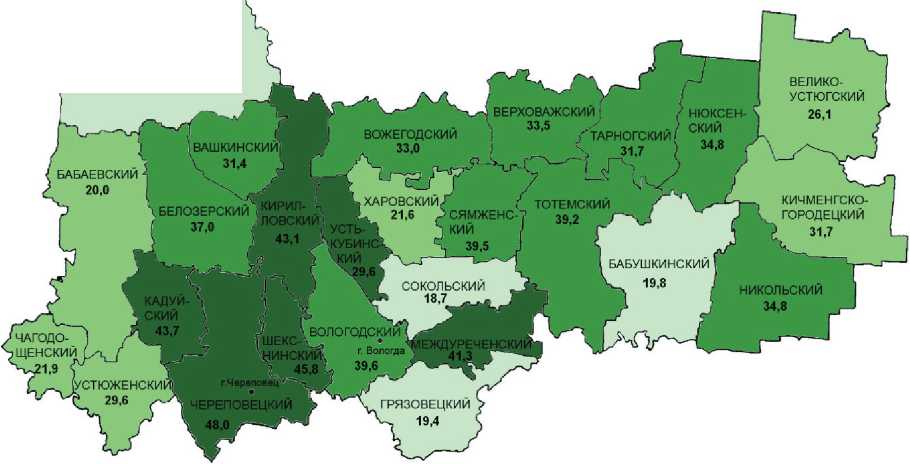
We believe that, in addition to the entrepreneurial activity, the consideration of critical problems of the Vologda Oblast requires the assessment of migration activity. Migration, being a complex phenomenon, can reflect a number of different characteristics of the territory: living conditions (social, economic, political, climatic, etc.), labor market attractiveness, access to certain services (education, health care, etc.).
Figure 3. Number of individual entrepreneurs in the Vologda Oblast districts in 2012, per 1,000 population
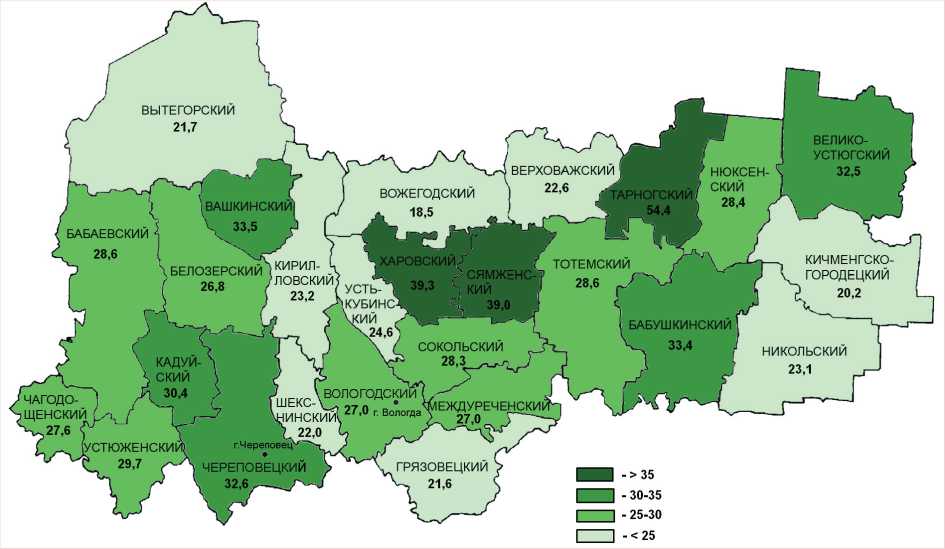
Source: Munitsipal’nye raiony i gorodskie okruga Vologodskoi oblasti: sotsial’no-ekonomicheskie pokazateli, 2012: stat. sb. [Municipal and Urban Districts of the Vologda Oblast: Socio-Economic Indicators, 2012: Statistics Digest]. Vologdastat [Territorial Body of the Federal State Statistics Service in the Vologda Oblast], Vologda, 2013. 324 p.
As noted earlier, in the study migration is represented mainly by active population groups: ambitious young people and people with higher education. Therefore, we can say that most districts are at a disadvantage due to the population outflow. However, the migration rate does not answer the purposes of this study entirely. First, the limits are imposed in connection with its composite nature; if we rely only on its value, we can not describe the phenomena occurring on the territory clearly.
For example, the neutral (close to zero) value can be caused by both low and high migration activity, provided that the outflow is compensated by the inflow. In addition, the coefficient value can be both positive and negative, which significantly hinders its use in the context of the chosen method. In this regard, it is useful to consider one of the coefficient components – an outflow or an inflow. The population outflow is more indicative of certain characteristics of the territory.
However, it is impossible to identify the specific cause of migration and the professional quality of migrants on the basis of a single indicator. Moreover, migration is always dependent on the population.
Figure 4. Migration in the Vologda oblast districts in 2012, per 1,000 population
ВЫТЕГОРСКИЙ
16,3
ВЕРХОВАЖСКИЙ
33,5
ВОЖЕГОДСКИЙ
БАБУШКИНСКИЙ
19,8
ШЕКС
НИНСК1
ЧАГОДО-
|ЩЕНСКИЙ
УСТЬ-’КУБИНС
КАДУИ-СКИЙ
43,7
КИЧМЕНГСКО-ГОРОДЕЦКИЙ
СЯМЖЕНС-КИЙ
39,5
кирил- Ц ловский
43,1 '
ГРЯЗОВЕЦКИЙ
19,4
ТАРНОГСКИЙ
, 31,7
ВАШКИНСКИ1
V 31,4
ЕЖДУРЕЧЕНСКИ!
ЧЕРЕПОВЕЦКИЙ ■ 48,0 ^^^^
НЮКСЕН-
СКИЙ
34,8
БАБАЕВСКИЙ
20,0
(УСТЮЖЕНСКИ!
С* 29,6 /^
ВОЛОГОДСКИМ ( |»м г. Вологда
ХАРОВСКИЙ;
д 21,6 ,
СОКОЛЬСКИЙ
ТОТЕМСКИЙ
39,2 >
L 45,8 г.Череповецх'" "т_
БЕЛОЗЕРСКИЙ
37,0
ВЕЛИКО
УСТЮГСКИЙ
26,1
НИКОЛЬСКИЙ
34,8
I I - 20-30
- 30 40
Source: Demograficheskii ezhegodnik Vologodskoi oblasti. 2012: stat. sbornik [Demographic Yearbook of the Vologda Oblast. 2012: Statistics Digest]. Vologdastat [Territorial Body of the Federal State Statistics Service in the Vologda Oblast], Vologda, 2013. 80 p.
In other words, in the Vologda Oblast districts, characterized by the significant outflow of the population during the analyzed period, there is no one to leave the residence or people have no such desire or ability for it. Therefore, the migration inflow indicator underlies this study (fig. 4). Although, as in the case of the outflow, it is very difficult to find a valid reason for in-migration. In this case, this is not so important: incomers are likely to be involved in the territorial economy, “revive” the labor market, i.e. will create additional supply of labor forces. The indicator is also relevant in the long term: the grown inflow of the population enhances the demographic situation, i.e. potentially increases the number of labor resources. Besides, the correlation coefficient of the migration inflow with the economic profit of organizations amounted to 0.734, indicating a strong correlation between the values of these indicators.
Thus, to assess labor potential of rural areas in the Vologda Oblast we select 4 main indicators that not only reflect the studied characteristics, but also have significant statistical correlations with such an indicator of economic development, as profit of organizations.
Table 1. Method to assess the individual characteristics of labor potential of rural territories in the Vologda Oblast
|
Characteristics of labor potential |
Statistical indicator |
Limit values |
Formula to calculate a private index |
|
|
min |
max |
|||
|
Health |
Mortality in working age, per 1,000 population ( Hi ) |
2.0 |
19.0 |
T _ H max - Hi m I Hi H - H (3 max min |
|
Education |
Persons with higher education, per 1000 persons aged over 15 ( Ei ) |
51 |
145.0 |
I _ E i - E min Ei (4) max min |
|
Activity |
Number of individual entrepreneurs per 1,000 population ( Bi ) |
2.2 |
68.1 |
I _ B i - B min Bi (5) max min |
|
Migration inflow, per 1,000 population ( Mi ) |
0.9 |
48.0 |
I _ M i - M min Mi (6) max min |
|
Note. Hereinafter i – number of a district. Source: compiled by the authors.
Table 1 shows the list with formulas to calculate the corresponding partial indices, the minimum (min) and maximum (max) values of statistical indicators used in the method. The formulas presented in the table are variations of Formulas 1 and 2. We choose the real maximum and minimum values observed in the region in 2000–2012 as limit values. On the one hand, it helps achieve comparability of the integral index values in different years, on the other – take into account the realities of the Vologda Oblast.
Since the activity of the population is represented by two indicators, the partial activity index ( IAi ) is calculated as an arithmetic average of its components:
Т = IB1+IM1
I Ai 2 . (7)
The evaluation is not only aimed at comparing the districts by labor potential, but also at considering the changing trends. Therefore, it is more reasonable to use an arithmetic mean in order to calculate the integral index value. Thus, the formula to calculate the integral index is the following:
I Hi + I Ei + I Ai
where I i is an integral index of labor potential in the i -district, I Hi – a health index, I Ei – an education index, I Ai – a wage index. The calculation is made separately for each area ( i) .
Table 2 presents a detailed description of the index calculation algorithm indicating the stages and the sources of statistical data.
So, on the basis of the generalized theoretical and methodological expertise as well the analyzed statistical data, we
Table 2. Description of the algorithm to calculate the index of labor potential of rural areas
|
№ |
Stage |
Content of the work, explanation |
|
1. |
Preparation of initial data |
This stage is aimed at compiling the source database of statistical information for further processing in the framework of the proposed method |
|
1.1. |
Collection of statistical data by the indicators used in the method |
The source is the official publication of the Territorial Body of the Federal State Statistics Service in the Vologda Oblast. The initial data necessary for the calculation are the following (the specific source is given in brackets):
|
|
1.2. |
Identification of minimum and maximum values |
According to the proposed method, the minimum and maximum values are fixed and correspond to the minimum and maximum values observed in the 2000–2012 period (see tab. 1). If the values are up the limits, the new limit values are set. To achieve the comparability of the assessment results in different years the index values are recalculated, with the new minimum and (or) maximum values being taken into account. |
|
2. |
Data processing |
After collecting the initial data they are arranged according to the method and added in the calculation formulas. |
|
2.1. |
Calculation of relative indices |
The values of the number of individual entrepreneurs and immigration inflow are not published in the relative values necessary for the calculation. In this regard, the absolute values are recalculated per 1,000 population. |
|
2.2. |
Calculation of partial indices |
After arranging all the data on the integral index components the partial indices for four estimated indicators are calculated according to formulas 3, 4, 5, 6 (see tab. 1). Then, to calculate the activity index, the index values for the individual indicators of entrepreneurship and migration inflows are calculated according to Formula 7. |
|
2.3. |
Calculation of the integral index |
The arithmetic mean of the partial indices for three components of the index of labor potential of rural areas is calculated according to Formula 8. If the comparison with the data for previous years is required or the updated limit values are used (see Stage 1.2), the districts indices for previous years are re-calculated according to a similar algorithm. |
|
Source: compiled by the authors |
||
elaborate and scientifically justify the method to estimate labor potential of rural areas and other districts of the Vologda Oblast. The methodological framework of this methodology is widely used in the international and domestic studies. It underlines its scientific relevance and practical significance. The analysis of the factors and the identification of their correlation with the profit of organizations help choose the indicators, which are most significant in terms of the studied territory. The scarcity of the indicators used helps identify the differentiation of its territories.
To test the method we calculate the index of labor potential of rural areas in the Vologda Oblast districts and present it in table 3 .
Table 3. Index of labor potential of rural areas in the Vologda Oblast, 2012
|
Territory |
Mortality in working age, per 1,000 people of working age |
Health index |
Number of persons with higher education, per 1,000 people aged over 15 |
Education index |
Number of entrepreneurs per 1,000 people |
Inmigration, per 1,000 people |
Activity index |
Index of labor potential of rural areas |
Position in the rating |
|
Total by regions |
8.6 |
0.612 |
111.3 |
0.641 |
28.0 |
31.5 |
0.520 |
0.591 |
х |
|
Rural areas |
8.3 |
0.627 |
103.3 |
0.557 |
27.7 |
35.4 |
0.560 |
0.581 |
х |
|
Other districts |
8.9 |
0.597 |
119.5 |
0.729 |
28.3 |
27.3 |
0.479 |
0.601 |
х |
|
Babaevsky |
11.7 |
0.427 |
106.3 |
0.588 |
28.6 |
20.0 |
0.403 |
0.473 |
21 |
|
Babushkinsky |
9.0 |
0.591 |
72.9 |
0.233 |
33.4 |
19.8 |
0.438 |
0.421 |
24 |
|
Belozersky |
11.2 |
0.458 |
110.5 |
0.633 |
26.8 |
37.0 |
0.569 |
0.553 |
15 |
|
Vashkinsky |
10.8 |
0.485 |
100.4 |
0.526 |
33.5 |
31.4 |
0.562 |
0.524 |
11 |
|
Velikoustyugsky |
8.0 |
0.644 |
113.5 |
0.665 |
32.5 |
26.1 |
0.498 |
0.602 |
18 |
|
Verkhovazhsky |
7.0 |
0.704 |
101.3 |
0.535 |
22.6 |
33.5 |
0.501 |
0.580 |
14 |
|
Vozhegodsky |
9.9 |
0.536 |
84.7 |
0.359 |
18.5 |
33.0 |
0.464 |
0.453 |
22 |
|
Vologodsky |
5.7 |
0.782 |
128.1 |
0.820 |
27.0 |
39.6 |
0.599 |
0.734 |
2 |
|
Vytegorsky |
11.1 |
0.463 |
94.1 |
0.458 |
21.7 |
16.3 |
0.312 |
0.411 |
25 |
|
Gryazovetsky |
7.6 |
0.673 |
119.8 |
0.732 |
21.6 |
19.4 |
0.344 |
0.583 |
13 |
|
Kaduysky |
10.5 |
0.502 |
145.3 |
1.000 |
30.4 |
43.7 |
0.669 |
0.725 |
3 |
|
Kirillovsky |
8.6 |
0.612 |
128.1 |
0.821 |
23.2 |
43.1 |
0.608 |
0.680 |
4 |
|
K.-Gorodetsky |
10.8 |
0.481 |
80.3 |
0.312 |
20.2 |
24.8 |
0.390 |
0.394 |
26 |
|
Mezhdurechensky |
12.7 |
0.368 |
102.0 |
0.543 |
28.0 |
41.3 |
0.625 |
0.512 |
20 |
|
Nikolsky |
9.5 |
0.556 |
72.2 |
0.225 |
23.1 |
34.2 |
0.512 |
0.431 |
23 |
|
Nyuksensky |
8.6 |
0.611 |
119.9 |
0.733 |
28.4 |
34.8 |
0.558 |
0.634 |
7 |
|
Sokolsky |
8.3 |
0.630 |
125.9 |
0.797 |
28.3 |
18.7 |
0.387 |
0.605 |
10 |
|
Syamzhensky |
8.2 |
0.633 |
103.6 |
0.560 |
36.0 |
39.5 |
0.666 |
0.620 |
8 |
|
Tarnogsky |
9.5 |
0.557 |
103.4 |
0.557 |
54.4 |
31.7 |
0.723 |
0.612 |
9 |
|
Totemsky |
7.2 |
0.695 |
117.1 |
0.703 |
28.6 |
39.2 |
0.607 |
0.668 |
5 |
|
Ust-Kubinsky |
9.2 |
0.577 |
109.8 |
0.626 |
24.6 |
40.7 |
0.592 |
0.598 |
12 |
|
Ustyuzhensky |
10.4 |
0.505 |
106.5 |
0.590 |
29.7 |
29.6 |
0.513 |
0.536 |
17 |
|
Kharovsky |
12.5 |
0.381 |
114.6 |
0.676 |
39.3 |
21.6 |
0.501 |
0.519 |
19 |
|
Chagodoshchensky |
10.9 |
0.476 |
118.3 |
0.716 |
27.6 |
21.9 |
0.416 |
0.536 |
16 |
|
Cherepovetsky |
7.1 |
0.699 |
101.9 |
0.542 |
32.6 |
48.0 |
0.730 |
0.657 |
6 |
|
Sheksninsky |
5.9 |
0.769 |
130.1 |
0.842 |
22.0 |
45.8 |
0.627 |
0.746 |
1 |
|
Source: authors’ calculations. |
|||||||||
Judging by the data, in 2012 there was a significant differentiation of districts by the index of labor potential of rural areas. Thus, in Sheksninsky District, leading in the ranking, the index is almost 2 times higher than in Kichmengsko-Gorodetsky District, which ranges the last. Vologodsky District and Kaduysky District are other leaders by this index, the rest lag behind significantly. The determining factors are the following: migration attractiveness of the territory and a number of persons with higher education partly related to it.
For example, Kaduysky District, despite the low value of the health index, has a high level of education. At the same time, Cherepovetsky District, leading by the activity index and the health index, ranges the 6th place by the composite index due to the low level of education.
The entrepreneurial activity in the districts also varies greatly. This is partly explained by the fact that the significant migration inflows has been observed only in recent years (1945 people in 2012, compared to 295 in 2010; see tab. 3) and have not had influenced much yet. As for the districts, which occupy the last places in the ranking, in addition to Kichmengsko-Gorodetsky District, we can mention Vytegorsky District, Babushkinsy District and Nikolsky District, close to each other by the value of the integral index.
However, there are some characteristic features. If Kichmengsko-Gorodetsky District and Vytegorsky District lag behind by all indicators, Nikolsky District and Babushkinsky District – by level of education. Some districts with the low proportion of rural population are characterized by very low activity of the population, but average and even high indicators of health and education. These are Babaevsky District, Gryazovetsky District, Sokolsky District and Chagodoshchensky District.
In general, despite the fact that small towns and urban-type settlements have relatively efficient health care and education systems, the attractiveness of these areas for human resources and entrepreneurship is low.
As for rural and other districts of the region, there is no obvious difference between these groups by the composite index value. Although, apart from those mentioned above, there are many other interesting features.
So, most rural areas are characterized by low levels of education (Kichmengsko-Gorodetsky District – 72 people with higher education per 1000 persons of the population, Babushkinsky District – 72.9, Vozhegodsky – 84.7, etc.; see tab. 3). As a result, leading in immigration and entrepreneurship, the rural areas are inferior in the number of persons with higher education. To make the comparison of rural and other areas more vivid we divide them in five groups according to the labor potential index value: very low (below 0.500); low (0.500 to 0.600); average (0.600-0.700); high (0.700-0.800) and very high (above 0.800). The similar principle of grouping is used in the UNDP method [2, pp. 144-147].
Table 4. Grouping of the Vologda Oblast districts by the index of labor potential of rural territories (including the proportion of the rural population, according to the 2012 data)
|
Districts groups |
Region |
Value of the index of labor potential of rural areas |
Share of rural population, % |
Position in the rating |
|
Areas with the high level of labor potential |
Sheksninsky |
0.746 |
36.7 |
1 |
|
Vologodsky |
0.734 |
100 |
2 |
|
|
Kaduysky |
0.725 |
19.2 |
3 |
|
|
Areas with the average level of labor potential |
Kirillovsky |
0.680 |
51.3 |
4 |
|
Totemsky |
0.668 |
57.9 |
5 |
|
|
Cherepovetsky |
0.657 |
100 |
6 |
|
|
Nyuksensky |
0.634 |
100 |
7 |
|
|
Syamzhensky |
0.620 |
100 |
8 |
|
|
Tarnogsky |
0.612 |
100 |
9 |
|
|
Sokolsky |
0.605 |
15.6 |
10 |
|
|
Velikoustyugsky |
0.602 |
30.1 |
11 |
|
|
Areas with the low level of labor potential |
Ust-Kubinsky |
0.598 |
100 |
12 |
|
Gryazovetsky |
0.583 |
38.4 |
13 |
|
|
Verkhovazhsky |
0.580 |
100 |
14 |
|
|
Belozersky |
0.553 |
42.7 |
15 |
|
|
Chagodoshchensky |
0.536 |
26.7 |
16 |
|
|
Ustyuzhensky |
0.536 |
49.6 |
17 |
|
|
Vashkinsky |
0.524 |
100 |
18 |
|
|
Kharovsky |
0.519 |
38.1 |
19 |
|
|
Mezhdurechensky |
0.512 |
100 |
20 |
|
|
Areas with the very low level of labor potential |
Babaevsky |
0.473 |
43.6 |
21 |
|
Vozhegodsky |
0.453 |
59.4 |
22 |
|
|
Nikolsky |
0.431 |
61.6 |
23 |
|
|
Babushkinsky |
0.421 |
100 |
24 |
|
|
Vytegorsky |
0.411 |
60.5 |
25 |
|
|
K.-Gorodetsky |
0.394 |
100 |
26 |
|
|
Sources: compiled by the authors. |
||||
Table 4 presents these groups of districts, except for the group with the very high index value, as there were no such districts in 2012. The proportion of rural population is given. The figures in italics indicate those areas that in this study are considered as rural.
As the table demonstrates, the rural areas can be observed in all groups of districts. At the same time, given that Vologodsky District is, in fact, adjacent to the regional capital and, therefore, falls within the area of its economic impact, it is not reasonable to compare it to other rural areas.
The lower part of the table includes 5 districts with predominant rural population. However, the group of territories with the low level of labor potential is mostly represented by the districts with the high share of urban population. Thus, despite the differences in the values of the partial indices, the labor potential indices of rural and urban areas differ slightly. The map shows districts groups, reveals the increasing labor potential index values of the areas located near large cities and also in the direction of Vologda–Veliky Ustyug ( fig. 5 ).
In addition, it is interesting to compare the 2012 index value with the earlier data
( tab. 5 ). The year of 2002 is chosen due to more accurate data in regard to the conducted census.
As the above data show, during the period under review all districts are characterized by the increase in the value of labor potential of rural areas. Although many areas maintain or slightly chang their positions, the obvious significant changes are observed in some of them, for example, in Kirillosky District, Tarnogsky District, Chagodoshchensky District and Sheksninsky District. However, Velikoustyugsky District, Mezhdurechensky District and Sokolsky District loose their positions.
Figure 5. Index of labor potential of rural areas in the Vologda Oblast districts in 2012
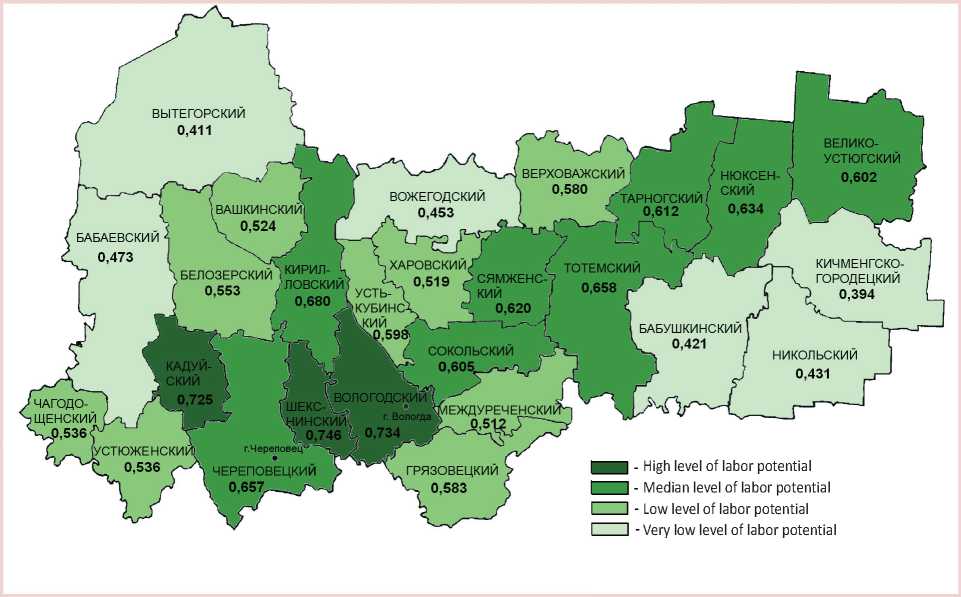
Source: authors’ calculations.
Table 5. Index of labor potential of rural areas in the Vologda Oblast districts in 2002 and 2012
|
Territory |
Index value |
Position in the rating |
||
|
2002 |
2012 |
2002 |
2012 |
|
|
Total by districts |
0.361 |
0.591 |
No data |
No data |
|
Rural territories |
0.343 |
0.581 |
No data |
No data |
|
Other districts |
0.378 |
0.601 |
No data |
No data |
|
Babaevsky |
0.245 |
0.473 |
23 |
21 |
|
Babushkinsky |
0.212 |
0.421 |
26 |
24 |
|
Belozersky |
0.298 |
0.553 |
16 |
15 |
|
Vashkinsky |
0.337 |
0.524 |
13 |
11 |
|
Velikoustyugsky |
0.498 |
0.602 |
1 |
18 |
|
Verkhovazhsky |
0.318 |
0.580 |
15 |
14 |
|
Vozhegodsky |
0.255 |
0.453 |
21 |
22 |
|
Vologodsky |
0.471 |
0.734 |
2 |
2 |
|
Vytegorsky |
0.235 |
0.411 |
24 |
25 |
|
Gryazovetsky |
0.326 |
0.583 |
14 |
13 |
|
Kaduysky |
0.411 |
0.725 |
5 |
3 |
|
Kirillovsky |
0.360 |
0.680 |
11 |
4 |
|
K.-Gorodetsky |
0.296 |
0.394 |
18 |
26 |
|
Mezhdurechensky |
0.352 |
0.512 |
12 |
20 |
|
Nikolsky |
0.256 |
0.431 |
20 |
23 |
|
Nyuksensky |
0.379 |
0.634 |
7 |
7 |
|
Sokolsky |
0.463 |
0.605 |
3 |
10 |
|
Syamzhensky |
0.364 |
0.620 |
10 |
8 |
|
Tarnogsky |
0.298 |
0.612 |
17 |
9 |
|
Totemsky |
0.373 |
0.668 |
8 |
5 |
|
Ust-Kubinsky |
0.387 |
0.598 |
6 |
12 |
|
Ustyuzhensky |
0.245 |
0.536 |
22 |
17 |
|
Kharovsky |
0.292 |
0.519 |
19 |
19 |
|
Chagodoshchensky |
0.231 |
0.536 |
25 |
16 |
|
Cherepovetsky |
0.414 |
0.657 |
4 |
6 |
|
Sheksninsky |
0.365 |
0.746 |
9 |
1 |
|
Source: authors’ calculations. |
||||
Analyzing the dynamics of partial indices, it is worth noting that the mortality index does not virtually change (0.628 in 2002 against 0.612 in 2012). All other indicators increase by 2–3 times: the index of education – from 0.258 to 0.641, activity – from 0.196 to 0.520. On the one hand, this indicates the stability of mortality rates in working-age, but, on the other hand, – the growth of the level of education, migration and entrepreneurial activity of the population, contributing, in our opinion, to the transition of the region’s economy to the innovative way of development.
We can offer the recommendations for this index application, such as the comparison of values between the districts for a given year and the study of the overall dynamics of the index change in the individual districts and in the whole region. It should also be noted that the integral index reflects a certain set of phenomena that determine labor potential of the area. In this regard, it will be more informative to thoroughly analyze the statistics for individual characteristics of labor potential. This is especially true in cases of low and very low values (see tab. 3) because it will help identify the actual problems that hinder the growth of labor potential of the territory. In addition to the defining factor consideration, it makes sense to analyze the statistics for the accompanying figures. So, when studying the reasons for the high mortality rates one should conduct the in-depth analysis of the incidence, the territorial accessibility of health care institutions, as well as the coverage of preventive inspections, conducted activities to promote healthy lifestyles, etc. The low level of education can be caused by the remoteness of higher education institutions from place of residence and the shortage of demand in graduates on the local labor market, which necessitates the creation of jobs. The low in-migration usually indicates the low migration attractiveness of territories that can be caused by the stagnated labor market, adverse living conditions, poorly developed social infrastructure. The analysis of entrepreneurial activity can be focused not only on endogenous factors of the labor market, but also on the assessment of SME support provided by local governments. As for the research in the dynamics of general and partial values of the index, there will be informative, first of all, to observe the changes.
If there are negative trends, it is necessary to analyze the administrative decisions of local and regional authorities, which could cause the decline. In the case of the increased values of the partial index, it is advisable not only to identify the determining factor, but also analyze the possibility to transfer the successful experience to the lagging areas.
References Assessment of labor potential of rural areas
- Demograficheskii ezhegodnik Vologodskoi oblasti. 2012: stat. sbornik . Vologdastat , Vologda, 2013. 80 p.
- Doklad o chelovecheskom razvitii 2013. Vozvyshenie Yuga: chelovecheskii progress v mnogoobraznom mire . PROON . Moscow: Ves’ Mir, 2013. 216 p.
- Doktrina prodovol’stvennoi bezopasnosti Rossiiskoi Federatsii: utv. Ukazom Prezidenta RF ot 30 yanvarya 2010 goda № 120 . Available at: http://www.kremlin.ru/news/6752
- Kontseptsiya dolgosrochnogo sotsial’no-ekonomicheskogo razvitiya Rossiiskoi Federatsii na period do 2020 goda: utv. rasporyazheniem Pravitel’stva Rossiiskoi Federatsii ot 17 noyabrya 2008 g. № 1662-r . Available at: http://www.government.ru/content/governmentactivity/insiderfgovernment/archive/2008/11/25/69b3495c378e451db8df6c3a265a755b.doc
- Kontseptsiya ustoichivogo razvitiya sel’skikh territorii Rossiiskoi Federatsii na period do 2020 goda . Tsentr ekonomicheskoi bezopasnosti . Available at: econsec.ru/files/28.pdf.
- Maslova I.S. Trudovoi potentsial sovetskogo obshchestva. Voprosy teorii i metodologii issledovaniya . Moscow: Politizdat, 1987. 125 p.
- Munitsipal’nye raiony i gorodskie okruga Vologodskoi oblasti: sotsial’no-ekonomicheskie pokazateli, 2012: stat. sb. . Vologdastat , Vologda, 2013. 324 p.
- O razvitii sel’skogo khozyaistva: FZ ot 29.12.2006 № 264 (red. ot 29.12.2014) . Available at: http://www.consultant.ru/document/cons_doc_LAW_173011/
- Osnovnye pokazateli deyatel’nosti uchrezhdenii zdravookhraneniya za 2012 god: stat. sb. . MIATs pri Departamente zdravookhraneniya Vologodskoi oblasti . Vologda, 2013. 133 p.
- Panov M.M., Chekmareva E.A. Trudovoi potentsial sel’skikh territorii Vologodskoi oblasti: sostoyanie i problemy razvitiya . Voprosy territorial’nogo razvitiya , 2014, no. 10 (20). Available at: http://vtr.vscc.ac.ru/file.php?module=Articles&action=view&file=article&aid=4373
- Uroven’ obrazovaniya naseleniya Vologodskoi oblasti: itogi Vserossiiskoi perepisi naseleniya 2010 goda: stat. sbornik . Vologdastat , Vologda, 2012. 238 p.
- Ustoichivoe razvitie sel’skikh territorii na 2014-2017 gody i na period do 2020 goda: federal’naya tselevaya programma: utv. postanovleniem Pravitel’stva Rossiiskoi Federatsii ot 15 iyulya 2013 g. № 598 . Available at: http://www.vologda-agro.ru/images/stories/Information/Other_documents/00056.pdf
- Shik O., Tikhonova T. Al’ternativnaya nesel’skokhozyaistvennaya zanyatost’ v sel’skoi mestnosti Rossii: nauchnyi otchet . Moscow: Institut ekonomiki perekhodnogo perioda, 2007. 206 p.
- Human Development Report 1990. UNDP. New York: Oxford University Press, 1990. 180 p.
- OECD Regional Typology. OECD Directorate for Public Governance and Territorial Development, 2011. Available at: http://www.oecd.org/gov/regional-policy/OECD_regional_typology_Nov2012.pdf
