Assessment of the reaction of cyclical unemployment to the economic decline and recovery growth in Russia

Author: Blinova Tatyana V., Rusanovskii Viktor A., Markov Vladimir A.
Journal: Economic and Social Changes: Facts, Trends, Forecast @volnc-esc-en
Section: Labor economics
Article in issue: 6 т.13, 2020.
Free access
The purpose of the research is to conduct the econometric modeling of the interconnection between changes of the output and unemployment levels in Russia by disaggregating the periods of the decline and economic growth. Research methods are based on a modified Okun’s model which reflects the impact of changes in the output volumes on the dynamics of the unemployment level. The sample includes 79 Russian regions and uses annual (2000-2019) and quarterly (2010-2019) data. The results obtained showed that the Okun’s coefficient is negative in each studied specification, which corresponds to the theoretical content of the interaction between macro-economic parameters. Middle-term (2010- 2019) values of the Okun’s coefficient (-0.105) are acquired on the basis of the Generalized Linear Model assessments, which is free from perturbations associated with quarterly parameter fluctuations. The Okun’s coefficient value, calculated according to quarterly data, is around -0.05. We statistically analyzed the “asymmetry effects” on the labor market during the economic decline and recovery growth on the basis of annual data (2000-2019). Assessments of the econometric models showed that the Okun’s coefficient displays stronger reaction of the unemployment to the decline (-0.167) in comparison with the recovery growth (-0.090). The novelty of the research results is related to the construction of the econometric models reflecting the impact of changes in the output models on the dynamics of the unemployment level in Russia in 2000-2019 and disaggregated periods of the economic decline and recovery growth. The following development of this research will be related to the assessment of the impact of the economic recession on the unemployment level in Russian regions. The results may be used for conducting anti-crisis policy in the labor market during the economic recession.
Okun's model, unemployment level, cyclical decline, economic growth
Short address: https://sciup.org/147225503
IDR: 147225503 | UDC: 331.56 | DOI: 10.15838/esc.2020.6.72.11
Text of the scientific article Assessment of the reaction of cyclical unemployment to the economic decline and recovery growth in Russia
The interconnection between changes in the output volumes and unemployment rate is one of the most important aspects in the system of macro-economic interactions. The fundamental basis for studying the impact of the output decline on rising unemployment is the Okun’s law, which measures the cyclical response to economic shocks. The negative macro-economic interdependence between the unemployment rate and growth (decline) of the output, described by Okun, reflects the reaction of the cyclical unemployment to cyclical economic changes in the country [1]. The literature also discusses the inverse relationship for assessing the potential reserves of the economic growth and achieving “full employment” or determining the risks and scale of the output reduction when the unemployment rate increases. It should be noted that the Okun’s original model was originally intended to assess the potential gross national product under the condition of the full employment, which ensures a maximum possible usage of labor and capital resources with a target unemployment rate of 4% [1].
Average estimates, made for 1947–1960, showed that an additional percentage point above the target unemployment rate means nearly a 3% decrease in actual GNP [1]. For the interconnection of the macro-parameters, studied in this article, another conclusion of the author is important: namely, an assumption that, in periods when the economic growth exceeds 2.25%, a 1% increase of the real output leads to the decrease in the unemployment rate by 0.5% [1].
The scientific literature presents and discusses the values of the Okun’s coefficient differentiated by a country, which reflects the institutional, economic, social, and cultural features of the national labor market development [2–12]. Different authors compared the effect of the Okun’s law in developed and developing economies. The estimates obtained showed that, on average, the Okun’s coefficient, which measures a short-term sensitivity of the labor market to fluctuations in the output volume, is about twice as high in developed countries than in developing countries [9]. There are differences in the time of estimates or, depending on the choice of a studied period, they signal the strength of economic shocks, a degree of sensitivity of labor market indicators, and the cyclical response of the unemployment rate to cyclical changes in the output at different stages of the country’s economic development. In addition, it is proved that the estimates are sensitive to the choice of specifications of the Okun’s model [10]. However, the most significant differences are noted in the moments when periods of the economic decline and recovery growth are studied within the development of any country’s national economy. The behavioral responses of regional and national labor markets to cyclical recession have always interested researchers and decision makers. According to Russian scientists, “in the times of crisis, it is especially important to understand the effect of the output decline on the unemployment rate, since this is one of the most important economic and social indicators” [13, p. 28].
Many researchers emphasize that the Okun’s Law provides an understanding of the “cyclical effects “in the “output-unemployment” relationship, theoretically justifying and empirically testing the mechanisms of the interaction between the labor market on the one hand and the market of goods and services on the other. Econometric estimates of the cyclical growth in the unemployment rate are particularly relevant at the time when many countries experience the effects of the coronavirus pandemic, which has led to a reduction in demand for goods and services, a drop in incomes, and staff lay-offs, especially small businesses and services. In addition, experts predict an incoming cyclical economic recession, when the output decline and the unemployment increase will be more significant. The results of our study, conducted using a modified Okun’s model, show the dependence of the nature of the “output- unemployment” relationship on the business cycle phase.
The main purpose of the study is to perform a quantitative assessment of the Okun’s coefficient, which reflects the relationship between changes in gross domestic product (GDP) and the unemployment rate during periods of the decline and economic growth in Russia. The scientific novelty consists of the theoretical justification and formalized representation of the interaction mechanisms between the unemployment and output during the decline and recovery growth in Russia. The sample includes 79 entities of the Russian Federation, the studied period is from 2000 to 2019, while quarterly data are used for the 2010–2019 period, and the periods of the decline and economic growth are disaggregated.
Theoretical aspects of the research
There are many works in the scientific literature devoted to the empirical analysis of cyclical economic fluctuations, which analyze the behavior of labor market indicators. For example, A. Evans evaluated the impact of changes in the output on the dynamics of the unemployment rate with a case study of the Australian economy. In his work, the sensitivity of the “unemployment gap” to the “output gap” was interpreted as a measure of the Okun’s coefficient [14]. A. Evans separated the cycle and trend by the unemployment rate and the logarithm of actual gross domestic product (GDP), and the cyclical components were interpreted in terms of the output and unemployment gaps. The methodology of the decomposition of the trend and cycle led to the overestimation of the absolute assessments of the Okun’s coefficient that drew special attention. However, this allowed us to differentiate the values of the Okun’s coefficient by age and gender and conclude that middle-aged men participate in the labor force throughout the business cycle, while women’s participation is pro-cyclical [14].
For the Russian economy, scientists of the Institute of Economic Forecasting were among the first researchers who studied the relationship between changes in the output and unemployment rate using the Okun’s model, revealing the features of its indication in the Russian labor market. The calculations made it possible to conclude that a short-term “increase of the output by 1% leads to the decrease in the unemployment rate by approximately 0.06% within three quarters after the occurrence of the initial change” [15]. Studies have shown that the values of the Okun’s coefficient depend not only on the state of the economy in different countries but also on the evaluation period, as well as the sample size. Thus, the authors noted that, before 2000, a medium-term Okun’s coefficient in Russia was lower by a module (–0.12) than after 2000 (–0.25), when “a 1% increase in real GDP led to the reduction in the unemployment rate by a quarter of a percent”, showing a higher sensitivity [15, p. 494]. At the same time, attention was focused on a lack of an instant reaction of the unemployment to the output changes. As a result, scientists conclude that the studied macro-parameters show high inertia, and they largely depend on their past values, showing a weak mutual influence. Explaining a low sensitivity of the unemployment to the output changes, the authors note that the adaptation, as a rule, takes place “primarily not due to changes in a number of employees but due to changes in real wages, a number of hours worked, the length of a working week, etc.” [15, p. 477].
Other scientists rightly believe that lower values of the Okun’s coefficient in Russia “may reflect not just the specifics of the domestic labor market but rather the conditions in which the Russian economy developed during the studied period” [16, pp. 21–22]. In their opinion, and we should agree with it, in Russia, the Okun’s law is implemented in the same way as in other countries, but the coefficient values there are lower than in most economically developed countries. The authors believe that differences between countries and time periods are determined not only by labor market institutions that affect a degree of the employees’ protection but also by the nature of shocks. The authors’ calculations show that the reaction of the labor market to the acceleration of the economic growth by 1% means the unemployment decline by 0.1% in a short-term period, and it also leads to the increase of the decline rate by 0.15% in a medium-term period [16].
Foreign and domestic researchers have tested and repeatedly discussed the hypothesis of an asymmetric response of the unemployment to economic shocks. In particular, estimates of the impact of economic fluctuations on the unemployment rate in the United States in 1947–1999 showed that it was more significant during the decline [11]. A strong link between the economic fluctuations and unemployment during the decline was also revealed by other studies [12]. The Russian authors also obtained data confirming that, during the economic decline, the reaction of the unemployment rate is stronger than during the economic growth. “The Okun’s coefficient is significantly higher in the module (–0.18 vs. –0.07) during the decline in growth rates, i.e., during the periods of the output decline, the reaction of the unemployment rate is much greater than during the growth periods” [13, p. 37]. Based on the estimates made, the authors concluded that, in Russia, as well as in foreign countries during the periods of economic declines, the “output-unemployment” relationship increases, but it weakens with the beginning of the growth. However, later, when scientists analyzed the impact of interregional mobility on the interaction of the gross regional product (GRP) and the unemployment rate in the regions of the Russian Federation, no differences were revealed. On the contrary, calculations have shown that the asymmetry of the adjustment of the unemployment rate to the growth and decline of the GRP does not appear if spatial interactions are considered [13]. In addition, it was concluded that “without taking into account spatial effects, the values of the Okun’s coefficient for regional data are underestimated” [13, p. 30]. Econometric estimates of the Okun’s model were performed not only for Russia but also for other CIS countries, and calculations showed that the increase of the quarterly GDP growth rate by 1% is associated with the decrease in the unemployment rate in Russia by 0.06% in comparison with the previous quarter, in Ukraine – by 0.05%, in Belarus – by 0.0057%, and in Kazakhstan – by 0.0073 [17; 18].
The Okun’s coefficients for 1985–2013 from 20 OECD countries, which considered the impact of labor market institutions and demographic factors, are of the scientific interest. The results obtained indicate that the Okun’s coefficient differs for all studied age groups, and it decreases with increasing age [19]. Based on this, it was concluded that the stimulation of the economic growth will lead not only to the increase of the overall level of employment but also to a significant reduction of youth unemployment. The study considered time-varying equilibrium unemployment rates, and it was able to record changes in the value of the Okun’s coefficient over time [19]. The position of young people on the labor market of European countries during the “Great Recession” (2007–2009) and the role of institutions that determine cross-country differences are also studied by other scientists. Using the Okun’s model, the work [20] identified the features of shortterm relationships between the economic growth and indicators of the youth labor market. The only difference was that the key dependent variable was the employment level and not the unemployment level as in most works [20]. Another point of view is presented in the literature, according to which the “Okun’s Law is only an approximation to the actual ratio between the domestic output and unemployment, since it does not take into account the impact of other factors on the relationship of these variables” [21, p. 84]. The authors are convinced that, since the values of the Okun’s coefficient differ by country and vary from one period to another, they cannot be considered universal [21, p. 84].
Thus, summarizing different positions of scientists, we can conclude that the Okun’s Law is valid in most countries, including Russia. The theoretical assumptions and hypotheses of the Okun’s model explain important relationships between macro-parameters, but the estimates are sensitive to the characteristics of national labor markets, the nature and strength of economic shocks, and the choice of econometric models. Our research also shows the sensitivity of estimates to the phases of the business cycle.
Research methods and database
Models of the unemployment’s dependence on the business-cycle. The effect of the growth and decline of the output on the change of the unemployment is analyzed from the standpoint of the aggregate demand expansion which motivates the growth of the output, which in turn increases the demand for labor improving employment and reducing unemployment. At the same time, the decline in production reduces the demand for labor, reducing the level of employment and creating prerequisites for the unemployment increase. In other words, the “output-unemployment” relationship is inverse, and the regression coefficient always has a negative sign. As previously noted, the negative relationship between changes in output and the dynamics of the unemployment rate was described and empirically investigated by the American economist Arthur Okun (Okun,
1962). In order to understand the specifics of the operation of the Okun’s Law in the Russian economy and to assess the specifics of behavioral responses of labor market indicators to economic fluctuations, our study used a modified Okun’s model, which has been used by many scientists at various times [20].
Database. A panel sample was formed, and it includes 79 out of 85 Russian regions: data were obtained for 2000–2019. Indicators that characterize the labor market and changes in the economy of the autonomous okrugs (Nenets, Yamalo-Nenets, Khanty-Mansi) are considered in the corresponding regions of the country ( Tab. 1 ).
The Republic of Crimea and Sevastopol are not included due to the lack of data until 2014, and the Chechen Republic – due to the lack of data until 2007. The foundation of the information basis of the study was the data presented on the official Rosstat website, including, first, the unemployment numbers and its level measured by the methodology of the International Labor Organization (ILO)1, and, second, the gross regional product (GRP) and gross domestic product (GDP), which correspond to the system of national accounts (SNA)2. The studied period includes 2000– 2019 for annual data and 2010–2019 – for quarterly data. The dynamics of the gross domestic product (GDP) and gross regional product (GRP) were determined on the basis of physical output indices taken in annual and quarterly terms for the same periods as the unemployment rate. The change of the output was estimated based on the calculation of the chain growth indices. For annual data, the indices are obtained by multiplying quarterly values, and they show the growth rate of the output relative to the previous year. It should be considered that the Russian labor market is highly heterogeneous [22–24], interregional differences decrease during the crisis and increase within the economic growth.
Results of the research
Analysis of the relationship between changes of the output and unemployment . The analysis of empirical data for 2000–2019, reflecting economic fluctuations and related changes of the labor market, show a non-linear correlation and complex mutual impact of the unemployment and output. Figure 1 presents average annual output growth rates in comparison with unemployment fluctuations in Russia. It is clear that the intensity of these processes varies, and the spikes or declines of the output do not visually correlate with changes of the unemployment rate, which is characterized by a steady decline trend in the 2000–2007 and 2010–2019 periods with a slight increase that continued from the second half of 2014 to the first quarter of 2016.
Considering an accumulated dynamic for 2000–2019, it is noticeable that the economic growth (G) was accompanied by a gradual unemployment decrease (U). To reveal the cyclical dynamics of the unemployment rate and output, as well as to search for their interdependencies, quarterly details for 2010–2019 are considered. The following two graphs show the dynamics of the output and unemployment on different axes: the output growth rate scale is located on the left Y-axis, and the change in the unemployment rate is located on the right Y-axis.
As we see in figures 2 and 3 , extreme points in the output dynamics – growth and decline – accompany similar fluctuations in the unemployment rate. Often, there is no lag reflecting the unemployment delay, and the fluctuations fit into the same quarter. At the same time, starting from 2015, the increase of the
Table 1. Composition of the RF studied regions, unemployment level (U), output growth (G), 2019
|
Region |
U, % |
G, % |
Region |
U, % |
G, % |
|
Adygea |
8.2 |
73.5 |
Perm Krai |
5.2 |
78.2 |
|
Altai Krai |
5.9 |
93.4 |
Primorsky Krai |
5.2 |
97.9 |
|
Amur Oblast |
5.4 |
105.3 |
Pskov Oblast |
5.1 |
81.0 |
|
Arkhangelsk Oblast |
6.3 |
42.8 |
Altai Republic |
11.0 |
91.5 |
|
Astrakhan Oblast |
7.6 |
95.9 |
Republic of Bashkortostan |
4.4 |
84.6 |
|
Belgorod Oblast |
3.9 |
104.6 |
Republic of Buryatia |
9.2 |
60.9 |
|
Bryansk Oblast |
3.8 |
86.1 |
Republic of Dagestan |
13.0 |
116.1 |
|
Vladimir Oblast |
4.0 |
100.3 |
Republic of Ingushetia |
26.8 |
81.8 |
|
Volgograd Oblast |
5.3 |
73.9 |
Republic of Kalmykia |
9.2 |
75.0 |
|
Vologda Oblast |
4.5 |
97.9 |
Republic of Karelia |
7.5 |
109.6 |
|
Voronezh Oblast |
3.6 |
104.0 |
Komi Republic |
6.8 |
77.2 |
|
Jewish AO |
6.2 |
125.5 |
Mari El Republic |
4.6 |
97.9 |
|
Zabaykalsky Krai |
8.9 |
80.9 |
Republic of Mordovia |
4.2 |
137.6 |
|
Ivanovo Oblast |
3.8 |
90.4 |
Republic of Sakha |
7.2 |
106.3 |
|
Irkutsk Oblast |
6.6 |
83.3 |
Tyva Republic |
12.4 |
104.3 |
|
Kabardino-Balkaria |
10.8 |
91.9 |
Republic of Khakassia |
6.0 |
101.1 |
|
Kaliningrad Oblast |
4.5 |
114.6 |
Rostov Oblast |
4.8 |
60.5 |
|
Kaluga Oblast |
3.7 |
105.5 |
Republic of North Ossetia – Alania |
12.2 |
89.5 |
|
Kamchatka Krai |
3.8 |
67.3 |
Ryazan Oblast |
4.0 |
92.8 |
|
Karachay-Cherkess Republic |
11.8 |
84.4 |
Samara Oblast |
3.9 |
90.2 |
|
Kemerovo Oblast – Kuzbass |
5.5 |
91.8 |
Saint Petersburg |
1.4 |
115.9 |
|
Kirov Oblast |
4.8 |
96.0 |
Saratov Oblast |
4.4 |
84.1 |
|
Kostroma Oblast |
4.1 |
88.4 |
Sakhalin Oblast |
5.2 |
96.5 |
|
Krasnodar Krai |
4.8 |
98.9 |
Sverdlovsk Oblast |
4.2 |
95.5 |
|
Krasnoyarsk Krai |
4.5 |
91.0 |
Smolensk Oblast |
5.3 |
88.1 |
|
Kurgan Oblast |
7.8 |
54.9 |
Stavropol Krai |
4.9 |
94.2 |
|
Kursk Oblast |
4.0 |
99.5 |
Tambov Oblast |
3.9 |
123.3 |
|
Leningrad Oblast |
3.9 |
107.3 |
Tatarstan |
3.3 |
88.6 |
|
Lipetsk Oblast |
3.7 |
100.6 |
Tver Oblast |
4.0 |
83.2 |
|
Magadan Oblast |
4.6 |
118.6 |
Tomsk Oblast |
5.5 |
94.1 |
|
Moscow |
1.4 |
141.3 |
Tula Oblast |
3.8 |
104.7 |
|
Moscow Oblast |
2.7 |
129.6 |
Tyumen Oblast |
3.0 |
107.7 |
|
Murmansk Oblast |
5.5 |
93.6 |
Udmurt Republic |
4.3 |
76.7 |
|
Nizhny Novgorod Oblast |
4.1 |
78.9 |
Ulyanovsk Oblast |
3.8 |
75.8 |
|
Novgorod Oblast |
3.7 |
85.4 |
Khabarovsk Krai |
3.8 |
33.1 |
|
Novosibirsk Oblast |
6.1 |
111.8 |
Chelyabinsk Oblast |
5.1 |
88.1 |
|
Omsk Oblast |
6.5 |
109.2 |
Chuvash Republic |
4.7 |
94.4 |
|
Orenburg Oblast |
4.4 |
90.8 |
Chukotka AO |
3.8 |
97.2 |
|
Oryol Oblast |
5.4 |
99.5 |
Yaroslavl Oblast |
5.4 |
138.1 |
|
Penza Oblast |
4.3 |
||||
|
Source: Rosstat data. |
|||||
unemployment rate occurs not in the most acute phase of the output decline but earlier – in the previous quarter.
Assessments of the Okun’s model. Using the Okun’s Law which shows the negative connection between changes of the unemployі ment level and GDP growth rates, we compare the availability and strength of the labor market sensitivity to the business cycle [25]. There are several versions of the Okun’s model including dynamic ones [26]. We apply the modified Okun’s model for the analysis of the sensitivity
Figure 1. Average annual growth rate of the output (G) and unemployment level (U) calculated as the sample average, 2000–2019
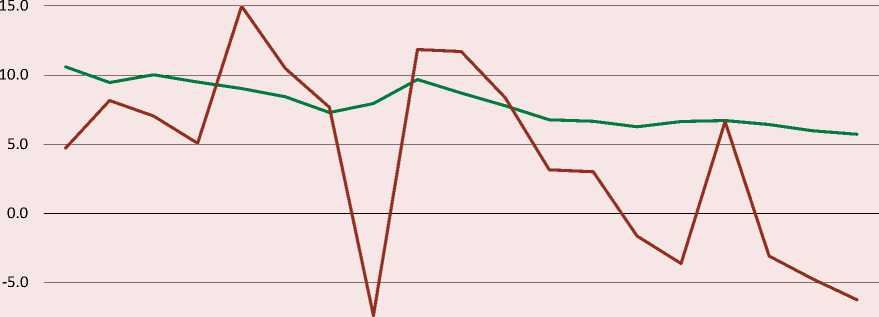
-10.0
2001 2002 2003 2004 2005 2006 2007 2008 2009 2010 2011 2012 2013 2014 2015 2016 2017 2018 2019
U ■ ^^^^^^^^^^^ G □
Source: Rosstat data.
Figure 2. Accumulated quarterly dynamics of the output growth rate (G) and the unemployment rate (U) on average for the sample, 2010–2019
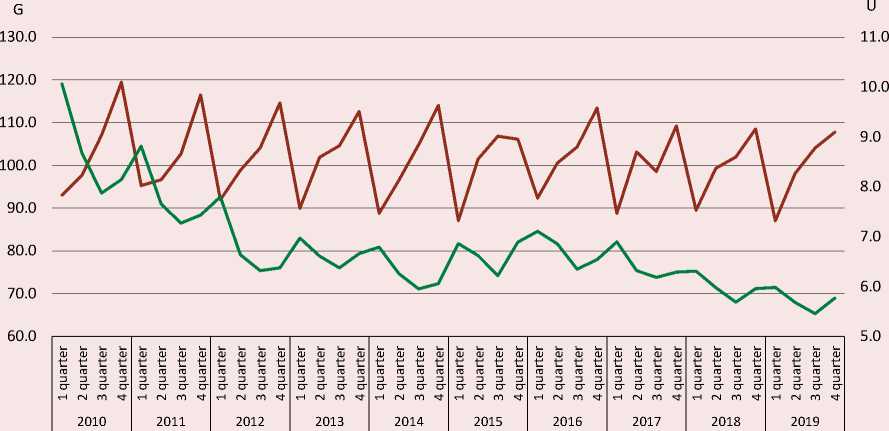
^^^^^^^^^^^ Average G ^^^^^^^^^^^ Average U
Source: Rosstat data.
Figure 3. Fluctuations of the unemployment level (dU) and the output growth rates (dG) by quarters, 2010–2019
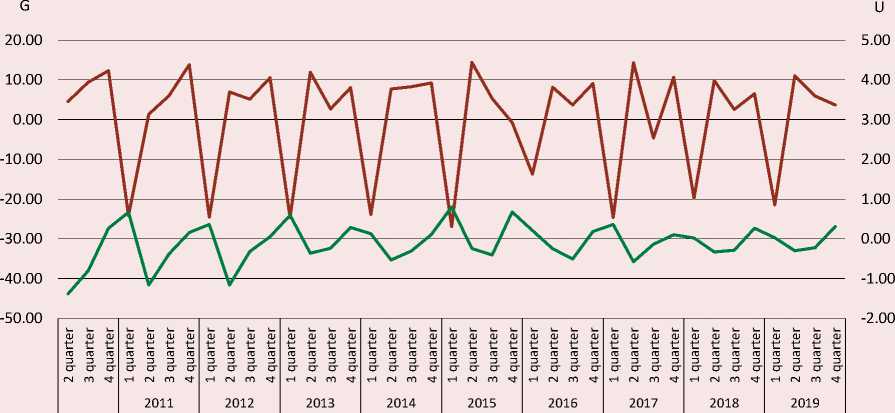
Average G Average U
Source: Rosstat data.
of the unemployment level to changes of the output growth rates in Russia using the sample with 79 regions.
ln(/ it ) = а + p\n(Git ) + e, (1)
where Uit – unemployment level in i region and t year, Git – output growth rate (chain index) in i region and t year; β i – the Okun’s coefficient, which must have a negative value, in other words, the output decline is accompanied by the unemployment rate increase; а – dimension parameter to be evaluated. We can assess this model using the ordinary least squares method (OLS).
In accordance with the tasks set, the model’s specifications for the country are evaluated using quarterly data in the medium-term period (2010–2019). The effects of the time and region are included in the model as dummy variables. This makes it possible to control the presence of global shocks common to all regions. We compared three models: one with fixed effects of regions (model 1); one with random effects of regions (model 2); one with fixed effects of periods (model 3). Panel regression was constructed using quarterly data (Tab. 2), a dependent variable is in the logarithmic form (InU).
Each studied model had a negative Okun’s coefficient, which proves an inverse relationship of the output growth and unemployment rate.
While choosing between models with fixed or random effects, we learned that Okun’s coefficients are relevant in both cases. However, the model with fixed effects of regions (model 1) has the highest determination coefficient, which is 0.819, and it is equal to 0.845 if we consider spatial effects of regions. The econometric assessment of the quality of model 2 with random effects shows low significance according to the Fisher’s criterion and the determination coefficient. The quality
Table 2. Results of the panel regression assessment with quarterly data, 2010–2019
|
Parameters |
Model 1 |
Model 2 |
Model 3 |
|||
|
Variables |
a |
lnG |
a |
lnG |
a |
lnG |
|
β coefficients |
2.021 |
–0.050 |
2.055 |
–0.058 |
2.108 |
–0.069 |
|
Standard errors |
0.067 |
0.015 |
0.097 |
0.018 |
0.162 |
0.033 |
|
t-statistics |
30.065 |
–3.440 |
21.125 |
–3.123 |
13.014 |
–2.055 |
|
p-values |
0.000 |
0.001 |
0.000 |
0.002 |
0.000 |
0.040 |
|
R2 (determination coefficients) |
0.819 |
0.003 |
0.090 |
|||
|
Corrected R2 |
0.815 |
0.003 |
0.079 |
|||
|
F-statistics |
213.06 |
9.75 |
7.74 |
|||
|
Weighted statistics |
0.845 |
– |
0.090 |
|||
|
Unweighted statistics |
0.819 |
– |
0.082 |
|||
|
Source: Rosstat data. |
||||||
assessment of model 3 is also unsatisfactory. The results of the Hausman specification test confirmed that, with any specifications, a model with fixed effects is preferable to a model with random effects.
The assessment of the panel regression model with fixed spatial effects and its specification are as follows:
lnU = 2,02 – 0,05lnG + [CX=F] . (2)
The value of the Okun’s coefficient, calculated by quarterly data, is about –0,05. Additionally, confidence intervals were assessed for the Okun’s coefficient with a different percentage of error probability in the model.
A relatively low value of the Okun’s coefficient could be explained by several reasons. First of all, it is necessary to consider that, along with the growth or decline of the output volumes, the behavior of all labor market indicators changes, which, having different degrees of sensitivity to shocks, adapt to the new economic situation. Thus, the output decline, in addition to rising unemployment, is accompanied by the uneven decrease of the employment level, changes in the labor force participation (economic activity), reduced working hours, delayed payment of wages, declining productivity and real incomes. Russian and foreign authors repeatedly noted that “during the periods when the output growth slows or declines, a mean number of man-hours worked decreases more sharply” [15, p. 474]. “Workweek duration” or “manhours worked” indicators are more sensitive to the output changes, and their response to a decline is non-linear. In terms of the sensitivity to economic shocks, real wages and a number of working hours outrun the behavioral responses of the unemployment and employment levels, reflecting a nonlinear response to shocks. The dependence, empirically proved by Okun, affects only the cyclical relationship between changes of output and unemployment (employment), the behavior of other labor market parameters in the mechanism of adjustment to economic shocks, and it forms scenario conditions. It is also important to emphasize the presence of informal employment and hidden unemployment, which mediate the impact of the output decline on changes in the unemployment rate, affecting the sensitivity of unemployment to economic fluctuations. As researchers note, “the existence of hidden unemployment, output, and employment in the shadow sector leads to distortions in the studied dependence of the GDP dynamics and unemployment rate” [15, p. 484]. However, the impact of the shadow economy, which has been less studied, is difficult to quantify due to the problems of measuring its contribution to the economic growth [18]. To eliminate quarterly fluctuations of the parameters and possible model distortions associated with them, a panel regression was constructed based on a generalized linear model (Generalized Linear Model) (Tab. 3).
Table 3 shows that the assessment of the Okun’s coefficient, conducted on the basis of the Generalized Linear Model (GLM), has a higher value (–0.105) than the one acquired before (–0.05). Both assessments are based on quarterly data (2010–2019). However, the GLM-model, first, smooths out quarterly fluctuations that affect the deviation of the data distribution form from the normal one, and, second, it does not take into account individual regional cross-effects. These differences in the estimation of the Okun’s coefficient are largely caused by the intra-annual cyclicity of quarterly data, which is smoothed out in the GLM-model. Thus, the estimate of the Okun’s coefficient (–0.105), presented in table 4, is more stable and free from disturbances associated with quarterly fluctuations in parameters during the year.
Let us move on to estimating the Okun’s coefficient for Russia for sub-periods of the economic decline and recovery growth using annual data.
Assessment of the Okun’s coefficient for individual sub-periods of the business cycle. Foreign literature describes asymmetric reactions of the unemployment rate to the economic decline and growth [11; 27– 29]. As a result of the econometric analysis, it was revealed that the sensitivity of the unemployment to decline is significantly higher than to the growth, as shown by the values of the Okun’s coefficient. In the Russian literature, contradictory assessments are given indicating the presence and absence of asymmetry in the adjustment of the unemployment rate to the decline and growth. In some works, the asymmetry of the adjustment of the unemployment rate to the growth and decline of the GDP is confirmed [15, 16], while it is refuted in others [13]. Adhering to the position of researchers who believe that the Okun’s coefficients significantly differ for positive and negative output growth rates, we disaggregated the studied period (2000–2019) into subperiods that include years of the decline and economic growth. Panel regressions are assessed with the least squares method (OLS), using annual data, and they show a significant mutual dependence between the unemployment rate and economic growth (decline) in each subperiod (Tab. 4).
Data of Table 4 prove that the models and the Okun’s coefficients are both significant. Assessments of the fixed-effects model show that, during the periods of the economic decline, the Okun’s coefficient reflects a stronger dependence of changes in the unemployment rate on the output decline than in the years of the growth. The Okun’s coefficient which reflects the dependence of the unemployment on the rate of change in the output during the economic decline is –0.167. At the same time, in the period of the post-crisis growth, there is a weaker sensitivity of the unemployment to economic fluctuations, and the Okun’s coefficient is –0.090. However, in both cases, the fixed effects of regional economies significantly affect the nature of the relationship between the unemployment and output.
Table 3. Parameters of the GLM-models with logarithms of variables, 2010–2019 (quarterly data)
|
Parameters |
β coefficients |
Stand. errors |
z-statistics |
Probabilities |
|
a |
2.274 |
0.197 |
11.560 |
0.000 |
|
lnG |
–0.105 |
0.043 |
–2.467 |
0.014 |
|
Mean dependent var |
1.79 |
S.D. dependent var |
4.71 |
|
|
Akaike info criterion |
15.14 |
Schwarz criterion |
15.15 |
|
|
Hannan-Quinn criter |
15.14 |
Pearson statistic |
22.07 |
|
|
Source: Rosstat data. |
||||
Table 4. Assessment of the Okun’s coefficient for sub-periods based on annual data from Russian regions, 2000–2019
|
Sub-periods |
Decline, G (–) |
Growth, G (+) |
|
a (fixed cross-effect of a region) |
1.059 |
1.607 |
|
β r egression coefficient |
–0.167 |
–0.090 |
|
Standard errors |
0.03 |
0.04 |
|
t-statistics |
–4.74 |
–2.26 |
|
P-significance |
0.00 |
0.02 |
|
Durbin-Watson statistics |
1.667 |
0.845 |
|
Determination coefficient (weighted statistics) |
0.857 |
0.758 |
|
F-statistics |
36.019 |
37.539 |
|
Determination coefficients (unweighted statistics) |
0.794 |
0.720 |
|
Source: Rosstat data. |
||
Discussion of the research results
The work theoretically justifies and empirically confirms the dependence of the “outputunemployment” relationship on the business cycle phase. On the basis of the Rosstat data for the sample, including 79 Russian regions, we conducted the quantitative assessment of the Okun’s coefficient values, which measures the cyclical reaction of the unemployment level to economic shocks. Studies revealed a lower value (by the module) of the Okun’s coefficient in the short-term period compared to the medium term. The 2000–2019 period was disaggregated, and years of the decline and economic growth were highlighted. The results of the econometric modeling showed that the negative dependence of the unemployment rate on output volumes exists in the studies period and selected sub-periods. However, assessments of the values of the Okun’s coefficient for subperiods show a stronger reaction (response) of the unemployment to the output decline than to the recovery growth. In other words, the “asymmetry effect” is confirmed, and it is explained by an absolute sensitivity of the unemployment to the phases of the business cycle, measured using the Okun’s coefficient.
The results obtained are consistent with the other authors’ data. Thus, analyzing the US economy, researchers revealed that the impact of changes in the output on the unemployment rate was the most significant during the economic decline [11; 12]. Evaluating the Okun’s coefficients for nine counties with the transition economy, the researchers determined that, in most countries, cyclical unemployment is more sensitive to the cyclical decline than to the growth [28]. The results showed that the most significant asymmetry is typical for the Czech Republic, Hungary, Latvia, and Russia [28]. In foreign literature, gender and age differences in the Okun’s coefficient are recorded, which are caused by a different sensitivity of labor market segments and socio-demographic groups to macroeconomic changes. Thus, the research results show that youth cohorts on the labor market show a stronger reaction to shocks, and, during a recession, they are more vulnerable on the labor market than older people [14]. The asymmetric behavioral response of the cyclical unemployment to the production decline and recovery growth is of particular interest to policy makers [14].
Conducted econometric assessments also confirm the dependence of the nature of the “output-unemployment” relationship on the business cycle phase, when, in the period of the decline and loss of jobs, the response of the unemployment level to economic fluctuations is more significant than during the recovery growth. It is important to note that there are conceptual differences in the interpretation of behavioral responses of the unemployment rate during the economic decline and recovery growth. Thus, if the response of the unemployment rate to the decline and job losses is strong, which is confirmed by high values of the Okun’s coefficient, then the assessment of the response to the recovery growth is insignificant due to the absence (or weak) cyclical response of the unemployment. A low cyclical sensitivity of the unemployment rate to the output growth rates in the first postcrisis years, when the output growth is not accompanied by job creation and increased employment, is explained by the nature of the recovery growth, its fundamental difference from the investment growth. The recovery growth is characterized by high rates, but it is a short-term and fading by its nature, and it does not create additional demand for labor and workers, because it is based on internal resources that remain “in reserve” after the economic downturn. As soon as internal sources are exhausted, the growth fades. Additional demand for workers is provided by the investment growth, when new jobs are created, employment increases, and unemployment decreases. In this regard, the stimulation of investments and creation of a favorable business climate are important components of the mechanism for creating new jobs. An equally important role for a balanced post-crisis growth is played by investments in human capital aimed at developing education, improving health, increasing life expectancy and the quality of life of people. Researchers rightly draw attention to the underestimation of the “human capital as the main factor in the development of the Russian economy at the present stage” [30, p. 57]. The scale of the expansion of demand for labor depends on the economic development model, the degree of the output renewal, the introduction of modern technologies, the volume and structure of investments in human capital.
The unemployment rate is influenced by factors not only from the demand side but also from the supply side of the labor market. Therefore, it should be considered that economic fluctuations explain only a part of the change in the unemployment rate. Other sources of change may be demographic, social, or institutional factors. In particular, shifts in the age structure of the population and the increase in a number of people of working age, which put demographic pressure on the labor market, increase the risks of rising unemployment. Labor migration has an impact on the labor market and fluctuations in the unemployment rate. Changes in the scale of informal employment, the effects of “desperate” and “additional” workers, the entry of people of the retirement age into the labor market, and other factors may have an impact on the unemployment rate which are not taken into account in the Okun’s model.
Conclusion
The authors conducted the modeling of the business cycle’s impact on the attitude of the national labor market of the Russian Federation. The methodology is based on a modified Okun’s model which shows the impact of the change in the output volumes on the dynamics of the unemployment level. The studied period is 2000–2019, and the specifications are evaluated using annual and quarter panel data. We conducted the statistical analysis of the “asymmetry effects” within the economic decline and recovery growth in Russia. The results of the econometric modeling showed that each studied model had a negative Okun’s coefficient, which corresponds to the theoretical content of the interaction between macro-economic parameters, reflecting the sensitivity of the unemployment level to changes of the economic growth rates. The Okun’s coefficients during the economic decline and growth were compared. The results of the econometric modeling showed that the Okun’s coefficient demonstrates a stronger cyclical reaction of the unemployment level (–0.167) during the economic decline than in the times of the recovery growth (–0.090). The reasons for the absence of the asymmetric cyclical response of the unemployment and its low sensitivity to the post-crisis economic growth, in our opinion, is in the recovery growth, which is based on the “internal reserves”, and it has a shortterm and fading nature. In other words, the recovery growth is not followed by the creation of jobs, employment increase; it is based on the existing and previously unused resources, and this process does not form an additional demand for the labor force. A growing demand for the labor and employees is caused by the investment increase which extends a number of jobs and the population’s employment, lowing the unemployment level. It is important to mention that specific features of regional economies significantly impact the nature of the interconnection between changes in the unemployment level and output dynamics. The following analysis of this research area may be related to the assessment of the impact of the economic recession on the unemployment level among various socio-demographic and gender groups in Russian regions. The most complicated research field may be the analysis of factors and reasons, defining differences of the Okun’s coefficient between countries and regions. Data obtained may be used for conducting the anti-crisis policy in the labor market during the economic recession.
References Assessment of the reaction of cyclical unemployment to the economic decline and recovery growth in Russia
- Okun A.M. Potential GNP: Its measurement and significance. Proceedings of the Business and Economic Statistics Section. American Statistical Association, 1962. Reprinted in Cowles Foundation, Yale University.
- Ball L., Leigh D., Loungani P. Okun’s law: Fit at fifty. NBER Working Paper, 2013, no. w18668.
- Özel H.A., Sezgin F.H., Topkaya Ö. Investigation of economic growth and unemployment relationship for G7 countries using panel regression analysis. International Journal of Business and Social Science, 2013, vol. 4 (6), pp. 163–171.
- Cazes S., Verick Sh., Hussami F.A. Why did unemployment respond so differently to the global financial crisis across countries? Insights from Okun’s law. IZA Journal of Labor Policy, 2013, vol. 2 (1), pp. 1–18.
- Kargi B. Okun’s law and long term co-integration analysis for OECD countries (1987–2012). International Research Journal of Finance and Economics, 2014, vol. 119, pp. 77–85.
- Kangasharju A., Tavera C., Nijkamp P. Regional growth and unemployment: The validity of Okun’s Law for the Finnish regions. Spatial Economic Analysis, 2012, vol. 7 (3), pp. 381–395.
- Habees M.A., Rumman M.A. The relationship between unemployment and economic growth in Jordan and some Arab countries. World Applied Sciences Journal, 2012, vol. 8 (5), pp. 673–680.
- Tombolo G., Hasegawa M. Okun’s law: Evidence for the Brazilian economy. The Economic Research Guardian, 2014, vol. 4 (1), pp. 2–12.
- Ball L., Furceri D., Leigh D., Loungani P. Does one law fit all? Cross-country evidence on Okun’s law. Open Economies Review, 2019, vol. 30 (5), pp. 841–874.
- Lee J. The robustness of Okun’s law: Evidence from OECD countries. Journal of Macroeconomics, 2000, vol. 22 (2), pp. 331–356.
- Silvapulle P., Imad A.M., Silvapulle M.J. Asymmetry in Okun’s law. Canadian Journal of Economics, 2004, vol. 37 (2), pp. 353–374.
- Owyang M., Sekhposyan T. Okun’s law over the business cycle: Was the great recession all that different? Federal Reserve Bank of St. Louis Review, 2012, vol. 94 (5), pp. 399–418.
- Vakulenko E.S. Analysis of the relationship between regional labour markets in Russia using Okun’s model. Prikladnaya ekonometrika=Applied Econometrics, 2015, no. 40 (4), pp. 28–48 (in Russian).
- Evans A. Okun coefficients and participation coefficients by age and gender. IZA Journal of Labor Economics, 2018, vol. 7 (5), pp. 1–22. DOI:10.1186/s40172-018-0065-8
- Akhundova O.V., Korovkin A.G., Korolev I.B. Vzaimosvyaz’ dinamiki VVP i bezrabotitsy: teoreticheskii i prakticheskii aspekt [The relationship between GDP dynamics and unemployment: Theoretical and practical aspects]. Academic works of the Institute of Economic Forecasting, RAS. Ed. by A.G. Korovkin. 2005. Pp. 471–497 (in Russian).
- Vakulenko E.S., Gurvich E.T. The relationship of GDP, unemployment rate and employment: In-depth analysis of Okun’s law for Russia. Voprosy ekonomiki=Voprosy Ekonomiki, 2015, no. 3, pp. 5–27. DOI:10.32609/0042-8736-2015-3-5-27 (in Russian).
- Ibragimov M., Ibragimov R. Unemployment and output dynamics in CIS countries: Okun’s law revisited. Applied Economics, 2017, vol. 49 (34), pp. 3453–3479.
- Ibragimov M., Karimov J., Permyakova E. Unemployment and output dynamics in CIS countries: Okun’s law revisited. EERC Working Paper Series, 2013, no.13/04.
- Dixon R., Lim G.C., van Ours J.C. Revisiting the Okun relationship. Applied Economics, 2017, vol. 49 (28), pp. 2749–2765. DOI: 10.1080/00036846.2016.1245846
- O’Higgins N. This time it’s different? Youth labour markets during ‘The Great Recession’. Comparative Economic Studies, 2012, vol. 54 (2), pp. 395–412. DOI:10.1057/ces.2012.15
- Promakhina I.M., Wang Lulu. Econometric analysis of interdependence between economic growth and unemployment in China (1978-2006). Vestnik RUDN, seriya Ekonomika=RUDN Journal of Economics, 2008, no. 3, pp. 82–94 (in Russian).
- Molodezhnyi rynok truda: otsenka i modelirovanie mezhregional’nykh razlichii [Youth Labor Market: Assessment and Modeling of Interregional Differences]. Moscow: «Universitetskaya kniga», 2016. 178 p.
- Blinova T., Markov V., Rusanovskiy V. Empirical study of spatial differentiation of youth unemployment in Russia. Acta Oeconomica, 2016, vol. 66 (3), pp. 507–526.
- Blinova T.V., Markov V.A., Rusanovskiy V.A. Interregional differences of the youth unemployment in Russia: Models of convergence. Ponte, 2017, vol. 73 (8), pp. 202–216.
- Boulhol H., Sicari P. Labour market performance by age groups: A focus on France. OECD Economics Department Working Papers, 2013, no. 1027.
- Knotek E.S. How useful is Okun’s law? Economic Review, Federal Reserve Bank of Kansas City, 2007, vol. 92(Q IV), pp. 73–103.
- Harris R., Silverstone B. Testing for asymmetry in Okun’s law: A cross-country comparison. Economics Bulletin, 2001, vol. 5 (2), pp. 1–13.
- Cevik E. I., Dibooglu S., Barisik S. Asymmetry in the unemployment–output relationship over the business cycle: Evidence from transition economies. Comparative Economic Studies. 2013, vol. 55, pp. 557–581.
- Boeri T., Jimeno J. F. Learning from the great divergence in unemployment in Europe during the crisis. Labour Economics, 2016, vol. 41, pp. 32–46. DOI:10.1016/j.labeco.2016.05.022
- Bazueva E.V., Radionova M.V. Econometric assessment of social indicators’ influence on the regional economic growth dynamics (case study of the subjects of the Volga Federal District). Ekonomicheskie i sotsial’nye peremeny: fakty, tendentsii, prognoz=Economic and Social Changes: Facts, Trends, Forecast, 2020, vol. 13, no. 2, pp. 56–70. DOI: 10.15838/ esc.2020.2.68.4 (in Russian).
