Associations between MRI signs of kidney parenchymal changes and biomarkers of renal dysfunction in resistant hypertension

Author: Ryumshina N.I., Zyubanova I.V., Sukhareva A.E., Manukyan M.A., Anfinogenova N.D., Gusakova A.M., Falkovskaya A. Yu., Ussov W. Yu.
Journal: Сибирский журнал клинической и экспериментальной медицины @cardiotomsk
Section: Клинические исследования
Article in issue: 1 т.37, 2022.
Free access
Objective. Resistant hypertension (RHT) is often associated with kidney injury and chronic kidney disease, especially in diabetic patients. Early detection of renal changes contributes to avoiding severe cardiovascular complications, but imaging characteristics of renal dysfunction in RHT remain unclear. The aim of the present study was to determine the relationships between the renal parenchyma volumes and biomarkers reflecting kidney function in a cohort of patients with RHT.Material and Methods. The study comprised 34 patients with RHT meeting the inclusion criteria. Evaluation of renal function was based on the measurements of estimated glomerular filtration rate (eGFR) and serum levels of creatinine and cystatin C. Renal sizes were assessed by MRI based on absolute and normalized parenchymal kidney volumes.Results. Primary MRI-based changes in renal parenchyma in patients with RHT demonstrated altered cortical surface, attenuated cortical thickness, lower renal volumes, and round shape of the kidneys compared with the reference characteristics. Positive correlation of moderate power was found between eGFR value and all parameters characterizing renal parenchyma. The strongest direct correlation was found between eGFR and bsa-TKV (r = 0.6166, p = 0.000); ht-TKV correlated with eGFR (r = 0.4751, p = 0.007) and creatinine (r = -0.4302, p = 0.016). According to linear regression analysis, ht-T-Cortex-V function show_abstract() { $('#abstract1').hide(); $('#abstract2').show(); $('#abstract_expand').hide(); }
Drug-resistant hypertension, renal dysfunction markers, magnetic resonance imaging, absolute renal volume, normalized renal volume, estimated glomerular filtration rate
Short address: https://sciup.org/149140020
IDR: 149140020 | UDC: 616.12-008.331.1-085.015.46-06:616.61
Ассоциации МРТ паренхиматозных изменений почек и биохимических показателей их дисфункции при резистентной артериальной гипертонии
Актуальность. Поскольку резистентная артериальная гипертония (РАГ) обычно сопровождается поражением почек, особенно при сочетании с сахарным диабетом 2-го типа (СД2), раннее выявление изменений в почках помогает избежать тяжелых сердечно-сосудистых осложнений. В связи с недостатком данных о визуальных маркерах почечной дисфункции при РАГ нашей целью было определить взаимосвязь между объемами почечной паренхимы и сывороточными маркерами, определяющими их функцию, у пациентов с РАГ.Материал и методы. 34 пациента соответствовали критериям включения и представляли исследуемую группу. Функцию почек оценивали по уровню сывороточного креатинина и цистатина-С, а также по расчетной скорости клубочковой фильтрации (рСКФ). Размер почек по данным МРТ определяли по абсолютному и индексированному объемам паренхимы.Результаты. Согласно данным МРТ, основными выявленными изменениями почечной паренхимы при РАГ оказались неровные бугристые контуры, истончение коркового слоя, уменьшение размеров почек, округлая форма; рСКФ имела прямую корреляцию средней мощности со всеми изученными параметрами почечной паренхимы. Наиболее сильная взаимосвязь была продемонстрирована индексом bsa-TKV (r = 0,6166; p = 0,000). Индекс ht-TKV показал связь с eGFR (r = 0,4751; p = 0,007) и с креатинином (r = -0,4302; p = 0,016). По нашим данным, индекс ht-T-Cortex-V function show_eabstract() { $('#eabstract1').hide(); $('#eabstract2').show(); $('#eabstract_expand').hide(); }
Text of the scientific article Associations between MRI signs of kidney parenchymal changes and biomarkers of renal dysfunction in resistant hypertension
True resistant hypertension (RHT) is a poorly studied nosological entity due to the difficulty in differentiating it from hypertension in patients who do not adhere to treatment [1]. Little is known about the causes, pathogenic mechanisms, patient characteristics, prognostic factors, and outcomes of RHT. The prevalence of RHT was reported to range from about 7% to nearly 27% in different populations of patients who receive treatment for hypertension [2]. Considering high prevalence of this condition, it is vital to improve knowledge regarding all aspects of RHT diagnosis and treatment.
Target organ study is pivotal for making correct diagnosis and providing proper treatment for RHT. Besides, damage to vital organs in RHT independently increases the risk of cardiovascular adverse events according to European Society of Cardiology’s risk estimation system. There is a similarity between the mechanisms causing the remodeling of the myocardium, blood vessel wall, and kidney parenchyma, all of which accelerate kidney and heart failure
[3]. Studies focusing on cerebral, cardiac, vascular, and renal assessments represent the core of establishing accurate diagnosis and providing adequate treatment to RHT patients. To assess kidney function, it is required to perform tests for uric acid, estimated glomerular filtration rate (eGFR), and urinary protein excretion [4]. Recent advances in imaging modalities allowed to achieve great success in assessing renal structure, morphology, perfusion, function, metabolism, and oxygen saturation [5]. Among renal instrumental diagnostic modalities, renal ultrasonography is recommended as the most straightforward imaging test that allows to look at the kidneys [6]. However, ultrasound remains limited in image resolution and quantitative assessment of renal parenchymal structure.
On the contrary, state-of-the-art magnetic resonance imaging (MRI) allows for both qualitative and quantitative examination of renal structure and function. Moreover, evidence suggests that structural changes in the kidneys occur earlier than altered serum markers of renal dysfunction [7]. Currently, the use of renal MRI is uncommon in RHT patients in everyday clinical practice. There are the gaps in our knowledge on the associations between altered renal parenchymal ultrastructure and kidney function. In this study, we aimed to determine the relationships between the renal parenchymal volumes and biomarkers reflecting kidney function in a group of RHT patients.
Material and Methods
A cross sectional observation study was performed in compliance with European standards for good clinical practice and Declaration of Helsinki. The protocol of the study was approved by the local Ethics Committee (protocol Nо. 134 from June 11, 2015). The recruitment of patients took place from November 2013 to October 2018. RHT diagnosis was established based to the guidelines generated by the European Society for Hypertension [4].
Inclusion criteria were age of 18–80 years, the presence of RHT, and both sexes. All participants provided signed informed consent while agreeing to participate in the study. Exclusion criteria were oncological diseases, inflammatory diseases, kidney trauma injury, and absolute and relative contraindications for MRI examinations.
MRI study was performed on base the Core Facility «Medical genomics», Tomsk NRMC.
The kidney MRI studies were performed using 1.5T magnetic resonance system (Titan Vantage, Toshiba Medical, 2010) using built-in and external 8-channel receive coil for the entire body. Scanning protocol involved coronary and axial T1 fat saturation (TR = 153 ms, TE = 4 ms) and T2 (TR = 7500 ms, TE = 91 ms) spin-echo sequences. The total volumes and the cortical and medullary volumes of each kidney were measured by ellipsoid approach (Figure 1) [8]:
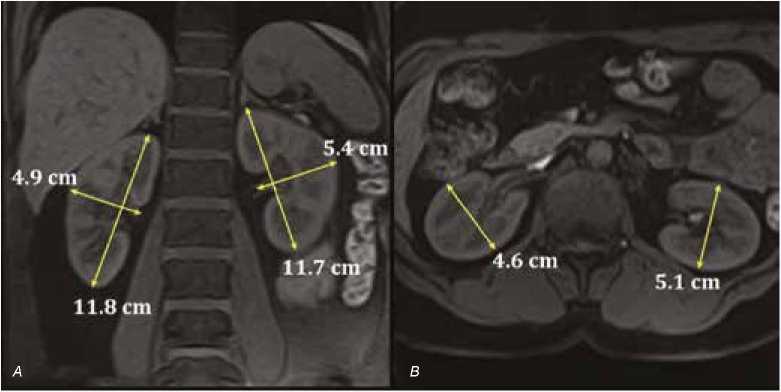
Fig. 1. Kidney MRI. A – frontal projection, T1SE fat saturation; B – axial projection, T1SE. Methods for measurements of linear kidney dimensions are shown Рис. 1. МРТ почек. А – коронарная проекция, В – аксиальная проекция, Т1 – спин-эхо изображение. Показана методика оценки линейных размеров почек
Considering that renal sizes depend on patient anthropometry features, the values of total overall, cortical, and medullary renal volumes (TKV, T-Cortex-V, and T-Medulla-V) were normalized by height (ht-TKV, ht-T-Cortex-V, and ht-T-Medulla-V), body surface area (BSA) (bsa-TKV, bsa-T-Cortex-V, and bsa-T-Medulla-V), and body mass index (BMI) (bmi-TKV, bmi-T-Cortex-V, and bmi-T-Medulla-V), respectively, as follows:
The eFilm 3.4 software (MergeHealth, 2010) was used to analyse images and measure the parameters of interest. Serum cystatin-C and creatinine concentrations were assessed to characterize renal excretory function. eGFR was determined according to equation recommended by Chronic Kidney Disease Epidemiology Collaboration. Office blood pressure was assessed according to routine methodology. Automatic oscilloscope monitors AVRM-04 (Meditech, Hungary) and BPLab (Peter Telegin LLC, Russia) were used to provide 24-hour blood pressure monitoring.
Data were processed with STATISTICA 10.0 software for Windows. Normality of distribution of variables was determined by the Shapiro-Wilk’s test. Data are presented as mean, standard deviation (M ± Sd), median (Me), and interquartile interval (Q1; Q3). Categorical variables are presented as absolute numbers and percentages (n and %). t-test was used to identify the differences between continuous variables in independent samples. Nonparametric Mann–Whitney test was used to identify the significance of differences of data lacking normal distribution. Multiple comparisons tests for three independent samples were performed based on the Kruskal–Wallis test. The Pearson correlation coefficient (rp) and univariate regression analysis allowed to assess the associations between the variables. Receiver operating curve (ROC) analysis was used to construct ROC curves and determine the cut off values of quantitative variables; area under the curve was calculated. Values were considered statistically significant when p was < 0.05.
Results
Clinical characteristics of patients
The study comprised a total of 34 patients aged 57.8 ± 8.4 years with the verified diagnosis of RHT. Known RHT duration was 21 [15; 35] years; 12 patients had stage II, and 22 patients had stage III hypertension; 26 patients had CKD G2 (eGFR ≤ 90 mL/min per 1.73 m2), and 5 patients had CKD G3 (eGFR < 60 mL/min per 1.73 m2); 41% patients had diabetes mellitus. Absolute and relative clinical characteristics and risk factors in patients of study group are given in Table 1.
Results of instrumental studies and biochemical renal tests are presented in Table 2.
Kidney volumes
MRI-based mean absolute and indexed renal parenchymal volumes are presented in Table 3.
The values of TKV significantly differed between men and women ( p = 0.002) (Table 4).
Table 1. Basic clinical characteristics of study patients. Qualitative data
Таблица 1. Основные клинические характеристики исследуемой группы пациентов. Качественные данные
|
Parameters / Параметры |
Total group of patients / Количество пациентов |
|
Gender (male/female), n (%) / Пол (мужской/женский), n (%) |
11 (32)/23 (68) |
|
Overweight, n (%) / Ожирение, n (%) |
9 (26) |
|
Class I obesity, n (%) / Первая степень, n (%) |
10 (29) |
|
Class II obesity, n (%) / Вторая степень, n (%) |
8 (24) |
|
Class III obesity, n (%) / Третья степень, n (%) |
7 (21) |
|
CKD, grade 1, n (%) / ХБП, 1-я стадия, n (%) |
8 (24) |
|
CKD, grade 2, n (%) / ХБП, 2-я стадия, n (%) |
21 (61.8) |
|
CKD, grade 3, n (%) / ХБП, 3-я стадия , n (%) |
5 (14.7) |
|
CAD, n (%) / ИБС, n (%) |
19 (56) |
|
Carotid atherosclerosis, n (%) / Атеросклероз сонных артерий, n (%) |
28 (82) |
|
Previous CVE, n (%) / Сосудистые события в анамнезе, n (%) |
7 (21) |
|
LV hypertrophy, n (%) / ГЛЖ, n (%) |
30 (88) |
|
Smokers, n (%) / Курильщики, n (%) |
4 (11.7) |
|
Dyslipidemia, n (%) / Дислипидемия, n (%) |
31 (91) |
|
Abdominal obesity, n (%) / Абдоминальное ожирение, n (%) |
29 (85.3) |
|
Type 2 diabetes mellitus, n (%) / СД2, n (%) |
14 (41) |
Note: CAD – coronary artery disease, CKD – chronic kidney disease, CVE – cerebrovascular events, LV – left ventricular. Data are expressed as numbers (percentages).
Примечание: ИБС – ишемическая болезнь сердца, ГЛЖ – гипертрофия левого желудочка, СД2 – сахарный диабет 2-го типа, ХБП – хроническая болезнь почек.
Table 2. Basic clinical characteristics of study patients. Qualitative data are presented as mean ± standard deviation or median ( Me ) and interquartile range ( Q 1; Q 3)
Таблица 2. Основные клинические характеристики исследуемой группы пациентов. Количественные данные представлены в виде среднее ± стандартное отклонение или медиана (Ме) и межквартильный интервал ( Q 1; Q 3)
|
Characteristics / Параметры |
Value / Значение |
|
Age, years / Возраст, лет |
57.8 ± 8.4 |
|
BMI, kg/m2 / ИМТ, кг/м2 |
34 ± 5.5 |
|
Waist circumference, cm / Окружность талии, см |
106.1 ± 13.2 |
|
Duration of hypertension, years / Длительность гипертонии, лет |
23 ± 11.6 |
|
Office SBP, mmHg / Офисное САД, мм рт. ст. |
164 (153; 182) |
|
Office DBP, mmHg / Офисное ДАД, мм рт. ст. |
92.7 ± 17 |
|
24-h ambulatory SBP, mmHg / САД по данным СМАД, мм рт. ст. |
158 (150; 167) |
|
24-h ambulatory DBP, mmHg / ДАД по данным СМАД, мм рт. ст. |
89 (76; 102) |
|
Creatinine, μmol/L / Креатинин, ммоль/л |
80.5 ± 14.3 |
|
eGFR, mL/min/1.73 m2 / рСКФ, мл/мин/ 1,73 м2 |
77.2 ± 15.2 |
|
Cystatin C, mg/L / Цистатин С, мг/л |
725.7 ± 202.1 |
|
Number of antihypertensive drugs / Количество антигипертензивных препаратов |
4 (3; 5) |
Note: BMI – body mass index, SBP – systolic blood pressure, DBP – diastolic blood pressure, SBP – systolic blood pressure, eGFR – estimated glomerular filtration rate.
Примечание: ДАД – диастолическое артериальное давление, ИМТ – индекс массы тела, САД – систолическое артериальное давление, СМАД – суточное мониторирование артериального давления, рСКФ – расчетная скорость клубочковой фильтрации.
Table 3. Indexed renal parenchymal volumes
Таблица 3. Индексированные объемы почечной паренхимы
|
Characteristics / Параметры |
Total volume, cm3 / Общий объем, см3 |
ht-indexed / индексация на рост |
bsi-indexed / индексация на ППТ |
bmi-indexed / индексация на ИМТ |
|
Kidneys / Почки |
365.8 ± 85.1 |
94.3 ± 16.98 |
182.95 ± 35.4 |
10.97 ± 3.2 |
|
Cortex / Корковое вещество |
122 (96; 161) |
32.8 (27.1; 40.3) |
67.5 ± 19.1 |
4.1 ± 1.5 |
|
Medulla / Мозговое вещество |
23.1 ± 52.4 |
60.1 ± 12.3 |
116.3 ± 24.0 |
6.95 ± 2.0 |
Note: ht – indexed by height, bsa – indexed by body surface area, bmi – indexed by BMI. Примечание: ИМТ – индекс массы тела, ППТ – площадь поверхности тела.
Table 4. Comparison of absolute and normalized renal volumes in men and women
Таблица 4. Сравнение абсолютных и индексированных объемов почек у мужчин и женщин
|
Characteristics / Параметры |
Females / Женщины |
Males / Мужчины |
p- value / значение p |
|
TKV |
333.1 ± 77.6 |
425.1 ± 66.1 |
0.002 |
|
ht-TKV |
94.9 ± 17.8 |
93 ± 15.9 |
0.7 |
|
bsa-TKV |
173.8 ± 33.2 |
202.1 ± 33.5 |
0.03 |
|
bmi-TKV |
9.5 ± 2.5 |
13.9 ± 2.6 |
0.000 |
|
T-Cortex-V |
118.5 ± 40.5 |
167.1 ± 31.7 |
0.001 |
|
ht-T-Cortex-V |
33.7 ± 9.9 |
36.5 ± 6.9 |
0.4 |
|
bsa-T-Cortex-V |
61.8 ± 18.4 |
79.4 ± 15.1 |
0.01 |
|
bmi-T-Cortex-V |
3.4 ± 1.2 |
5.5 ± 1.2 |
0.000 |
|
T-Medulla-V |
216.8 ± 50.6 |
257.8 ± 46.7 |
0.03 |
|
ht-T-Medulla-V |
61.83 ± 12.5 |
56.5 ± 11.5 |
0.2 |
|
bsa-T-Medulla-V |
113.3 ± 23.9 |
122.7 ± 24.0 |
0.2 |
|
bmi-T-Medulla-V |
6.2 ± 1.7 |
8.5 ± 1.8 |
0.001 |
Note. data are expressed as mean ± standard deviation. TKV – total kidney volume, ht-TKV – total kidney volume indexed by height, bsa-TKV – total kidney volume indexed by body surface area, bmi-TKV – total kidney volume indexed by body mass index, T-Cortex-V – total cortical volume, ht-T-Cortex-V – total cortical volume indexed by height, bsa-T-Cortex-V – total cortical volume indexed by body surface area, bmi-T-Cortex-V – total cortical volume indexed by body mass index, T-Medulla-V – total medullary volume, ht-T-Medulla-V – total medullary volume indexed by height, bsa-T-Medulla-V – total medullary volume indexed by body surface area, bmi-T-Medulla-V – total medullary volume indexed by body mass index.
Примечание: данные представлены в виде среднее ± стандартное отклонение. TKV – общий объем почек, ht-TKV – общий объем почек, индексированный на рост, bsa-TKV – общий объем почек, индексированный на площадь поверхности тела, bmi-TKV – общий объем почек, индексированный на индекс массы тела, T-Cortex-V – общий объем коркового вещества почек, ht-T-Cortex-V – общий объем коркового вещества почек, индексированный на рост, bsa-T-Cortex-V – общий объем коркового вещества почек, индексированный на площадь поверхности тела, bmi-T-Cortex-V – общий объем коркового вещества почек, индексированный на индекс массы тела, T-Medulla-V – общий объем мозгового вещества почек, ht-T-Medulla-V – общий объем мозгового вещества почек, индексированный на рост, bsa-T-Medulla-V – общий объем мозгового вещества почек, индексированный на площадь поверхности тела, bmi-T-Medulla-V – общий объем мозгового вещества почек, индексированный на индекс массы тела.
Patients were assigned to three groups based on eGFR: group 1 comprised patients with eGFR > 90 mL/min/1.73 m2; group 2 comprised patients with eGFR = 60–90 mL/min/ 1.73 m2; and group 3 comprised individuals with eGFR < 60 mL/min/1.73 m2. No differences between TKV values were found between groups ( p > 0.05). On the contrary, significant differences were found in ht-TKV values between the groups with normal renal function, reduced renal function, and stage
3 CKD. Data showed that the groups significantly differed in cortical volume. The lower the renal cortex index was, the lower the eGFR values was (Figure 2). A significant difference was seen in minimal renal cortical volume measured by T2 SE images.
Further correlation analysis was done to detect the associations between parenchymal volumes and renal function. ht-TKV was the most informative parameter (Table 5).
Table 5. Correlations of eGFR values and creatinine levels with indexed kidneys volumes
Таблица 5. Корреляции рСКФ и уровня сывороточного креатинина с индексированными объемами почек
|
Characteristics / Параметры |
eGFR / рСКФ |
p -value / уровень р |
Creatinine / Креатинин |
p -value / уровень р |
|
TKV |
0.5406 |
0.002 |
-0.1275 |
0.494 |
|
ht-TKV |
0.4751 |
0.007 |
-0.4302 |
0.016 |
|
bsa-TKV |
0.6166 |
0.000 |
-0.2843 |
0.121 |
|
bmi-TKV |
0.5838 |
0.001 |
-0.0852 |
0.648 |
|
T-Cortex-V |
0.4936 |
0.005 |
-0.1031 |
0.581 |
|
ht-T-Cortex-V |
0.4606 |
0.009 |
-0.3094 |
0.090 |
|
bsa-T-Cortex-V |
0.5401 |
0.002 |
-0.2028 |
0.274 |
|
bmi-T-Cortex-V |
0.5439 |
0.002 |
-0.0707 |
0.706 |
|
T-Medulla-V |
0.4809 |
0.006 |
-0.1282 |
0.492 |
|
ht-T-Medulla-V |
0.3456 |
0.057 |
-0.3998 |
0.026 |
Окончание табл. 5
End of table 5
|
Characteristics / Параметры |
eGFR / рСКФ |
p -value / уровень р |
Creatinine / Креатинин |
p -value / уровень р |
|
bsa-T-Medulla-V |
0.5244 |
0.002 |
-0.2843 |
0.121 |
|
bmi-T-Medulla-V |
0.5457 |
0.001 |
-0.0893 |
0.633 |
Note: TKV – total kidney volume, ht-TKV – total kidney volume indexed by height, bsa-TKV – total kidney volume indexed by body surface area, bmi-TKV – total kidney volume indexed by body mass index, T-Cortex-V – total cortical volume, ht-T-Cortex-V – total cortical volume indexed by height, bsa-T-Cortex-V – total cortical volume indexed by body surface area, bmi-T-Cortex-V – total cortical volume indexed by body mass index, T-Medulla-V – total medullary volume, ht-T-Medulla-V – total medullary volume indexed by height, bsa-T-Medulla-V – total medullary volume indexed by body surface area, bmi-T-Medul-la-V – total medullary volume indexed by body mass index, eGFR - estimating glomerular filtration rate.
Примечание: TKV – общий объем почек, ht-TKV – общий объем почек, индексированный на рост, bsa-TKV – общий объем почек, индексированный на площадь поверхности тела, bmi-TKV – общий объем почек, индексированный на индекс массы тела, T-Cortex-V – общий объем коркового вещества почек, ht-T-Cortex-V – общий объем коркового вещества почек, индексированный на рост, bsa-T-Cortex-V – общий объем коркового вещества почек индексированный на площадь поверхности тела, bmi-T-Cortex-V – общий объем коркового вещества почек, индексированный на индекс массы тела, T-Medulla-V – общий объем мозгового вещества почек, ht-T-Medulla-V – общий объем мозгового вещества почек, индексированный на рост, bsa-T-Medulla-V – общий объем мозгового вещества почек, индексированный на площадь поверхности тела, bmi-T-Medulla-V – общий объем мозгового вещества почек, индексированный на индекс массы тела, рСКФ – расчетная скорость клубочковой фильтрации.
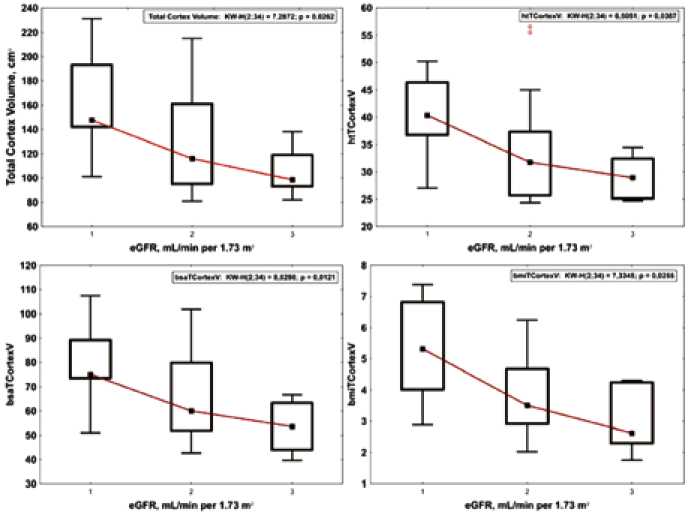
Fig. 2. Comparison of total cortical volume and its indexes among the three eGFR groups (Group 1, eGFR > 90 mL/min per 1.73 m2; Group 2, eGFR = 60– 90 mL/min per 1.73 m2; and Group 3, eGFR < 60 mL/min per 1.73 m2)
Рис. 2. Сравнение общего объема коркового вещества и его индексов в группах с разной функциональной активностью почек (1 – группа с рСКФ > 90 мл/мин/ 1,73 м2; 2 – группа с рСКФ = 60–90 мл/мин/ 1,73 м2; 3 – группа с рСКФ < 60 мл/мин/ 1,73 м2)
Moreover, being an essential indicator of preserved renal function, eGFR had positive relationships with almost all volumetric parameters. We observed a direct association of eGFR with renal parenchymal measurements.
Data of one-way regression analysis showed the linear relationships of eGFR and serum creatinine with TKV indexed by height (ht-TKV–eGFR: r 2 = 0.17, p = 0.013; ht-TKV–creatinine: r 2 = 0.16, p = 0.021) (Figure 3).
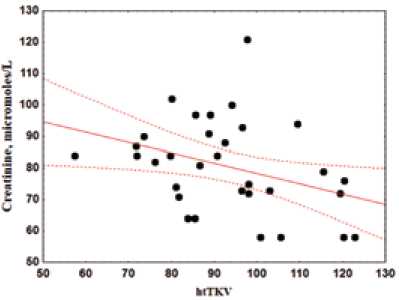
Fig. 3. Scatter diagram and regression line relationship of creatinine and ht-TKV index Рис. 3. Диаграмма рассеивания и регрессионная линия зависимости креатинина и общего объема почек, индексированного на рост
ROC analysis allowed to identify MRI marker of renal dysfunction in patients with eGFR below 60 mL/min/1.73 m2. The risk of developing CKD and RHT increased along with a decrease in renal parenchymal volume. ht-T-Cortex-V demonstrated the highest diagnostic value (Figure 4).
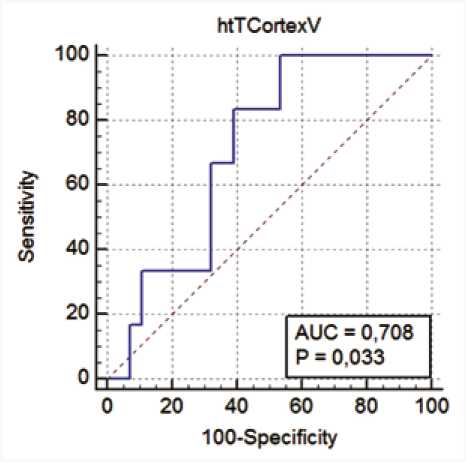
Fig. 4. ROC curve for the prediction of decrease in eGFR < 60 mL/min per 1.73 m2based on ht-T-Cortex-V for the entire study sample
Рис. 4. ROC-кривая, определяющая пороговое значение объема коры почек, индексированного на рост, при котором рСКФ < 60 мл/мин / 1,73 м2
The results of ROC analysis for other indices were calculated, but were less significant. ht-T-Cortex-V < 32.4 was an MRI marker of renal dysfunction with sensitivity of 83.3% and specificity of 60.7% ( p = 0.03) in patients with eGFR below 60 mL/min/1.73 m2.
In RHT patients with CKD and T2DM ( n = 4), the values of eGFR were below 60 mL/min/1.73 m2, i.e. corresponded to CKD grade 3 in the presence of mean ht-T-Cortex-V of 26.9.
Discussion
Our study allowed to identify MRI signs of renal changes characteristic of RHT and prove their clinical significance based on their correlational relationships with renal functional parameters.
We also detected the significant differences in the renal volumes and volumetric indexes depending on gender: the values were higher in men than in women except for the height-indexed values. The sex-related differences persisted when indexed by BMI and BSA, but not height. This observation agrees with the results of Framingham Heart Study, which provided reference TKV values of 415.2 and 322.2 cm3 for men and women, respectively [9]. Our results showed TKV values of 425.1 ± 66.1 см3 and 333.1 ± 77.5 см3 in men and women, respectively. No associations were found between renal volumes and age. Our data showed that eGFR significantly decreases along with a decrease in the renal volume. Similar results were obtained by Noda et al . when they compared the renal cortical volumes in groups assigned based on eGFR values [11].
Being a marker of renal dysfunction in RHT, ht-T-Cortex-V was involved in especially remarkable relationships, and we detected a threshold value of 32.4 cm3/m2.7, below witch we predicted a decrease in eGFR lower than 60 mL/min/1.73 m2.
Besides, we found the associations between ht-TKV and creatinine, whereas eGFR value showed correlations of varying degree with all absolute and normalized renal volumes. It does agree with the correlations between eGFR and ultrasonography-based kidney volumes [21].
To interpret obtained results, we would like to mention several pathophysiological processes occurring in the renal parenchyma in RHT and eventually resulting in fibrosis development. Indeed, evidence suggests that age-related micro-anatomical changes in the renal structure include a decrease in the number of functional glomeruli due to nephrosclerosis (arteriosclerosis, glomerulosclerosis, and ductal atrophy with interstitial fibrosis), increase in the number of extracellular matrix fibres, and, to a certain degree, a compensatory residual nephron hypertrophy. Low oxygenation of renal cortex due to chronic hypoxia in RHT contributes to renal function decline [12]. Moreover, comorbidity of T2DM and CHF accelerate the processes of renal fibrosis progression and, correspondingly, attenuate renal function. RHT coexists with T2DM [14] and CKD [15] in the third of patients whose kidneys become the main target organs. MRI signs of renal decline are seen significantly earlier in the presence of RHT concomitant with CKD and T2DM, and MRI approaches allow to assess both renal linear sizes and renal shape closely associated with patient age, body weight, and CKD burden [16].
According to expert opinion, diagnostic value of MRI is similar to that of kidney biopsy, which is considered the method of choice for detecting fibrosis. Modern MRI modalities such as diffusion-weighted imaging (DWI), visualization of the level of oxygenation (BOLD), and arterial spin marking (BOLD) allow high-accuracy quantification of the degree of renal fibrosis without radiation and contrast agent exposure to patient. T1-mapping is a vigorously studied and the most promising method for quantifying renal parenchyma fibrosis. The T1-weighted signal from the renal cortex is elevated in individuals with a decrease in eGFR and impaired corticomedullary differentiation [17]. Taking into account that CKD is a multifactorial disease, the integration of multiparametric MRI with accurate assessments of kidney perfusion, oxygenation, fibrosis severity, and biochemical tests can provide a reliable assessment of the stage of CKD and potentially predict the progression of the disease.
Approaches to measuring renal sizes are diverse. Perhaps, the elliptical approach to quantifying TKV may be the most reliable and easy to perform. In previous studies, TKV and ht-TKV were suggested to be informative renal markers in patients with renal pathology [19]. Our investigation demonstrated ht-T-Cortex-V as a potential MRI sign of renal dysfunction. ht-T-Cortex-V has a high diagnostic value as it is independent on gender and anthropometry while being valuable for evaluation of renal function.
T2DM and CKD aggravate adaptive hypertrophy of functional glomeruli in RHT patients and are associated with unfavourable global glomerulosclerosis and arteriolar hyalinosis [18]. Therefore, we pioneered suing MRI for both qualitative and quantitative studies of kidneys in patients with RHT. The convenience of proposed MRI-based method consists in easily achievable distinction between renal cortical and medullar layers without using contrast agents.
Direct associations found between MRI-assessed TKV and eGFR in our study are similar to the correlations between eGFR values and ultrasonography-based kidney volumetric parameters [21].
Study limitations
Renal function was assessed based on eGFR value calculated using the serum creatinine level whereas the use of inulin and some other markers of glomerular filtration are considered more precise. Our single-centre study included relatively small number of patients. Renal MRI and follow up examinations were performed by one experienced researcher.
Conclusions
Quantitative assessment of MRI metrics provides information essential for understanding renal changes in RHT. As a measure of renal function, eGFR is closely associated with height-indexed ht-TKV and ht-T-Cortex-V. Considering sex-independent strong relationship between ht-T-Cortex-V and renal function, we encourage other researchers to use this index in future research. Further identification of factors associated with the structural renal changes may contribute to the development of targeted therapy for RHT where renal denervation may be considered a therapeutic option. In this regard, the assessment of potential effects of renal denervation on the loss of renal parenchyma is warranted. Further studies are needed to test the hypothesis that abnormal renal filtration function in RHT is closely associated with the processes of renal tubulointerstitial fibrosis and decline in kidney cortical volume whose severity depends on the array of hemodynamic and non-hemodynamic factors including arterial blood pressure, hemodynamic load duration, chronic low-intensity inflammation, and metabolic abnormalities. Testing this hypothesis may involve the assessment of relationships of renal sizes, especially ht-T-Cortex-V, with arterial blood pressure, hypertension duration, T2DM, and biochemical parameters. Better understanding of renal changes in RHT pathophysiology is vital for improving clinical outcomes in this vulnerable category of patients. Based on obtained results, we encourage medical doctors to refer RHT patients for comprehensive MRI examinations in order to detect early signs of CKD, provide accurate diagnosis, and generate new scientific knowledge.
References Associations between MRI signs of kidney parenchymal changes and biomarkers of renal dysfunction in resistant hypertension
- Chiu N., Lauffenburger J.C., Franklin J.M., Choudhry N.K. Prevalence, predictors, and outcomes of both true- and pseudo-resistant hypertension in the action to control cardiovascular risk in diabetes trial: a cohort study. Hypertens. Res. 2021;4(11):1471-1482. DOI: 10.1038/s41440-021-00739-6.
- Sinnott S.J., Smeeth L., Williamson E., Douglas I.J. Trends for prevalence and incidence of resistant hypertension: population based cohort study in the UK 1995-2015. BMJ. 2017;358:j3984. DOI: 10.1136/bmj.j3984.
- Искендеров Б.Г. Кардиоренальный синдром у кардиологических больных. Пенза; 2013:160.
- Williams В., Mancia G., Spiering W., Agabiti Rosei E., Azizi M., Burni-er M. et al. 2018 ESC/ESH Guidelines for the management of arterial hypertension: The Task Force for the management of arterial hypertension of the European Society of Cardiology and the European Society of Hypertension: The Task Force for the management of arterial hypertension of the European Society of Cardiology and the European Society of Hypertension. J. Hypertens. 2018;36(10):1953-2041. DOI: 10.1097/ HJH.0000000000001940.
- Caroli A., Remuzzi A., Lerman L.O. Basic principles and new advances in kidney imaging. Kidney Int. 2021;1009(5):1001-1011. DOI: 10.1016/j. kint.2021.04.032.
- Чазова И.Е., Жернакова Ю.В. Клинические рекомендации. Диагностика и лечение артериальной гипертонии. Системные гипертензии. 2019;16(1):6-31. DOI: 10.26442/2075082X.2019.1.190179.
- Мельникова Л.В., Осипова Е.В. Поражение почек при эссенциальной артериальной гипертензии: патогенетические основы ранней диагностики. Артериальная гипертензия. 2019;25(1):6-13. DOI: 10.18705/1607-419X-2019-25-1-6-13.
- Рюмшина Н.И., Лукьяненок П.И., Мордовин В.Ф., Усов В.Ю. Использование антропометрической оценки почек и надпочечников методами МР-томографии для прогнозирования эффективности ренальной симпатической денервации почечных артерий у пациентов с медикаментозно-резистентной артериальной гипертонией. Медицинская визуализация. 2017;21(4):58-64. DOI: 10.24835/16070763-2017-4-58-64.
- Roseman D.A., Hwang S.J., Oyama-Manabe N., Chuang M.L., O'Donnell C.J., Manning W.J. et al. Clinical associations of total kidney volume: The Framingham Heart Study. Nephrol. Dial. Transplant. 2017;32(8):1344-1350. DOI: 10.1093/ndt/gfw237.
- Go A.S., Chertow G.M., Fan D., McCulloch C.E., Hsu C.Y. Chronic kidney disease and the risks of death, cardiovascular events, and hospitalization. N. Engl. J. Med. 2004;351(13):1296-1305. DOI: 10.1056/NEJ-Moa041031.
- Noda Y., Ito K., Kanki A., Tamada T., Yamamoto A., Kazuya Y. et al. Measurement of renal cortical thickness using noncontrast-enhanced steady-state free precession MRI with spatially selective inversion recovery pulse: Association with renal function. J. Magn. Reson. Imaging. 2015;41(6):1615-1621. DOI: 10.1002/jmri.24719.
- Zhou H., Yang M., Jiang Z., Ding J., Di J., Cui L. Renal hypoxia: An important prognostic marker in patients with chronic kidney disease. Am. J. Nephrol. 2018;48(1):46-55. DOI: 10.1159/000491551.
- Hommos M.S., Glassock R.J., Rule A.D. Structural and functional changes in human kidneys with healthy aging. J. Am. Soc. Nephrol. 2017;28(10):2838-2844. DOI: 10.1681/ASN.2017040421.
- Фальковская А.Ю., Мордовин В.Ф., Рюмшина Н.И., Пекарский С.Е., Рипп Т.М., Манукян М.А. и др. Влияние ренальной денервации на МРТ-признаки повреждения сосудистой стенки у больных резистентной артериальной гипертензией в сочетании с сахарным диабетом 2-го типа. Артериальная гипертензия. 2020;26(5):552-563. DOI: 10.18705/1607-419X-2020-26-5-552-563.
- Georgianos P.I., Agarwal R. Resistant hypertension in chronic kidney disease (CKD): Prevalence, treatment particularities, and research agenda. Curr. Hypertens. Rep. 2020;22(10):84. DOI: 10.1007/s11906-020-01081-x.
- Nakazato T., Ikehira H., Imasawa T. Determinants of renal shape in chronic kidney disease patients. Clin. Exp. Nephrol. 2016;20(5):748-756. DOI: 10.1007/s10157-015-1220-1.
- Jiang K., Ferguson C.M., Lerman L.O. Noninvasive assessment of renal fibrosis by magnetic resonance imaging and ultrasound techniques. Transl. Res. 2019;209:105-120. DOI: 10.1016/j.trsl.2019.02.009.
- Sasaki T., Tsuboi N., Okabayashi Y., Haruhara K., Kanzaki G., Koike K. et al. Synergistic impact of diabetes and hypertension on the progression and distribution of glomerular histopathological lesions. Am. J. Hypertens. 2019;32(10):900-908. DOI: 10.1093/ajh/hpz059.
- Müller A., Meier M. Assessment of renal volume with MRI: Experimental protocol. Method. Mol. Biol. 2021;2216:369-382. DOI: 10.1007/978-1-0716-0978-1_21.
- Matsuo M., Yamagishi F., Higuchi A. A pilot study of prediction of creatinine clearance by ellipsoid volumetry of kidney using noncontrast computed tomography. JMA J. 2019;2(1):60-66. DOI: 10.31662/jmaj.2018-0021.
- Korkmaz M., Aras B., Güneyli S., Yilmaz M. Clinical significance of renal cortical thickness in patients with chronic kidney disease. Ultrasonography. 2018;37(1):50-54. DOI: 10.14366/usg.17012.
- Wang X., Vrtiska T.J., Avula R.T., Walters L.R., Chakkera H.A., Kremers W.K. et al. Age, kidney function, and risk factors associate differently with cortical and medullary volumes of the kidney. Kidney Int. 2014;85(3):677-685. DOI: 10.1038/ki.2013.359.
- Bax L., van der Graaf Y., Rabelink A.J., Algra A., Beutler J.J., Mali W.P. et al. Influence of atherosclerosis on age-related changes in renal size and function. Eur. J. Clin. Invest. 2003;33(1):34-40. DOI: 10.1046/j.1365-2362.2003.01091.x.
