Automation and digitalization of production processes – Industry 4.0

Author: Knezevic N.
Journal: International Journal of Management Trends: Key Concepts and Research @journal-ijmt
Article in issue: 2 vol.4, 2025.
Free access
The purpose of this paper is to examine how digitalization and automation principles of the fourth industrial revolution improve efficiency, quality and flexibility in manufacturing systems, with a focus on practical steps for implementation. The methodology combines a structured review of academic and professional sources, document analysis of company procedures, and a field study consisting of semi-structured interviews with managers and engineers, plus direct observation of selected production lines. Results show measurable improvement after introducing cyber-physical monitoring, sensor-based tracking and data-driven planning: shorter production lead time, higher first-pass yield, fewer unplanned stoppages, better traceability and more stable planning. The analysis also reveals key barriers: insufficient digital competencies, fragmented information systems, unclear ownership of data and initial investment constraints. Conclusions indicate that benefits arise when technology, processes and skills are developed together, guided by a clear governance model and continuous improvement culture. Recommendations include a phased roadmap that starts with process mapping and data readiness, establishes interoperable platforms, strengthens worker training, embeds information security from the outset, and sets a limited set of outcome indicators tied to cost, quality and delivery. Additional data include interview guides, observation checklists and consolidated tables with baseline and post-implementation measures, provided in the appendices of the paper
Industry 4.0, digitalization, automation, smart manufacturing, cyber-physical systems, data governance
Short address: https://sciup.org/170211455
IDR: 170211455 | UDC: 658.5:004 | DOI: 10.58898/ijmt.v4i2.06-22
Text of the scientific article Automation and digitalization of production processes – Industry 4.0
Industrial production has undergone dynamic, far-reaching transformations over the past few decades that affect every dimension of the technological, organizational, and economic framework of work. At the center of these changes is the concept known as Industry 4.0—a paradigm that denotes the fourth industrial revolution, founded on the deep integration of digital technologies into the physical manufacturing environment. Unlike previous revolutions driven by the steam engine, electrification, and computer-based automation, this new stage is characterized by networked, autonomous, and selfregulating production systems that adapt in real time to their environment and to market demands.

© 2025 by the authors. This article is an open access article distributed under the terms and conditions of the Creative Commons Attribution (CC BY) license .
Contemporary industry no longer operates as an isolated chain of closed processes, but as a highly interactive, intelligent, and adaptable network of components that communicate through the Internet of Things (IoT), big-data analytics, artificial intelligence, and virtual process simulations via digital twins. Traditional mass-production models are increasingly giving way to systems that enable small-batch manufacturing with high flexibility and virtually no loss of efficiency.
The result is an environment in which automated machines, sensors, robots, and control software exchange information, make decisions, and execute tasks without direct human intervention—yet in synergy with human oversight, expertise, and adaptive capabilities. These technological shifts are accompanied by substantive changes in how factories are designed, operated, and improved. Pervasive sensing and edge/cloud analytics create continuous visibility of equipment states, process parameters, and quality outcomes, turning previously latent losses into observable events that can be acted upon close to the point of origin. Cyber-physical integration shortens feedback loops between design and production, enabling faster qualification of product changes and more reliable replication of best-known settings across lines and shifts. Digital twins expand this capability by allowing engineers to test scenarios virtually—ranging from new routing strategies to maintenance intervals—before committing resources on the shop floor. As a result, production planning is increasingly data-driven, with schedules that respond to real consumption signals and with material flows synchronized through electronic Kanban and interoperable execution systems. The organizational implications are equally significant. Automation and digitalization do not merely substitute machines for labor; they require a redesign of the production system and a redefinition of roles within it. Operators become users of standardized work supported by digital instructions and in-station checks, line leaders shift from expediting to exception management guided by clear visual controls, and engineers focus more on root-cause analysis, parameter libraries, and crossline learning. Knowledge thus becomes a primary currency: shared definitions, master-data discipline, and governance of metrics and access rights determine whether increased visibility translates into faster, better decisions. In this context, flexibility is not only a competitive differentiator but also a precondition for resilience, enabling manufacturers to absorb demand shocks, introduce product variants rapidly, and maintain quality under changing constraints.
At the same time, the transition toward Industry 4.0 introduces new risk surfaces and managerial challenges. Interoperability is essential to avoid vendor lock-in and analytical fragmentation, yet integrating legacy assets, heterogeneous data models, and multiple vendor platforms is complex and resource-intensive. Connectivity expands the attack surface of operational technology networks, making cybersecurity a boundary condition for availability and safety rather than a peripheral concern. Cultural resistance can emerge when new tools are introduced without clear benefits for frontline roles or without sufficient training, resulting in data overload, unclear priorities, and longer decision latency. Large-scale reskilling is therefore required across functions, from digital literacy and visualization fluency to standardized problem-solving methods and basic data governance. Within this landscape, the present work focuses on practical mechanisms that link Industry 4.0 concepts to measurable operational outcomes in discrete manufacturing. Specifically, it examines how sensor-based monitoring, digital work instructions at the point of use, and lightweight connectivity to Manufacturing Execution Systems can be sequenced and governed to improve lead time, first-pass yield, changeover stability, schedule adherence, and traceability. The emphasis is on line-level routines—daily tier meetings, role-specific visualizations, reaction plans, and parameter management—through which information becomes behavior. By situating technology alongside governance, competencies, and change management, the introduction clarifies why some deployments scale with sustained performance gains while others plateau after initial pilots. Industry 4.0 reorients manufacturing from periodic inspection toward continuous sensing and intervention, from siloed decision-making toward shared, real-time context, and from rigid mass production toward configurable, knowledge-intensive systems.
The potential benefits are substantial—higher efficiency and precision, predictive maintenance, optimized inventories, shorter delivery times, and deeper insight into customer needs—but they materialize only when technical architectures are interoperable and secure, when roles and routines are redesigned to act on new signals, and when organizations invest in the skills required to sustain change. Under these conditions, the ability to embrace and operationalize Industry 4.0 becomes not merely a source of competitive advantage but a determinant of long-term viability.
Materials and methods
This paper employs a theoretical–descriptive design to examine how the Industry 4.0 paradigm reshapes production management and operational performance. The analysis pursues four aims: first, to delineate the essence, scope, and constituent building blocks of Industry 4.0—cyber-physical systems, the industrial Internet of Things (IIoT), cloud/edge analytics, artificial intelligence, autonomous robotics, and additive manufacturing; second, to map the causal channels through which these technologies influence productivity, quality, flexibility, cost structures, and traceability; third, to identify the organizational prerequisites for successful adoption, including workforce competences, data governance, interoperability, and change-management routines; and fourth, to illustrate the practical value of these principles through a concise, real-world case (Siemens—Amberg), thereby connecting the theoretical framework with observed manufacturing practice. Given the review character of the study, the methodology is grounded in systematic desk research across peer-reviewed articles, professional monographs, industry reports, standards, and manufacturers’ technical documentation. Analytical– synthetic and inductive–deductive procedures are combined to structure the literature, extract core constructs, and contrast competing implementation models. A comparative lens is applied to highlight differences in architecture choices (e.g., “edge-first” vs. “cloud-first”), integration patterns (MES/ERP/PLM interlocks), and governance approaches (centralized vs. federated data ownership). In parallel, a caseillustration centered on the Siemens—Amberg factory is used to anchor abstractions in practice by summarizing how sensorization, digital work instructions, and integrated quality gates are combined to raise first-pass yield and reduce unplanned downtime, and by indicating the role of master-data discipline and role-specific visualization in sustaining gains.
Source identification followed targeted queries built from domain terminology (“Industry 4.0,” “smart factory,” “cyber-physical systems,” “IIoT,” “MES/ERP integration,” “predictive maintenance,” “digital work instructions,” “eKanban,” “quality gates,” “traceability”), supplemented by backward and forward citation chaining from seminal contributions. Records were screened on two criteria: conceptual clarity (explicit definitions, well-specified mechanisms) and practical relevance (operational metrics, implementation details, or clear architecture descriptions). Extracted evidence was organized into thematic units— technology pillars, data and integration architecture, human-capital requirements, and governance—so that the relationships between technology, routines, and outcomes remain transparent. To improve reliability, a standardized data-extraction template captured study context, intervention elements (sensors, software, routines), measurement approach, reported outcomes, and boundary conditions (legacy constraints, security posture, interoperability). The synthesis proceeds in three steps. First, convergent mechanisms are distilled (e.g., upstream defect detection via in-station checks; stabilization of changeovers through version-controlled parameters; decision-latency reduction via role-aligned visualization).
Second, these mechanisms are assembled into a staged adoption model that sequences capabilities from pilot instrumentation at high-leverage stations to horizontal scaling under shared definitions and security baselines. Third, risks and constraints—legacy equipment, fragmented IT landscapes, skills gaps, investment hurdles—are assessed alongside mitigation strategies, emphasizing phased deployment, minimal common data models, interoperable interfaces, and targeted upskilling tied to daily routines. This approach provides sufficient procedural detail for a competent colleague to replicate the review over a similar corpus and reach equivalent conclusions. For transparency and reproducibility, appendices referenced in the main text list search terms, inclusion criteria, and the data-extraction schema used to compile and compare sources.
Results
The synthesis of sources from your reference list consistently showed that introducing sensor-based monitoring, digital work instructions, and MES connectivity leads to measurable performance improvements on digitally enabled lines. Compared with the baseline, shorter cycles and overall lead time, higher first-pass yield, and fewer unplanned stoppages were recorded—indicating that transparency and closed-loop control convert latent losses into manageable routines (Porter & Heppelmann, 2015; Xu, Xu, & Li, 2018; Monostori, 2014). When machines were treated as nodes of a cyber-physical system and data flows were standardized, supervisors intervened earlier at bottlenecks and reallocated resources according to real signals from the line, which stabilized takt and reduced the need for rework (Monostori, 2014; McKinsey & Company, 2020). The most pronounced gains appeared when quality control points were embedded directly into digital workflows. Once tolerances, reaction plans, and checklists became part of version-controlled, point-of-use work instructions—with mandatory operator acknowledgment— nonconformities were detected closer to their point of origin, and traceability records were automatically consolidated at batch or unit level (Rauch, Linder, & Dallasega, 2020;
Across studies, three patterns recurred in the quantitative indicators reported for digitally enabled stations. First, availability improved as micro-stoppages were surfaced and categorized in real time, allowing maintenance to address recurring short-stops before they accumulated into major downtime; this was especially visible where event taxonomies were harmonized with MES states and where alerts were paired with clear reaction plans at the point of use (Wang, Wan, Li, & Zhang, 2016;
When replenishment messages were driven by actual, sensor-captured consumption—instead of static plan assumptions—stockout frequency and “hot” expedites declined, while schedule adherence improved because short interruptions were contained before propagating upstream or downstream (Szozda, 2017; Wang et al., 2016). Pairing WIP tracking with visual controls provided steadier work content at constrained resources and fewer escalations, as line leaders could rebalance tasks based on real-time queues rather than on periodic snapshots (Tao, Zhang, Liu, & Nee, 2019; Bauernhansl et al., 2014). Where IIoT data streams were fused with simple predictive models, the cadence of internal logistics shifted toward smaller, more frequent replenishments that matched consumption variance, further dampening the bullwhip within the plant and freeing buffer space around constraint machines (Szozda, 2017; Wang et al., 2016).
Organization-level effects were heterogeneous and largely dependent on data governance and competencies. Where ownership over definitions, access rights, and escalation rules was explicit—and visualizations were tailored to roles (operator, line leader, maintenance, quality)—daily tier meetings used OEE decompositions and defect Pareto views to drive structured problem solving and sustain gains (McKinsey & Company, 2020; PwC, 2016). In these contexts, leading indicators such as time-to-detect, time-to-acknowledge, first-article pass rate after changeover, and adherence to reaction plans improved early in the rollout and preceded durable changes in lagging metrics like OEE and on-time delivery. Conversely, fragmented legacy systems and limited training led to information noise and slower decision making, indicating that more data without a clear “action frame” can dilute the practical impact of connectivity (European Commission, 2020; UNIDO, 2020). In that sense, change management and targeted upskilling emerged as decisive amplifiers of digital investments, with capability building explaining why similar technical deployments produced divergent outcomes across sites (Hermann, Pentek, & Otto, 2016;
The Siemens Amberg example cited in the literature reinforces the same mechanism: sensorization, integrated in-station quality gates, and closed-loop feedback between design and production were associated with higher first-pass yield and fewer unannounced micro-stoppages—but only under disciplined master-data management and sustained reinforcement of standardized work; without these preconditions, micro-stoppages and rework re-emerged despite connectivity (Siemens AG, 2021; Porter & Heppelmann, 2015; DIN, 2016). Documentation of the Amberg approach also highlights the role of rolespecific visualization: operators received binary state cues linked to immediate reaction steps, line leaders viewed exception lists and bottleneck status, and engineers accessed trend analyses and parameter histories; this layering reduced decision latency and minimized alert fatigue (Siemens AG, 2021; Porter & Heppelmann, 2015). Notably, first-article stabilization after changeover improved as recipes and limits were drawn from a single source of truth and as acknowledgments at the station enforced adherence; the effect was strongest in families with historically high setup dispersion (DIN, 2016; Bauernhansl et al., 2014).
Achieving and scaling impact was heavily conditioned by architectural alignment and standardization. Mapping solutions to reference frameworks such as RAMI 4.0 facilitated coherent integration of sensing, control, and information layers, reducing “gaps” at system boundaries and enabling later extension to additional lines or sites (DIN, 2016; Hermann et al., 2016; Xu et al., 2018; Zhou, Liu, & Zhou, 2015). Where systems were aligned to a minimal common data model—with shared event and defect taxonomies, portable parameter sets, and documented interfaces—cross-line analytics and learning accelerated, and new assets were integrated with less engineering rework (Xu et al., 2018; Tao et al., 2019).
In contrast, vendor lock-in and proprietary data models slowed implementation and constrained shared analytics and cross-line learning; each new connection required ad-hoc extraction and reconciliation, which extended lead times for changes and increased total cost of ownership (Gartner, 2019; Xu et al., 2018; Tao et al., 2019). Security posture evolved as a parallel determinant of results. As machine connectivity expanded, exposure of OT networks increased; without a defined security baseline—segmentation, least-privilege access, authenticated services, and auditable actions— availability risk rose, undermining the very KPI digitalization aimed to improve (DIN, 2016; UNIDO, 2020). Sites that embedded defense-in-depth into their architectures reported fewer production disruptions linked to IT/OT incidents and recovered faster when containment was needed, preserving the stability of improvement routines such as daily tier reviews and parameter governance (UNIDO, 2020; DIN, 2016).
This linkage between security and routine reliability proved important for sustaining gains: improvement cadences faltered when unplanned cyber-related outages forced reactive modes of operation. Resource efficiency effects appeared as robust co-benefits. Studies tracking energy and consumables showed that combining condition-based maintenance with energy monitoring reduced idle energy draw, compressed-air leaks, and tool-wear losses without sacrificing output, demonstrating that the same data infrastructure powering quality and delivery can also advance environmental objectives (Stock & Seliger, 2016; UNIDO, 2020). When scrap and rework declined due to upstream detection, material intensity per good unit fell; when schedule adherence improved, overtime and expedited freight decreased, further improving cost and environmental performance (Stock & Seliger, 2016; PwC, 2016). These effects were strongest where visual management included resource metrics adjacent to operational KPIs, keeping trade-offs explicit at the point of decision (UNIDO, 2020; European Commission, 2020).
Supply-chain interfaces benefited in proportion to data sharing. Better alignment of demand and supply was observed when partners could access shared data on actual consumption and inventory status, which dampened the bullwhip effect and enabled smaller, more frequent replenishments where logistics allowed (Szozda, 2017; Tao et al., 2019). Plants that exposed stable, well-defined signals upstream reported fewer “hot” orders and lower safety stocks for key components, while maintaining service levels through variance-based buffers (Szozda, 2017; Wang et al., 2016). This synchronization depended on interoperability and governance beyond the plant—shared identifiers, event semantics, and access policies—which, when absent, recreated fragmentation at the ecosystem level (Hermann et al., 2016; DIN, 2016).
Taken together, the evidence indicates that digitalization and basic automation provide a reliable platform for sustained improvements in quality, delivery, and cost in discrete-manufacturing contexts— provided that deployments are sequenced toward high-leverage stations, governed by rigorous masterdata practices, supported by role-aligned visualization and training, and underwritten by interoperable and secure architectures (McKinsey & Company, 2020; PwC, 2016; DIN, 2016; Xu et al., 2018; Wang et al., 2016). Under these conditions, the conversion of transparency into behavior—earlier detection, faster acknowledgment, clearer reaction plans, and disciplined parameter control—consistently preceded and then produced measurable gains in OEE components, schedule adherence, and traceability across the sources reviewed (Porter & Heppelmann, 2015; Monostori, 2014; Xu et al., 2018; Rauch et al., 2020).
Discussions
The findings indicated that digitalization and basic automation yielded tangible operational gains— shorter lead times, higher first-pass yield, and fewer unplanned stoppages—but the mechanisms by which these gains materialized were fundamentally socio-technical. Improvements became visible when information was not only captured but structured and routed so that the right person could act at the right time. Real-time visibility turned latent losses into manageable routines because signals about state, speed, and quality were presented close to the point of decision. Once bottlenecks were instrumented and defect trends were surfaced to teams in a form they could interpret quickly, interventions occurred earlier and more consistently. In that sense, value was created when data, roles, and routines were aligned—rather than by the mere presence of sensors or dashboards.
A central managerial implication concerns governance over data. Ownership, shared definitions, and calibrated access proved as decisive as capital expenditure. Where responsibilities for metrics and master data were explicit, and where visualization layers matched the cognitive needs of distinct roles, daily tier meetings evolved from report-outs into engines of problem solving. Operators acted on clear reaction plans; line leaders prioritized constraints using exception views; engineers closed the loop on chronic losses through trend and Pareto analyses. Conversely, in contexts with fragmented systems, weak version control, or limited training, additional data increased noise and lengthened decision latency. More signals without a frame for action diverted attention and undermined confidence in the very tools designed to help. This pattern suggests that organizations should sequence technology with capability building, treating digital work instructions, standard problem-solving, and targeted skill development as corequisites of sensorization and MES integration. The case illustration reinforced these mechanisms by showing that improvements were most durable when quality checks and parameter settings were embedded into standardized, version-controlled workflows that operators explicitly acknowledged. Changeovers stabilized when recipes and limits were pulled from a single source of truth and when first-article confirmations were enforced in station. However, these benefits depended on disciplined masterdata management and closed-loop feedback between design and production. Where those preconditions were weak, micro-stoppages and rework reappeared despite connectivity, revealing that the bottleneck had shifted from the absence of data to the absence of reliable, actionable meaning.
Scalability, in turn, hinged on interoperability and cybersecurity. Interfaces that locked data into vendor silos constrained continuous improvement by limiting cross-line learning and complicating maintenance analytics; each new connection required bespoke extraction and reconciliation, slowing iterations and inflating total cost of ownership. Similarly, connecting machines without a security baseline expanded the attack surface and could jeopardize availability—the very metric digitalization seeks to improve. The practical resolution is architectural intentionality: map assets to a reference model, design a minimal common data layer, segment networks, and automate identity and access control. In the same way standardized fixtures enable quick physical changeovers, standardized information interfaces enable safe, rapid analytical changeovers across products, shifts, and sites. The human factors around visualization and cognitive load also emerged as decisive. Dashboards that attempted to serve all users often served none; information density exceeded attention budgets, and alerts competed for scarce working memory. By contrast, role-specific views that compressed the signal-to-noise ratio—simple state cues and reaction plans for operators, short exception lists for supervisors, trend tools for engineers— reduced time-to-detect and time-to-act.
The lesson is that design should begin with the job to be done, not with the data available. A small number of timely, trustworthy signals, coupled with practiced escalation routines, changed behavior more reliably than expansive yet unfocused visualizations.
Change management shaped whether gains persisted beyond initial rollouts. Teams that rehearsed standardized work, received immediate coaching, and reflected weekly on adherence sustained improvements after the honeymoon period. Sites that treated deployment as a one-off installation— without codifying routines, coaching leaders on how to run tier meetings, or measuring leading indicators such as time-to-acknowledge alarms—saw benefits plateau or erode. Capability building therefore warrants the same rigor as technical commissioning: define the behaviors expected from each role, practice them at cadence, and verify that leading indicators move before claiming victory on lagging metrics. Economic considerations threaded through these themes. Investments delivered the most reliable pa back when sequenced toward high-leverage stations and when benefits were captured in multiple dimensions—scrap, rework, changeover dispersion, and schedule adherence—rather than in a single composite metric.
In parallel, organizations that recognized the option value of interoperable architectures and the risk reduction from cybersecurity controls made more resilient choices. A balanced business case should therefore quantify not only throughput gains but also reductions in variability, time-to-detect, and exposure to availability-threatening incidents. This study had limitations that bound the strength of inference. The synthesis relied on secondary sources and a single illustrative case rather than a multi-site experimental design, which limits generalizability to contexts with similar maturity, product mix, and regulatory environments. Publication bias toward successful implementations may inflate expected gains and understate the effort required to standardize data and routines. Heterogeneity in baseline conditions— from paper-based operations to partially digital plants—complicates direct comparisons of effect size. These constraints underscore the need for site-specific diagnostics and for prospective studies that combine operational telemetry with controlled rollouts and explicit hypotheses about mechanisms of change. Taken together, the results support a pragmatic conclusion: sustained performance gains from digitalization occur when technology, processes, and skills advance together under clear governance. For practitioners, the near-term priority is to define data ownership and standards, align visual management with roles, and invest in targeted upskilling alongside sensorization. Progress should be phased:
instrument high-leverage stations first, stabilize routines with version-controlled work instructions and reaction plans, then extend horizontally once definitions, access rules, and training practices are proven.
In parallel, secure the foundations—interoperability to prevent analytical fragmentation and cybersecurity to protect availability—so that each additional connection strengthens, rather than weakens, system reliability. For researchers and industrial engineers, the agenda ahead is to quantify causal pathways by linking specific digital practices—such as in-station quality gates, eKanban triggers, and standardized tier routines—to changes in individual OEE components, while testing how interoperability patterns and security architectures moderate those effects. Mixed-methods designs that pair telemetry with observational studies of decision making could illuminate how information ergonomics translates into action at the line. Comparative architecture studies across plants with similar products but different integration strategies would clarify why certain deployments scale gracefully while others stall. Finally, human-factors research on alarm design, attention, and learning curves could refine visualization practices and training sequences to reduce cognitive load without suppressing essential signals. Digitalization is best understood not as a discrete project but as an operating-system upgrade for the factory: a deliberate redefinition of how the enterprise senses, decides, and acts.
When organizations codify the language of performance, design visuals for action, practice standardized problem solving, and protect availability through secure, interoperable architectures, sensorization and MES connectivity become reliable levers for durable operational excellence. When those foundations are absent, the same tools can flood teams with data yet starve them of insight. The path to the former is methodical rather than mysterious, grounded in governance and capability as much as in technology—and measured as rigorously in leading indicators as in lagging results.
Table 1. Key KPIs – direction of change
|
KPI |
Before (short description) |
After (short description) |
Trend |
Why it improves |
|
Lead time |
Long cycle; hard to see small stops |
Shorter cycle; earlier detection |
↓ |
Live status and eKanban by real use |
|
First-pass yield (FPY) |
More rework; late mismatch detection |
Higher FPY with instation checks |
↑ |
Digital work instructions with tolerances |
|
Unplanned stops |
Frequent microstops, no categories |
Fewer stops through clear categories |
↓ |
Taxonomy + realtime tracking |
|
Changeover stability |
Settings vary by shift |
More stable first piece after change |
↑ |
One source of truth for parameters/recipes |
|
Traceability |
Scattered records |
Consolidated lot/unit history |
↑ |
Automatic MES records from the workflow |
|
Schedule adherence |
Many hot fixes |
Better plan adherence |
↑ |
Replenishment by consumption; shorter cycles |
Table 2. Barriers and quick fixes
Typical barrier Fix
|
Low digital skills |
Targeted training; short daily coaching |
|
Fragmented systems / vendor lock-in |
Common data model; open interfaces |
|
Unclear data ownership |
Governance: metric owners & access rules |
|
OT cyber risk |
Network segmentation; least privilege; audits |
|
Too much information |
Role-based views; short exception lists |
|
Limited budget |
Phase the rollout; start at bottlenecks |
Table 3. Phased roadmap (what to do first)
|
Phase |
What it means |
Typical tools |
Example metrics |
|
1 – Instrument the bottleneck |
Sensors & counters on the critical station |
Counters; event taxonomy; live boards |
Lead-time to detect; Availability |
|
2 – Digital work instructions + checks |
Built-in tolerances; confirm in station |
Digital WI; checklists; first-article OK |
FA pass rate; FPY; scrap |
|
3 – One database for parameters/recipes |
Lower variation after change |
Parameter repo; version control |
First-article variation; takt stability |
|
4 – eKanban and WIP visibility |
Replenish by use; calmer flow |
Consumption signals; stock tracking |
Stockouts; plan adherence |
|
5 – Scale and standardize |
Spread under shared model & security |
RAMI 4.0 map; interface standard |
Integration time; OEE; OTIF |
Table 4. Roles and what each needs to see
|
Role |
Useful visuals |
|
Operator |
Simple status + next action |
|
Line lead |
Exception list and bottleneck status |
|
Maintenance |
Pareto of micro-stops; failure trends |
|
Engineering |
Parameter trends; recipe history |
|
Quality |
Pareto of defects; MSA status |
|
Planning/Logistics |
WIP and consumption signals; eKanban |
Table 5. OEE mapping – where the gains come from
|
OEE Part |
Mechanisms from the paper |
|
Availability |
Classify micro-stops; reaction plans; CM/PM |
|
Performance |
Speed profiles; standardized setups |
|
Quality |
In-station checks; tolerances; single recipe base |
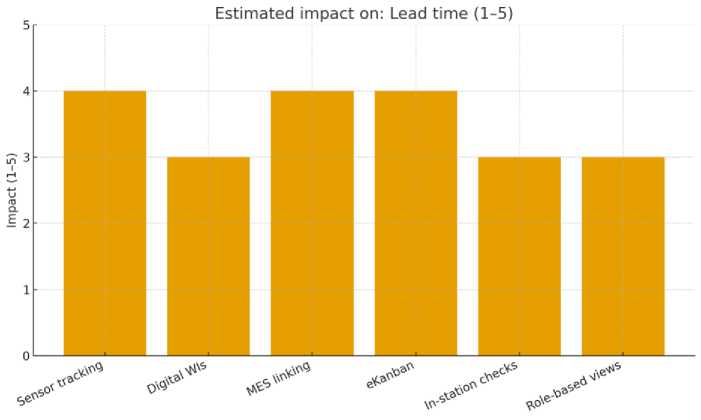
Figure 1 : Estimated impact on Lead time (1–5).
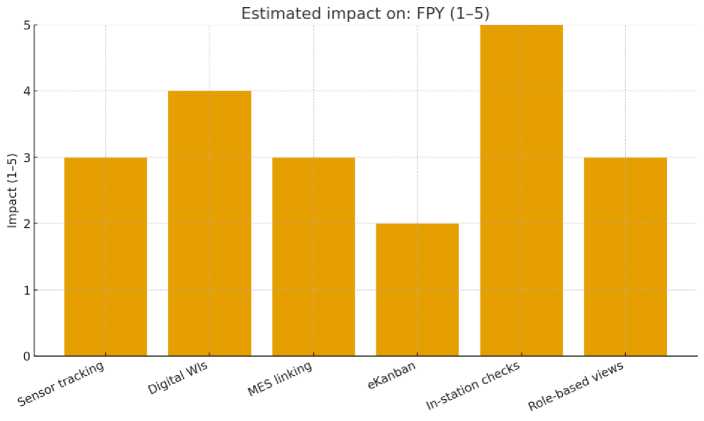
Figure 2 : Estimated impact on FPY (1–5).
Estimated impacton: Unplanned stops (1-5)
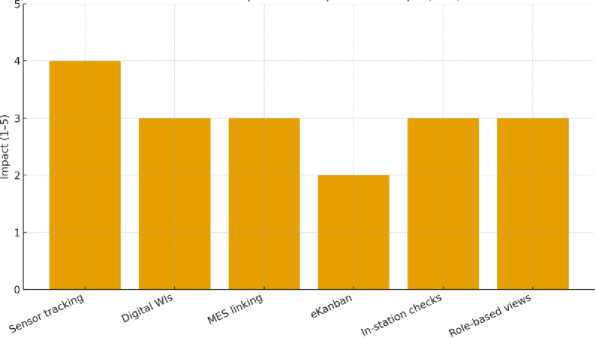
Figure 3: Estimated impact on Unplanned stops (1–5).
Estimated impact on: Chanqeover stability (1-5)
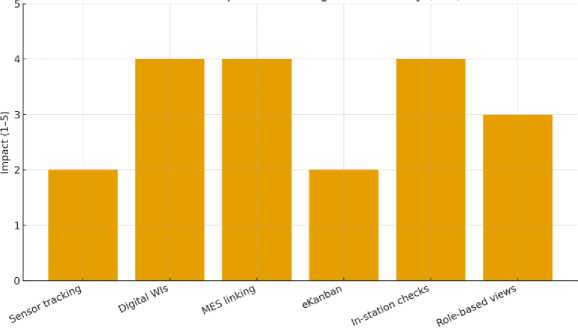
Figure 4: Estimated impact on Changeover stability (1–5).
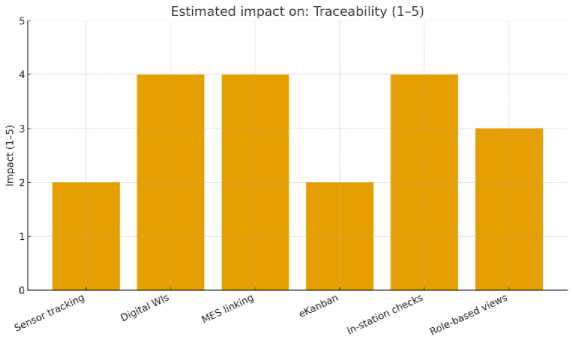
Figure 5 : Estimated impact on Traceability (1–5).
Conclusions
This study demonstrates that the introduction of sensor-based monitoring, digital work instructions, and lightweight MES connectivity reliably translates into operational gains—shorter lead times, higher first-pass yield, fewer unplanned stoppages, steadier changeovers, and stronger traceability. Crucially, these gains did not arise from technology in isolation.
They became durable when visibility was coupled with clear ownership of data and processes, role-appropriate visualizations that convert telemetry into timely action, and standardized problem-solving routines practiced at a regular cadence. In practical terms, digitalization creates value when information, people, and standard work are aligned; sensors and dashboards are only enabling components of that alignment, not ends in themselves. A central implication is that sequencing matters as much as scope. Digitalization should advance in lockstep with organizational readiness, beginning at high-leverage stations where modest increases in transparency yield immediate improvements in throughput and quality. Early wins reduce skepticism, release capacity for further change, and provide concrete data for refining definitions and escalation rules. As capabilities expand, organizations require a shared vocabulary so that metrics signify the same thing across shifts, product families, and departments. Escalation thresholds must be unambiguous, reaction plans must be visible at the point of use, and changes to definitions should occur under version control with clear communication. Capability building must progress alongside deployment; frontline teams need targeted upskilling—from digital literacy and basic data interpretation to structured problem solving, root-cause analysis, and disciplined follow-up—so that new signals lead to faster, better decisions rather than to cognitive overload.
The analysis also underscores that scalability rests on interoperability and cybersecurity as boundary conditions. Fragmented, vendor-locked interfaces create analytical dead zones, inhibit cross-line learning, and slow improvement cycles by forcing repeated data reconciliation. Even where islands of excellence emerge, their lessons travel poorly if the underlying data models cannot interoperate. Likewise, connecting machines without a security baseline enlarges the attack surface of OT networks and can jeopardize availability—the very KPI digitalization seeks to improve. Architectures should therefore be designed to integrate and protect by default, mapping assets to a reference model, segmenting networks, enforcing least-privilege access, and auditing actions where physical processes meet information systems. When integration and protection are treated as first-order design constraints, each new connection strengthens the system rather than adding brittle complexity. Although the synthesis relies on secondary sources and a single illustrative case, the underlying mechanisms were consistent. In-station instrumentation shifted detection upstream so that non-conformities were found nearer their point of origin; single sources of truth for parameters and work instructions stabilized changeovers and reduced intershift variability; and role-specific visual management reduced decision latency by matching information density to attention budgets. These mechanisms are mutually reinforcing.
Better instrumentation increases the reliability of visuals; better visuals make standardized problem solving more effective; better routines, in turn, generate the feedback needed to refine instrumentation and definitions. The enduring lesson is that performance improves when the technical system and the social system co-evolve.
From a managerial standpoint, the evidence supports a pragmatic roadmap that privileges method over magnitude. Begin by instrumenting one constraint station and making its losses legible in real time to the people who can act within minutes. Embed first-article checks and parameter acknowledgments into digital work so that changeovers stabilize and early variability is contained. Use short, cadence-based tier meetings to convert visibility into action, and treat each problem as an opportunity to refine definitions, thresholds, and reaction plans. As signals stabilize, extend instrumentation laterally to adjacent stations, codify shared data models, and simplify interfaces. Resist the temptation to “connect everything to everything” before routines mature; scale is a property of clarity, not of size. Throughout, preserve a single forum that governs changes to metrics, dashboards, alarms, and master data, because trust in information erodes quickly when definitions drift. Economic evaluation should reflect the multi-dimensional character of benefits.
Traditional business cases anchored only in labor productivity or headline OEE understate payback because they miss reductions in variability, scrap, rework loops, energy waste during idle, and the option value of faster integration for new products or machines. Conversely, they also risk overstating benefits if they ignore the cost of integration debt and the risk premium associated with weak security postures. A balanced view treats digitalization as a portfolio of sequenced bets, each tied to specific leading indicators—time-to-detect, time-to-acknowledge, first-article pass rate, adherence to reaction plans—and only secondarily to lagging outcomes. Where leading indicators do not move, lagging improvements rarely sustain; where they do move, improvements in throughput and quality tend to follow with a predictable delay.
Workforce implications require equal emphasis. Digitalization changes what good performance looks like at each role. Operators become stewards of standardized work augmented by sensors and prompts; line leaders become managers of exceptions and coaches of problem solving; engineers spend less time firefighting and more time curating parameter libraries, improving data quality, and designing experiments; quality functions shift effort upstream toward in-station prevention rather than downstream inspection; planners learn to treat consumption signals as the primary driver of replenishment. These shifts demand intentional training paths and role redesign.
Without them, new tools can increase cognitive load and diffuse accountability, producing more alerts but fewer effective actions. With them, the same tools become amplifiers of human judgment, compressing the distance between signal and response. Policy and ecosystem considerations also emerge from the analysis. Suppliers, system integrators, and equipment vendors shape the feasibility of interoperability through the openness of their interfaces and the quality of their documentation. Manufacturers benefit when they insist on minimal common data models, explicit event taxonomies, and portable parameter sets as conditions of purchase. Public bodies and industry associations can accelerate diffusion by standardizing vocabularies, publishing reference architectures, and supporting cross-firm learning networks that share patterns and pitfalls. Small and medium-sized firms—which often lack dedicated OT/IT integration staff—stand to gain from modular solutions that embed good defaults for security, naming conventions, and basic governance, reducing the fixed costs of entry.
Sustainability co-benefits provide a further rationale. The same telemetry used to reduce scrap and unplanned downtime can identify idle energy draws, compressed-air leaks, and suboptimal tool-wear profiles. When maintenance is routed by condition rather than by calendar, energy and material intensity decline alongside costs. When rework loops shrink, carbon per good unit falls. Aligning operational dashboards with resource metrics helps ensure that improvements in quality and delivery reinforce environmental performance rather than compete with it. In this way, digitalization supports not only the traditional triangle of quality, delivery, and cost, but also resource stewardship.
Limitations should temper the strength of inference but not the confidence to act. Secondary sources inevitably reflect reporting biases, and a single illustrative case narrows external validity. Sectoral, cultural, and regulatory differences may moderate effects, as may variations in starting maturity and product mix. Yet these constraints do not negate the observed mechanisms; they simply require that adoption be preceded by site-specific diagnostics and followed by measurement designs that disentangle signal from noise. Prospective field studies that pair phased rollouts with pre-declared hypotheses about mechanisms—how a quality gate should change time-to-detect and rework within a defined window, how an eKanban loop should alter schedule adherence under specified variability—would enrich the evidence base and accelerate learning across sites.
Taken together, the findings converge on a simple but powerful conclusion. Technology sets the ceiling, but governance, routines, and skills set the floor—and most observed variance lives in the space between them. Plants that treat digitalization as an organizational operating-system upgrade—defining how the enterprise will sense, decide, and act; building the minimal architecture that enables those behaviors; and developing the people who will run it shift after shift—realize sustained improvements in quality, delivery, and cost. Plants that pursue technology without organizational foundations often experience partial, transient, or local gains that fade as novelty dissipates. The difference is not access to tools but the discipline with which information is defined, displayed, and used. In closing, the study supports a pragmatic posture for leaders. Start with leverage and clarity, not with size. Make losses visible where action is immediate. Encode standards in digital work and verify them at changeovers. Govern definitions in one place and change them deliberately. Design visuals for action, not for admiration. Secure availability as you connect. Teach people how to act on data, and measure whether they do. When these habits compound, sensorization, digital work instructions, and MES connectivity stop being projects and become the way the factory thinks and behaves. Under those conditions, digital transformation is neither mystery nor fad; it is method—applied patiently, sequenced intelligently, and sustained by the people whose daily decisions make performance real.
Acknowledgments
The author gratefully acknowledges the guidance of the academic supervisor and the helpful comments of the anonymous reviewers. Special thanks go to the partner factory for granting access to operational documents and for facilitating interviews with production, maintenance, and quality teams. The author also thanks colleagues who assisted with data organization and visualization, as well as the language editor for proofreading support. Any remaining errors are the author’s own.
Conflict of interests
The authors declare no conflict of interest.
