Balanced scorecard based approach in modeling a business intelli-gence system

Author: Zoran Savić, Miroslav Huđekr
Journal: Social Informatics Journal @socialinformaticsjournal
Article in issue: 2 vol.2, 2023.
Free access
This paper is a part of a wider research, the goal of which was to develop a model of strategic school management at the local and regional level in order to effectively manage schools. The proposed model is based on business intelligence, or advanced analytics of business performances that will enable timely, efficient and fair management of school resources, which the state has delegated to local governments.The performance management of schools should be based on financial and nonfinancial performance indicators. The balanced scorecard (BSC) may be a suitable method for that. This paper investigates the possibility of implementing balanced scorecard in the area of school management. The presented BSC model is developed for school management on local and regional level in Croatia. Defined are perspectives of BSC, strategic objectives and perfor-mance measures related to these objectives. The presented model is universally applicable. It is intended for founders - Local and Regional Administration in countries with similar legislation. For the application of the model any founder should enter realized values, master data and the scope of activities for its school system.
Balanced scorecard, performance management, school management
Short address: https://sciup.org/170203977
IDR: 170203977 | UDC: 37:005.336.1 | DOI: 10.58898/sij.v2i2.37-48
Text of the scientific article Balanced scorecard based approach in modeling a business intelli-gence system
The main mission of educational institutions is to provide benefit for the society, and in order to ensure that they deliver their main mission, it is necessary to measure weather they have achieved their strategic objectives (Yuksel and Coskun, 2013).
Since 2001, based on several legislative acts in Croatia, the regional government has taken over from the state financing of schools, current and investment school maintenance, reconstruction, expansion and construction of school facilities, according to defined standards (Official Gazette, 2012).
It introduces a new dimension in the organization and management of education at the local level and generates the need for a management tool that allows the performance management of the schools, based on financial and nonfinancial performance perspectives.
A frequently used method of performance management is the Balanced Scorecard method (BSC). BSC method allows you to connect multiple targets in order to measure overall success of the business system in a balanced way, where “success” refers to the long-term stability and effectiveness of implementing a strategy to achieve your own mission (Kaplan, Norton, 1996).
The balanced scorecard approach provides a clear prescription for what companies should measure to ‘balance’ the financial perspective. The actual performance is measured, and corrective interventions are made as required, based on the difference between the measured value and an ex-pected value. Managers are alerted to areas where performance deviates from expectations, so they can focus their attention on these areas. It enables executives to truly control the execution of their strategies across the entire organization, or in the part of the organization they lead (Muraldharan, 2004).
Although it has flexible structure, largely dependent on the business area and specific needs of the organization (Davis, 2005), the main characteristics of BSC are its focus on the strategic issues of the organization and the monitoring of financial and non-financial indicators of organizational perfor-mances, grouped in different (balanced) perspectives.
The number and type of perspectives depends on the type of business system, and the most commonly used perspectives are:

© 2023 by the authors. This article is an open access article distributed under the terms and conditions of the Creative Commons Attribution (CC BY) license .
-
- Financial (financial performances - investors and stakeholders view)
-
- Customer (satisfaction)
-
- Internal Business Processes (efficiency that can be improved)
-
- Learning and Growth (organizational capacity and knowledge to be improved).
For each perspective of BSC, strategic objectives (desired outcomes) and performance measures for these objectives are defined. Progress toward attaining an objective is assessed by one or more measures. As with perspectives, there are causal relationships between objectives. It is critical to set measurable, strategically relevant, consistent, time-delineated objectives.
Measures are the indicators of how a business is performing in relation to its strategic objectives. In order to measure the value of indicators or monitor the progress value, it is necessary to set target values for each, as well as certain thresholds between the upper and a lower limits. The task to set targets is very hard and can be a source of many problems. For example, if set too high, targets create stress and de-motivation; if set too low, targets encourage complacency. The history values may play important role to set targets correctly (Meekings, Briault and Neely, 2011).
Objectives and measures are interconnected and linked to the long term vision, following a cause-and-effect relationship. This linkage is described in the BSC strategy maps, to show relationship between the perspectives (Kaplan 2001).
An initiative is a change process or activity, designed to achieve one or more objectives. The initiative is what will move a measure toward its target value.
The strategy matrix is another useful visualization and summarization tool. It displays objectives, measures, targets, and initiatives in one table. The strategy matrix can point to areas where scorecard elements might be out of balance. For example, there may be a cluster of initiatives around one objective, while other objectives have no supporting initiatives. This can be useful when prioritizing spending for projects.
Balanced scorecard has been widely adopted, and has been found to be the most popular performance management framework in a recent survey (Rigby and Bilodeau, 2013).
Modifications of BSC perspectives were made to better adapt to a variety of industries such as the public sector, information systems, supply chain management, corporate and social sensitivity, etc.
Many authors give instructions for determining goals in non-profit organizations, dividing them into primary and secondary objectives. The primary objectives to be achieved are financial success and customer relationship, and secondary objectives are internal processes and learning, growth and development (Kloot and Martin, 2000).
School management in the public sector aims to achieve the goals and objectives established by law and to improve the general education level of society. Therefore, nonfinancial factors (service quality, for example) are as important as financial ones.
Having an insight into theavailable references, it can be be noted that there are no research articles in the area of BSC modeling that would support decision-making in the school system at the local level. There are only certain examples of the BSC application in the nonprofit or public sector (Northcott and Taulapapa, 2012), especially in health services (Radnor and Lovell, 2003), or in the in-ternal management of educational institutions, in order to support their mission and strategy in an in-creasingly competitive environment (Pereira and Nuno, 2012).
Materials and methods
The main goal of the research was to define a general model of strategic school management at the local and regional level, based on business intelligence, i.e. advanced analytics of business performances. In accordance with the goals defined in this way, the following research tasks were:
-
- explore the organization and management of the school system at the local level,
-
- explore the way of school financing at the local level,
-
- determine the non-financial performance indicators in education at the local level,
-
- create a model of performance management based on pre-defined criteria
-
- incorporate that model into a broader system of strategic school management at the local level.
This paper presents the results of activities in the implementation of the last two tasks - creating and implementing performance management model in the system of school management at local and regional level in Croatia.
The study is based on a sample of 33 primary and 14 secondary schools established by the
Varaždin County in Croatia. In total, these schools count 19,000 students and 2,800 employees (teachers and staff).
The proposed BI model for decision support in school management, on the highest level, is shown on Fig. 1 (Hudjek, Savic and Radovic, 2017) .
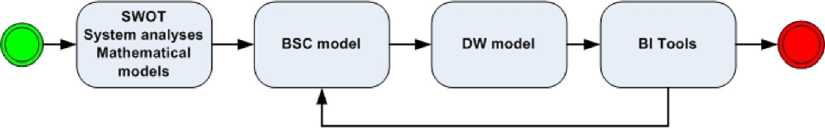
Figure 1. BI model for decision support in school management
During the preparation of this model, a comprehensive analysis of the school system at the lo-cal level is carried out, especially the analysis of the structure of the school budget. A mathematical model for the financing of education at the local level was created, which gives a clear picture of the relationships within the school’s activities and the relationships between schools. Based on this, key performance indicators are defined, which will be monitored and analyzed.
Taking into account the theoretical principles, mentioned in the previous chapter, the strategic management of primary and secondary school systems at the local and regional level in Varaždin County is defined as follows.
The vision of the Varaždin County in the area of strategic management of the school system is “developing a stable education system”. From the vision defined in this way, the following objectives are set:
-
- Provide funds for the stable operation of schools and development,
-
- Ensure business efficiency
-
- Provide financial, educational and generational equality
-
- Provide an environment where excellence is encouraged.
Decomposition of defined objectives is shown on Fig. 2, and the strategy to achieve the goals is defined as follows:
“To develop educational system of equal opportunities where success comes through excel-lence.”
Since it is important to adapt the number and type of perspectives to the organizational context, traditional perspectives need to be modified. Therefore, for the school management system, the fol-lowing BSC perspectives are proposed: Finance, Equality, Efficiency and Excellence.
Financing is a key activity in the strategic management of primary and secondary education. It should answer the question: How to provide financial resources to enable the core mission? The financing of primary and secondary schools is carried out by the budget. The starting point was to define the scope of activities for primary and secondary schooling: the number of students, the number of employees and the number of class departments, as criteria for financing activities of each school. Statistical analysis showed that the number of class departments is the most suitable criteria for financing, and regression analysis showed that polynomial mathematical model y = 329,94x2 + 3850,6x + 341704 for primary, and y = -361,09x2 + 58005x + 77336, for secondary education, can represent a way of financing primary and secondary education at the level of regional self-government, where y is an annual financial amount for each school, and x is the number of class departments in the school (Hudjek, 2014).
Equality in primary and secondary education is viewed through financial, educational and generational equality, and the perspective of equality should indicate which areas, programs and activities should be paid attention to, in order to enable the educational system of equal opportunities. Financial equality refers to the determination of the minimum financial standard for material and financial expenditures of schools, which must allow that regardless of their pedagogical standard, schools can operate freely, and carry out their task of education. Pedagogical equality is defined through the implementation of the National Pedagogic Standard for Elementary and Secondary Education, and the task of regional governments is to ensure uniform pedagogical standards in all schools. Generational equality enables the formation of an educational system of equal opportunities, regardless of the social status of students.
The effectiveness of primary and secondary education can be seen through an increase of re-sults without an increase in funding. This approach is based on the improvement of existing systems through measures and activities in the field of equality and through programs of excellence. Perspec-tive efficiency should indicate those activities that should be implemented in order to achieve the in-tended objectives.
Excellence is defined through seven areas of work in schools that are extremely important for the functioning of education: lifelong learning, attitude towards business on the principles of good management, encouraging learning for competence in a real working environment, promoting sus-tainable development, computerisation, introduction of project financing and working with talented stu-dents. The perspective of excellence shows which areas, programs and activities should be used to ensure strategic advantage.
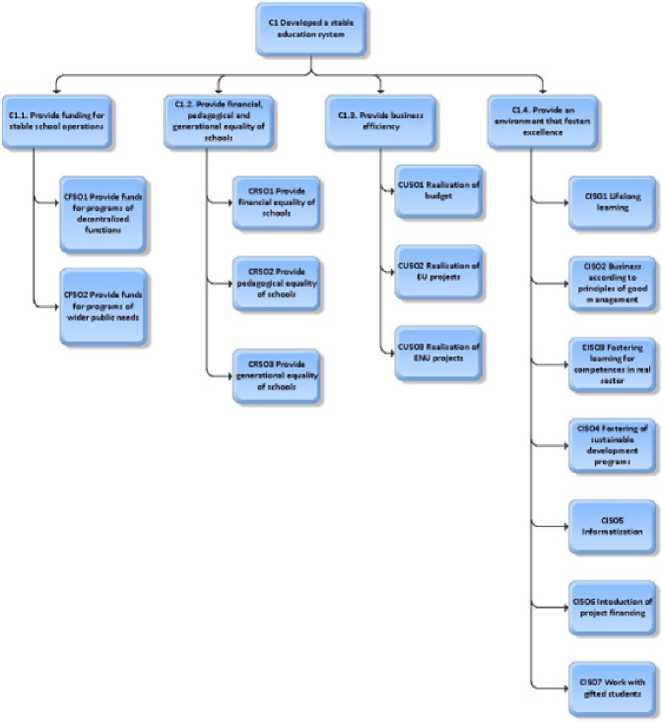
Figure 2. Decomposition of the objectives in regional education administration
The areas examined in this study are universal for all schools and are extremely important in determining educational functionality, as they demonstrate the pervasive attitude towards life-long learning and an entrepreneurial attitude focused around a prudent business principle, encouraging learning competences in the real economy, promoting sustainable development, computerisation and introducing financed projects for talented students.
Objectives, measures, limits and activities are defined for each perspective, and each perspec-tive is shown at the level of strategic decision-making, management and operational performance. For the purposes of this paper, only strategic level was considered. For easier tracking and the preparation of a computerized model, different colors and the codes are used for each part of the perspective.
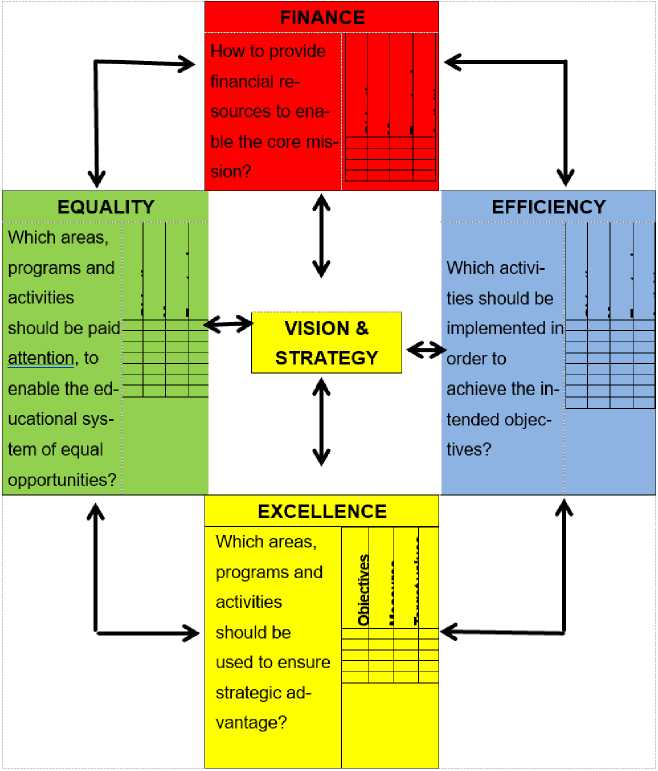
Figure 3. Perspectives of modified BSC modrl
Results and Discussion
Based on the decomposition of goals, measures, limits and activities for finance, efficiency, eq-uity and excellence, the strategic maps of objectives and measures are created.
From the strategic map of objectives (Figure 4), it is evident that the realization of the objec-tives from the perspective of Excellence within its limiting values, affects the implementation of the three objectives from the perspective of Efficiency, which belong to the secondary goals, and one ob-jective from an Equality perspective, which is one of the primary goals. Also, the realization of two ob-jectives from the perspective Efficiency affects two objectives in perspective Equality, and three objec-tives from the same perspective have an influence on two objectives in perspective Finance. Finally, in the perspective of Equality, three objectives affect two objectives in perspective Finance, and one af-fects the realization of a objective within the same perspective.
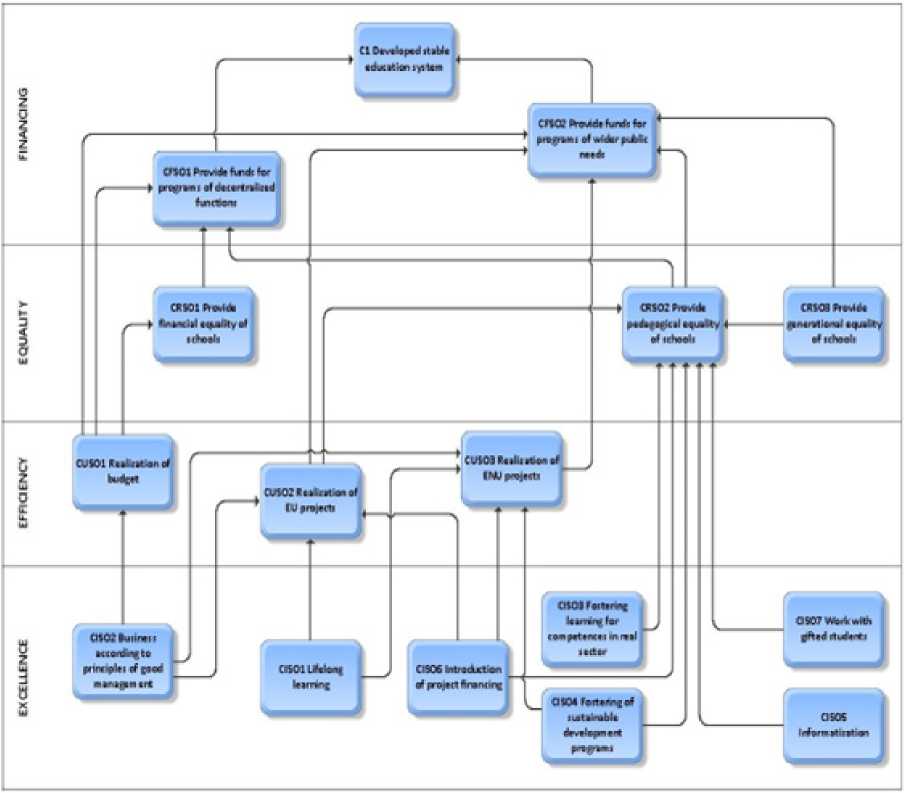
Figure 4. Strategic map of objectives
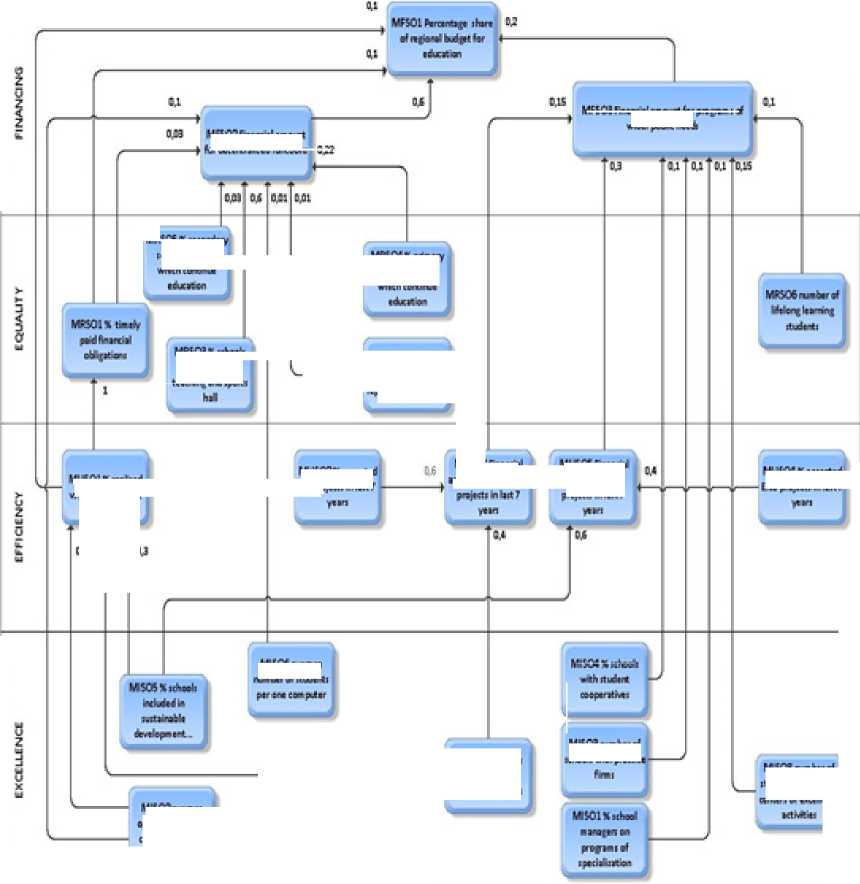
From the strategic map of measures (Figure 5), it is evident that implementation of three measures from the perspective of Excellence affect the three measures from the perspective of Effi-ciency, and six measures affect two measures from the Finance perspective.
Implementation of three measures from the perspective of Efficiency affects the two measures from the perspective of Finance, and two measures affect the measures within the same perspective.
Six measures from Equity perspective have an influence on three measures from Finance perspective, and implementation of two measures from Finance perspective affects one measure with-in the same perspective.
V Vjlt:!^:
VlS06ivt*>tt гчмЬно^ rtudf^ii
WSUlhr-KY» weoxt ГОГ pfSfTWI cr wide# Mt A
MrSO'tvt'ttt
DH«#Ht CVttpK
Figure 5. Strategic map of measures
Sy dwityeltbd hf-<»e«x 322
MRSOS'WwKidNV : :ho»J :bd«r<:
w*heseihA t«K>w»ndiwti
MfWXYrtevv
MRS02-W pr^#»B^M^ ч^гиеЧНикЧгц
MVS01*n*ed я ^emed WgH
MU$02l*xtfttd tV preftei in hrt 7
MUS 03 Гу .«J, I w*rte#fiMIU
M USC* Frye,*
wwestiwleitJ
WVXMW tainted №»«»«> hint 7
M
P.1
M$07XfMi niuMmtU ^HBRC^j ywittti
МГ$03^йг«# xledkwMMMMi
MSOi^je^tfe# tbidrUi г-якей r oiretn о/ eini •< rut
Description of measures at the strategic level and their target values are presented in Table 1, where G is the upper limit or maximum, g is the upper threshold, d is the lower threshold, and D is the lower lim-it, or minimum, of each measure. When the value of the measure is between G and g, it is a good achievement of given objectives and no activities are required. The value of the measure between d and D indicates that objectives are poorly realized, and urgent activities are necessary.
Independent (leading) measures (m5, m7, m10-m22) with their realized values are directly entered into the BSC, and they are used for calculating dependent or lagging measures (m1, m2, m3, m4, m6, m8, m9).
Table 1
Measures and target values
|
Value label |
Measure |
Target values |
|||
|
G |
g |
d |
D |
||
|
MFS01 - percentage share of regional budget for education |
65 |
60 |
50 |
45 |
|
|
m2 |
MFS02 - financial amount for decentralized functions (mil.) |
65 |
60 |
50 |
45 |
|
m3 |
MFS03 - financial amount for programs of wider public needs (mil.) |
70 |
65 |
50 |
45 |
|
ГГЦ |
MUS01 - percentage of realized vs. planned budget |
100 |
99 |
97 |
96 |
|
ms |
MUS02 - percentage of accepted EU projects in last 7 years |
100 |
90 |
60 |
50 |
|
me |
MUS03 - financial amount of realized EU projects (mil.) |
70 |
60 |
20 |
10 |
|
my |
MUS04 - percentage of accepted ENU projects in last 7 years |
100 |
80 |
60 |
50 |
|
m3 |
MUS05 - financial amount of realized ENU projects (mil.) |
80 |
70 |
20 |
10 |
|
ГП9 |
MRS01 - percentage of timely paid financial obligations |
100 |
98 |
95 |
94 |
|
mw |
MRS02 - percentage of professionally represented teaching |
100 |
99 |
92 |
90 |
|
mn |
MRS03 - percentage of schools with one shift teaching and sports hall |
100 |
95 |
80 |
70 |
|
ПП12 |
MRS04 - percentage of primary school students which continue education |
100 |
97 |
90 |
80 |
|
ПП13 |
MRS05 - percentage of secondary school students which continue education |
80 |
70 |
55 |
50 |
|
mn |
MRS06 - number of "lifelong learning" students |
3000 |
2500 |
700 |
500 |
|
mis |
MISO1 - percentage of school managers on programs of specialization |
100 |
90 |
40 |
30 |
|
mi6 |
MIS02 - average operating cost per one class department |
1700 |
2200 |
4000 |
5000 |
|
mi? |
MIS03 - number of schools with practice firms |
14 |
12 |
6 |
4 |
|
mw |
MIS04 - percentage of schools with student cooperatives |
100 |
90 |
60 |
50 |
|
mw |
MISOS - percentage of schools included in sustainable development programs |
100 |
90 |
35 |
25 |
|
m20 |
MIS06 - average number of students per one computer |
1 |
5 |
20 |
24 |
|
m2i |
MIS07 - percentage of schools included in EU financing projects |
100 |
80 |
30 |
25 |
|
m22 |
MISOS - number of students involved in centers of excellence activities |
800 |
600 |
300 |
200 |
Based on strategic maps, weighting factors (ki) and target values, the following formula calculates the values of the dependant measures (ms), from the values of independent measures (mi):
Л ms- Ds + ^-D^ .^ki- (. D
The elements of strategic matrix are presented on Table 2.
Table 2
The ele ments of strategic matrix
|
Develop educational system of equal opportunities in which success comes through excellence |
|||||||
|
Objective |
Measure |
Target |
Initiative |
||||
|
G |
g |
d |
D |
||||
|
о 03 с |
CFSO1 CSFO2 |
MFS01 |
65 |
60 |
50 |
45 |
AFSO1 AFSO2 |
|
MFS02 |
65 |
60 |
50 |
45 |
|||
|
MFS03 |
70 |
65 |
50 |
45 |
|||
|
го сг ш |
CRS01 CRS02 CRS03 |
MRS01 |
100 |
98 |
95 |
94 |
ARSO1 ARSO2 ARSO3 ARSO4 ARSO5 ARSO6 |
|
MRS02 |
100 |
99 |
92 |
90 |
|||
|
MRS03 |
100 |
95 |
80 |
70 |
|||
|
MRS04 |
100 |
97 |
90 |
80 |
|||
|
MRS05 |
80 |
70 |
55 |
50 |
|||
|
MRS06 |
3000 |
2500 |
700 |
500 |
|||
|
с Ф о а= ш |
CUS01 CUS02 CUS03 |
MUS01 |
100 |
99 |
97 |
96 |
AUSO1 AUSO2 AUSO3 |
|
MUS02 |
100 |
90 |
60 |
50 |
|||
|
MUS03 |
70 |
60 |
20 |
10 |
|||
|
MUS04 |
100 |
80 |
60 |
50 |
|||
|
MUS05 |
80 |
70 |
20 |
10 |
|||
|
0) о с ф ф о X ш |
CIS01 CIS02 CIS03 CIS04 CIS05 CIS06 CIS07 |
MISO1 |
100 |
90 |
40 |
30 |
AIS01 AIS02 |
|
MIS02 |
1700 |
2200 |
4000 |
5000 |
|||
|
MISOS |
14 |
12 |
6 |
4 |
|||
|
MISO4 |
100 |
90 |
60 |
50 |
|||
|
MIS05 |
100 |
90 |
35 |
25 |
|||
|
MIS06 |
1 |
5 |
20 |
24 |
|||
|
MIS07 |
100 |
80 |
30 |
25 |
|||
|
MISOS |
800 |
600 |
300 |
200 |
|||
Initiatives or activities on strategic level are:
-
- AFSO1 - Analysis of programs and activities which ensure financial stability of elementary schools
-
- AFSO2 - Analysis of programs and activities which ensure financial stability of secondary schools
-
- ARSO1 - Analysis of financial needs of elementary schools
-
- ARSO2 - Analysis of financial needs of secondary schools
-
- ARSO3 - Analysis of the pedagogical needs of primary schools
-
- ARSO4 - Analysis of the pedagogical needs of secondary schools
-
- ARSO5 - Analysis of needs which ensure generational equality of elementary school students
-
- ARSO6 - Analysis of needs of which ensure generational equality of secondary school students
-
- AUSO1 - Training and equipping of schools for the implementation of the budget programs
-
- AUSO2 - Training schools for writing and implementation of EU projects
-
- AUSO3 - Training schools for writing and implementation of ENU projects
-
- AISO1 - Analysis of programs that provide excellence in primary education
- AISO2 - Analysis of programs that provide excellence in secondary education
In the BSC method it is common to use about twenty measures (22 measures were used in this study), which at first glance does not seem complex and are considered to be traced manually, or by using simple office software tools. However, when these measures are distributed across different areas, on strategic, management and operational levels, and when it is necessary to collect data, create reports and distribute them throughout the organization, then the problems become more complex and it be-comes necessary to use software tools and develop computer models.
In the above described project, software tool Corporater EPM Suite has been used for the development of a computer model of strategic school management at the local level.
An example of using software tool is shown in Fig. 6, which presents results of measure MFSO1 – a share of regional budget for education in total budget, or report about measure values per year (Fig.7).
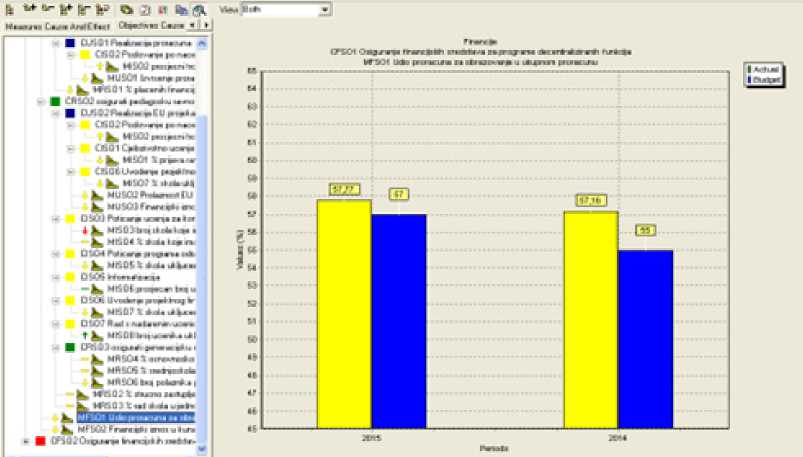
Figure 6. Results of MFSO1 measure
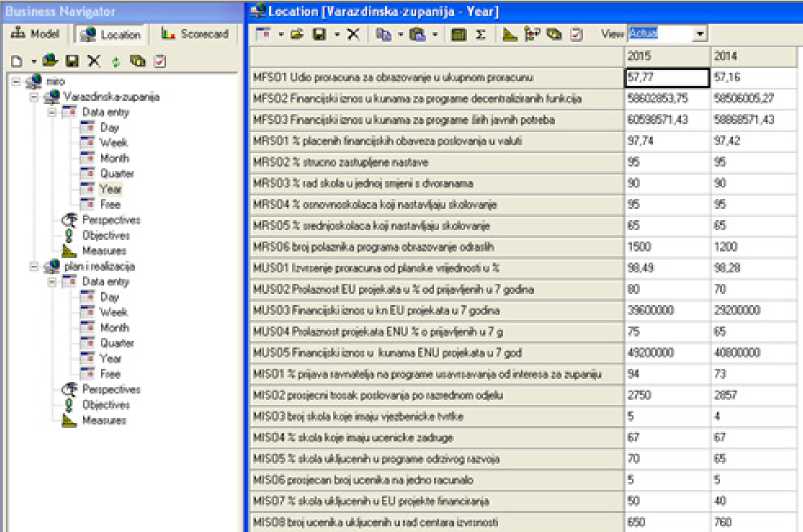
Figure 7. Values of realized measures per year
Conclusions
In order for schools to achieve their main mission in accordance with legal regulations and the strategy of regional self-government, they should measure whether they have achieved strategic objectives, or not. Although known and implemented for almost 20 years, BSC has not been applied in school management at the regional level. As one of the first papers about BSC implementation in school management at local level, it shows how BSC can be adapted to the specific requirements of school management.
The purpose of this paper was to explore the benefits and possibilities of BSC implementation in school management at the local level in Croatia.
The study shows that it is possible to apply the BSC, and there are benefits in monitoring performance using this method, especially in the proper and equitable financing of primary and secondary education. Careful and context-specific definition of the BSC perspectives, with their goals, measures and activities, is the most important step in the application of this method.
The principle of “learning from the best” is used, and the main information is obtained from publicly available materials and personal contacts. These data are analysed by comparing to the “best”, according to the criteria of the budget, the salary of employees, school equipment and pedagogical standards. Based on this analysis, a plan of changes, or improvements, is developed. The local author-ities now have a tool which can help them to answer on some of questions:
-
- Why the school has an expense,
-
- How the school makes a decision on certain expenditure,
-
- What are the characteristics of spending during the lifetime of the school?
-
- What happens outside the school, and has an impact on the behaviour of school expendi-tures?
-
- What are the expectations of school after spending?
Once developed, the BSC tool can be used on a wider scale (for all local and regional authori-ties in the country) because they share a similar vision and broader strategic objectives, aligned with the national strategy in education.
The results of this study may be of importance to practitioners who wish to make BSC implementation more effective.
Some limitations in the study are the fact that research has covered only 1 Croatian county, out of 21 regional self-government units. The great opportunity is to implement the methodology and ex-pand the research to other counties in different regions or even abroad.
The possibility of further development of this system exists in the area of bussines intelligence, when enough historical data is collected, and in the possibility of connecting with databases that are not owned by the local administration.
Development of the system in these areas will enable obtaining new information and knowledge for local government, for monitoring of the actual, and predicting the future state of primary and secondary education in the region, proactive detection of deficiencies in future conditions in pri-mary and secondary education and adaptation and timely modification of the strategy of primary and secondary education.
References Balanced scorecard based approach in modeling a business intelli-gence system
- Davis, F. R. (2005), Strategic management: Concepts and cases, Prentice Hall, NJ
- Huđek, М. (2014), Мatematički model za finansiranje osnovnog i srednjeg školstva na razini područne samouprave, Praktični menadžment, Vol V, no 2: 61-69
- Huđek, M., Savić, Z., Radović, D. (2017), Modelling a BI System for School Management on Local Government Level, Tech-nical gazette, Vol 24, No 3, 709-716
- Kaplan, R.S. (2001),”Strategic Performance Measurement and Management in Nonprofit Organizations.” Nonprofit Manage-ment & Leadership 11(3): 353–370.
- Kaplan, R S., Norton D. P. (1996) “Using the Balanced Scorecard as a Strategic Management System,” Harvard Business Review (Jan-Febr. 1996): 76.
- Kloot, L., Martin, J. (2000) “Strategic Performance Management: A Balanced Approach to Performance Management Issues in Local Government” Management Accounting Research 11, no. 2: 231–51.
- Meekings, A., Briault, S., Neely, A. (2011), How to avoid the problems of target-setting, Measuring Business Excellence, Vol. 15 Iss: 3, 86 – 98.
- Muralidharan, R., (2004), “A framework for designing strategy content controls” International Journal of Productivity and Per-formance Management 53 (7): 590–601.
- Northcott, D.,Taulapapa, T.M. (2012), “Using the balanced scorecard to manage performance in public sector organiza-tions” The International Journal of Public Sector Management 25 (3): 166–191.
- Official Gazette of The Republic of Croatia (Narodne novine): Law on Education in Primary and Secondary Schools, NN 87/08, 90/11, 5/12,16/12
- Pereira, M.M., Nuno, F.M. (2012), The implementation of the balanced scorecard in a school district: Lessons learned from an action research study, International Journal of Productivity and Performance Management, Vol 61 Iss:8, 919-939
- Rigby, D.; Bilodeau B. (2013), “Bain and Company’s Management Tools and Trends Survey 2013” Bain & Company. http://www.bain.com/publications/articles/management-tools-and-trends-2013.aspx
- Yuksel, H., Coskun, A. (2013), Strategy focused schools: an implementation of balanced scorecards in provision of educa-tional services, Procedia - Social and Behavioral Sciences 106, p.2450-2459, Elsevier
